Home > Comparison > Technology > GLOB vs DXC
The strategic rivalry between Globant S.A. and DXC Technology Company shapes the evolution of the global technology services sector. Globant operates as an innovative digital transformation leader, focusing on agile, high-tech solutions. In contrast, DXC Technology emphasizes large-scale IT infrastructure and outsourcing services. This analysis pits a growth-oriented disruptor against a value-driven incumbent to identify which offers superior risk-adjusted returns for a diversified portfolio.
Table of contents
Companies Overview
Globant S.A. and DXC Technology Company stand as influential players in the global information technology services sector.
Globant S.A.: Digital Reinvention Pioneer
Globant S.A. excels as a technology services company with a diverse portfolio spanning e-commerce, cloud transformation, and AI-driven solutions. Its core revenue comes from delivering digital innovation and consulting through reinvention studios. In 2026, Globant focuses strategically on expanding its augmented revenue management and sustainable business solutions to capture evolving market demands.
DXC Technology Company: Enterprise IT Solutions Leader
DXC Technology Company operates as a broad IT services provider specializing in global business and infrastructure services. It generates revenue by helping enterprises accelerate digital transformation with analytics, cloud migration, and security solutions. The firm’s 2026 strategy centers on enhancing multi-cloud management and intelligent workplace services to support mission-critical systems for large organizations.
Strategic Collision: Similarities & Divergences
Both companies emphasize digital transformation but diverge in approach—Globant champions agile innovation and product reinvention, while DXC prioritizes stable legacy system modernization and infrastructure management. Their primary battleground lies in enterprise digital services, particularly cloud adoption and automation. Investors face distinct profiles: Globant drives growth through cutting-edge solutions, whereas DXC offers resilience via comprehensive IT outsourcing.
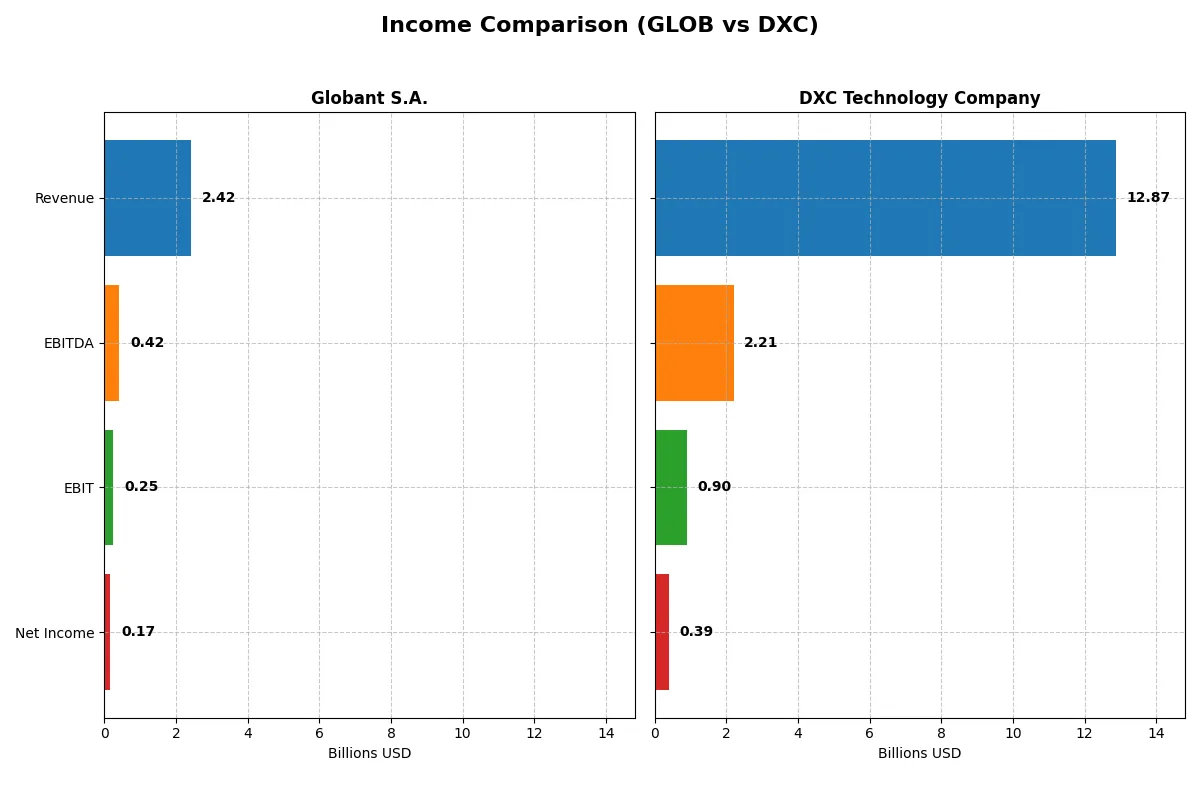
Income Statement Comparison
This data dissects the core profitability and scalability of both corporate engines to reveal who dominates the bottom line:
| Metric | Globant S.A. (GLOB) | DXC Technology Company (DXC) |
|---|---|---|
| Revenue | 2.42B | 12.87B |
| Cost of Revenue | 1.55B | 9.77B |
| Operating Expenses | 638M | 2.40B |
| Gross Profit | 863M | 3.10B |
| EBITDA | 417M | 2.21B |
| EBIT | 254M | 895M |
| Interest Expense | 29M | 265M |
| Net Income | 166M | 389M |
| EPS | 3.82 | 2.15 |
| Fiscal Year | 2024 | 2025 |
Income Statement Analysis: The Bottom-Line Duel
This income statement comparison reveals which company manages its resources most efficiently to convert sales into profit.
Globant S.A. Analysis
Globant’s revenue rose steadily from $814M in 2020 to $2.42B in 2024, with net income climbing from $54M to $166M. Its gross margin stays healthy at 35.7%, and net margin holds a favorable 6.9% in 2024. The company advances with strong momentum, growing EBIT by 16.6% year-over-year, signaling operational efficiency gains.
DXC Technology Company Analysis
DXC’s revenue shrank from $16.3B in 2021 to $12.9B in 2025, reflecting a challenging top-line environment. Net income recovered sharply to $389M in 2025 after a steep loss in 2023. Gross margin at 24.1% lags Globant, and net margin is a modest 3.0%. However, DXC’s EBIT surged 120% in the last year, showing improving cost control and profit recovery.
Growth Resilience vs. Turnaround Strength
Globant clearly outpaces DXC with sustained revenue and net income growth over five years and consistently stronger margins. DXC faces top-line pressure but exhibits a notable turnaround in profitability in 2025. For investors focused on growth and margin durability, Globant’s profile stands out as more attractive and reliable.
Financial Ratios Comparison
These vital ratios act as a diagnostic tool to expose the underlying fiscal health, valuation premiums, and capital efficiency of the companies compared below:
| Ratios | Globant S.A. (GLOB) | DXC Technology Company (DXC) |
|---|---|---|
| ROE | 8.44% | 12.05% |
| ROIC | 6.82% | 4.43% |
| P/E | 57.64 | 7.92 |
| P/B | 4.86 | 0.95 |
| Current Ratio | 1.54 | 1.22 |
| Quick Ratio | 1.54 | 1.22 |
| D/E (Debt-to-Equity) | 0.21 | 1.41 |
| Debt-to-Assets | 13.0% | 34.4% |
| Interest Coverage | 7.87 | 2.63 |
| Asset Turnover | 0.76 | 0.97 |
| Fixed Asset Turnover | 8.70 | 6.82 |
| Payout Ratio | 0 | 0 |
| Dividend Yield | 0% | 0% |
| Fiscal Year | 2024 | 2025 |
Efficiency & Valuation Duel: The Vital Signs
Financial ratios act as a company’s DNA, exposing hidden risks and operational strengths that numbers alone cannot reveal.
Globant S.A.
Globant shows moderate profitability with an 8.44% ROE flagged as unfavorable, despite a neutral net margin of 6.86%. Its valuation appears stretched, with a high P/E of 57.64 and P/B of 4.86. The company retains earnings for growth, offering no dividend, and maintains a strong liquidity profile with a current ratio of 1.54.
DXC Technology Company
DXC delivers a healthier ROE at 12.05%, considered neutral, but posts a low net margin of 3.02%. It trades at a bargain with a P/E of 7.92 and P/B below 1, signaling undervaluation. Despite higher leverage, DXC shows prudent capital allocation with no dividends and maintains a quick ratio of 1.22, indicating reasonable short-term liquidity.
Valuation Stretch vs. Undervalued Efficiency
Globant’s premium valuation contrasts with DXC’s value pricing and stronger ROE. While Globant struggles with stretched multiples, DXC balances risk with attractive valuation and operational efficiency. Growth-focused investors may favor Globant’s reinvestment, whereas value seekers might align better with DXC’s conservative financial profile.
Which one offers the Superior Shareholder Reward?
Globant S.A. (GLOB) and DXC Technology Company (DXC) both avoid dividends, focusing on reinvestment and buybacks. Globant’s free cash flow per share stands at 4.96 in 2024, fueling steady growth and moderate buybacks. DXC’s free cash flow per share is 4.55, paired with aggressive debt leverage (debt-to-equity 1.41) and a low P/E near 8, suggesting value but higher risk. Globant’s zero payout ratio and strong operating margins (10.5% EBIT) reflect sustainable reinvestment, while DXC’s weaker margin (5.5% EBIT) and high leverage constrain flexibility. I see Globant’s capital allocation as more prudent for long-term value. Thus, Globant offers a superior total return profile for 2026 investors seeking balanced growth and risk.
Comparative Score Analysis: The Strategic Profile
The radar chart reveals the fundamental DNA and trade-offs of Globant S.A. and DXC Technology Company, highlighting their financial strengths and valuation nuances:
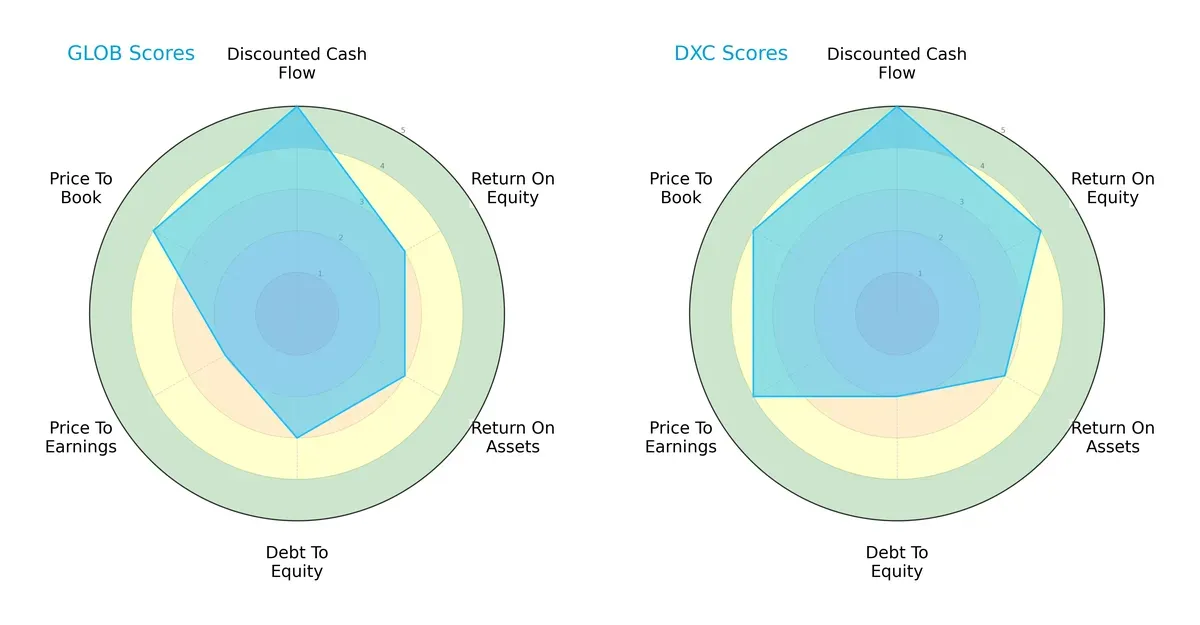
Globant shows a balanced profile with very favorable discounted cash flow and favorable price-to-book scores but moderate returns on equity and assets. DXC leans on a stronger return on equity and price-to-earnings scores but carries higher leverage risk with a weaker debt-to-equity score. I see Globant as more evenly poised, while DXC relies on operational efficiency and valuation appeal.
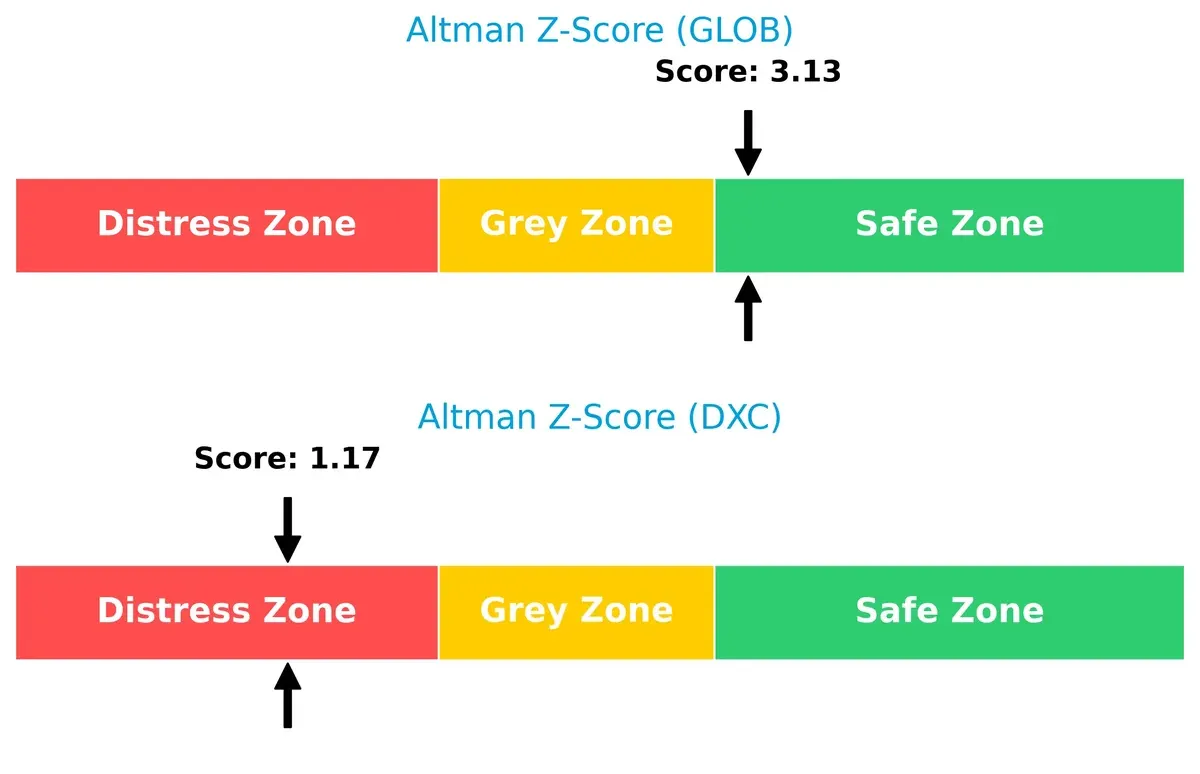
Bankruptcy Risk: Solvency Showdown
The Altman Z-Score gap highlights Globant’s solid solvency standing in the safe zone versus DXC’s distress zone, signaling divergent long-term survival prospects in this cycle:
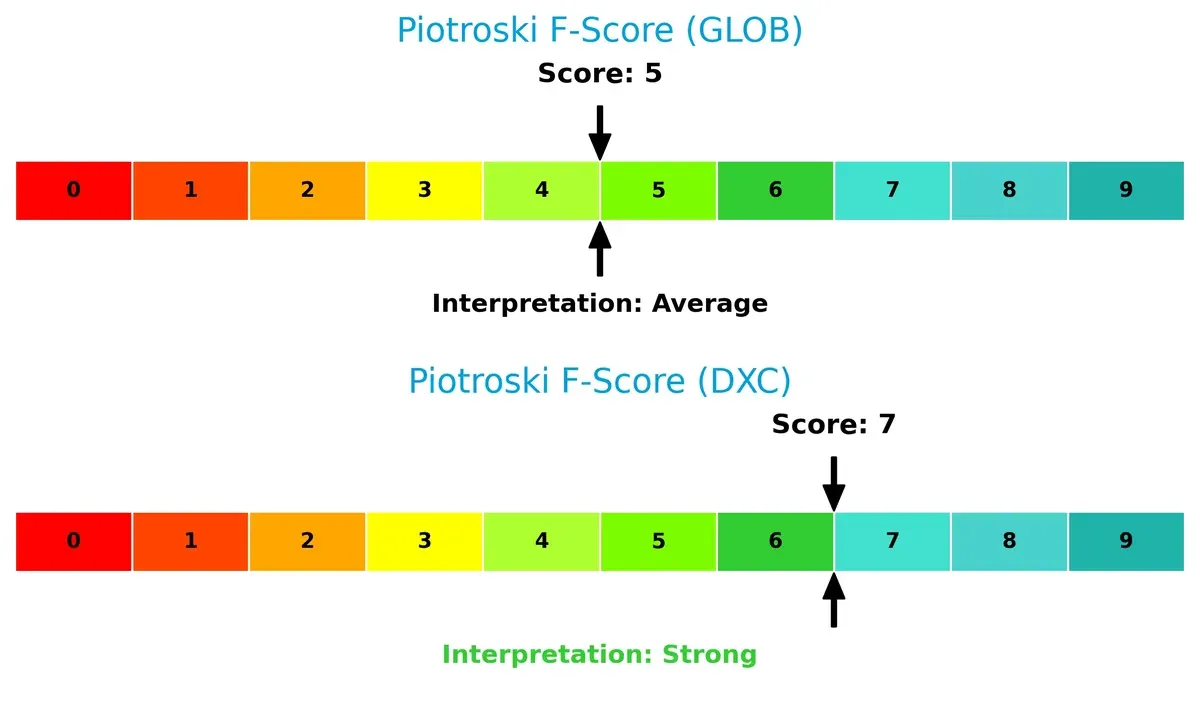
Financial Health: Quality of Operations
DXC’s Piotroski F-Score of 7 indicates stronger internal financial health than Globant’s average score of 5, suggesting DXC’s operations and fundamentals are more robust, while Globant shows some red flags worth monitoring:
How are the two companies positioned?
This section dissects the operational DNA of Globant and DXC by comparing their revenue distribution and internal dynamics. The goal is to confront their economic moats and identify which model offers the most resilient competitive advantage today.
Strengths and Weaknesses Comparison
This table compares the Strengths and Weaknesses of Globant S.A. and DXC Technology Company:
Globant Strengths
- Favorable liquidity ratios with current and quick ratios at 1.54
- Low leverage with debt-to-assets at 12.95%
- Strong fixed asset turnover at 8.7
- Slightly favorable global ratio opinion
DXC Strengths
- Favorable valuation metrics with P/E of 7.92 and P/B of 0.95
- WACC at 5.69% supports capital efficiency
- Favorable quick ratio and fixed asset turnover
- Slightly favorable global ratio opinion
Globant Weaknesses
- Unfavorable ROE at 8.44% below WACC of 8.98%
- High P/E and P/B ratios indicating overvaluation
- Zero dividend yield may deter income investors
- Moderate net margin at 6.86% neutral status
DXC Weaknesses
- Unfavorable net margin at 3.02% and ROIC at 4.43% below WACC
- High debt-to-equity at 1.41 signals higher financial risk
- Neutral interest coverage ratio at 3.38 poses risk in downturns
- Zero dividend yield limits shareholder returns
Globant’s strengths lie in solid liquidity and low leverage, but its valuation metrics raise caution. DXC offers attractive valuation and capital cost advantages but faces profitability and leverage challenges. Both companies show slightly favorable overall financial health with distinct strategic profiles.
The Moat Duel: Analyzing Competitive Defensibility
A structural moat is the only true shield protecting long-term profits from relentless competition erosion. Let’s examine how Globant and DXC defend their turf:
Globant S.A.: Innovation-Driven Intangible Assets
Globant’s moat centers on intangible assets like proprietary platforms and digital reinvention studios. This drives stable 10.5% EBIT margins despite fierce tech competition. Expansion into precision medicine and cloud services could deepen its moat in 2026.
DXC Technology Company: Scale-Enabled Cost Advantage
DXC leans on scale and global infrastructure services, enabling cost efficiencies absent in Globant’s model. However, its EBIT margin is a weaker 7%, with declining ROIC signaling margin pressure. DXC’s pivot to multi-cloud management offers some growth potential but risks remain.
Verdict: Intangible Assets vs. Scale Efficiency
Globant’s innovation-led intangible assets create a deeper moat than DXC’s scale-based cost advantage. Despite value destruction signs, Globant’s rising ROIC suggests stronger competitive resilience. I see Globant better positioned to defend market share in 2026.
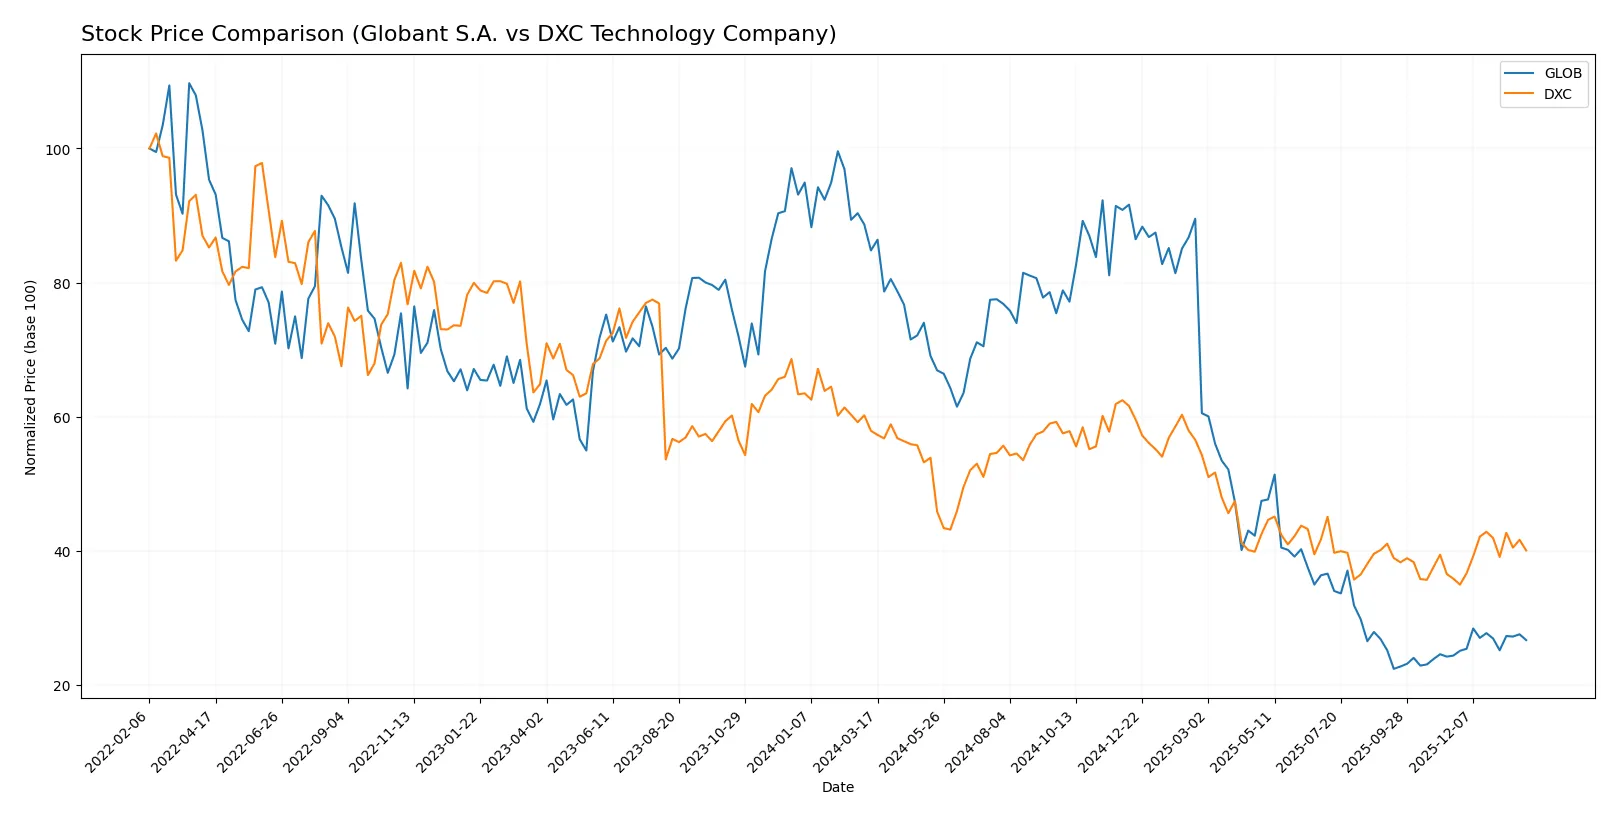
Which stock offers better returns?
The stock prices of Globant S.A. and DXC Technology Company reveal contrasting long-term declines followed by recent upward movements, highlighting shifts in trading dynamics over the past year.
Trend Comparison
Globant S.A. shows a steep bearish trend over the past 12 months with a -68.54% price drop and accelerating decline, despite recent recovery of +9.51% since November 2025. Volatility is high with a 61.32 standard deviation.
DXC Technology Company also follows a bearish path with a -30.82% loss and accelerating downturn over the year, but recent gains of +11.77% indicate improving momentum. Volatility remains low at 3.0 standard deviation.
Comparing both, DXC outperformed Globant in total returns despite both stocks showing bearish trends overall; DXC’s smaller loss and stronger recent rebound reflect better market performance.
Target Prices
Analysts show a moderately bullish consensus on both Globant S.A. and DXC Technology Company.
| Company | Target Low | Target High | Consensus |
|---|---|---|---|
| Globant S.A. | 68 | 80 | 73.75 |
| DXC Technology Company | 13 | 14 | 13.5 |
Globant’s target consensus exceeds its current price of 66.88, signaling room for appreciation. DXC’s target consensus sits slightly below its current price of 14.43, indicating limited upside or a cautious outlook.
How do institutions grade them?
The following tables summarize recent institutional grades for Globant S.A. and DXC Technology Company:
Globant S.A. Grades
This table shows the latest grades from reputable financial institutions for Globant S.A.:
| Grading Company | Action | New Grade | Date |
|---|---|---|---|
| Wells Fargo | Maintain | Equal Weight | 2026-01-14 |
| Jefferies | Downgrade | Hold | 2025-11-20 |
| UBS | Maintain | Neutral | 2025-11-18 |
| Needham | Maintain | Buy | 2025-11-14 |
| Canaccord Genuity | Maintain | Hold | 2025-11-14 |
| JP Morgan | Maintain | Neutral | 2025-11-14 |
| Goldman Sachs | Maintain | Neutral | 2025-10-09 |
| UBS | Maintain | Neutral | 2025-08-20 |
| Goldman Sachs | Maintain | Neutral | 2025-08-18 |
| Needham | Maintain | Buy | 2025-08-15 |
DXC Technology Company Grades
This table presents recent institutional grades for DXC Technology Company:
| Grading Company | Action | New Grade | Date |
|---|---|---|---|
| Stifel | Maintain | Hold | 2025-10-31 |
| JP Morgan | Maintain | Underweight | 2025-08-20 |
| Morgan Stanley | Maintain | Equal Weight | 2025-08-01 |
| RBC Capital | Maintain | Sector Perform | 2025-08-01 |
| JP Morgan | Maintain | Underweight | 2025-05-21 |
| RBC Capital | Maintain | Sector Perform | 2025-05-15 |
| BMO Capital | Maintain | Market Perform | 2025-05-15 |
| Morgan Stanley | Maintain | Equal Weight | 2025-05-15 |
| Guggenheim | Maintain | Neutral | 2025-05-12 |
| Susquehanna | Maintain | Neutral | 2025-04-23 |
Which company has the best grades?
Globant S.A. has generally stronger grades, including multiple “Buy” ratings, compared to DXC’s consistent “Hold” or lower grades. This could imply a relatively more favorable outlook for Globant among analysts, potentially attracting more investor interest.

Don’t Let Luck Decide Your Entry Point
Optimize your entry points with our advanced ProRealTime indicators. You’ll get efficient buy signals with precise price targets for maximum performance. Start outperforming now!
Risks specific to each company
The following categories identify the critical pressure points and systemic threats facing both firms in the 2026 market environment:
1. Market & Competition
Globant S.A.
- Faces intense competition in digital transformation and tech services, with high P/E indicating growth premium risk.
DXC Technology Company
- Competes in legacy IT and cloud transformation, with lower P/E signaling value but pressure from modern disruptors.
2. Capital Structure & Debt
Globant S.A.
- Maintains a conservative debt-to-equity ratio of 0.21, signaling financial prudence and flexibility.
DXC Technology Company
- Higher debt-to-equity at 1.41 elevates financial risk and interest burden, limiting maneuverability.
3. Stock Volatility
Globant S.A.
- Beta at 1.204 suggests above-market volatility, reflecting growth sector sensitivity.
DXC Technology Company
- Beta of 1.045 indicates moderate volatility, more stable but less growth-driven.
4. Regulatory & Legal
Globant S.A.
- Operating globally, faces regulatory complexity across multiple jurisdictions, including EU data laws.
DXC Technology Company
- Exposure mainly in US and allied markets, with risks tied to government contracting and compliance.
5. Supply Chain & Operations
Globant S.A.
- Relies on talent and digital infrastructure; operational risks tied to innovation pace and talent retention.
DXC Technology Company
- Faces risks in legacy system integration and multi-cloud management complexity.
6. ESG & Climate Transition
Globant S.A.
- Growing focus on sustainable business solutions, but ESG metrics remain evolving with regulatory pressure.
DXC Technology Company
- Increasing ESG demands in US market; transition risks in IT asset lifecycle and energy usage.
7. Geopolitical Exposure
Globant S.A.
- Headquartered in Luxembourg, faces EU regulatory and geopolitical shifts, plus global client exposure.
DXC Technology Company
- US-based, sensitive to trade policies, geopolitical tensions affecting cross-border IT services.
Which company shows a better risk-adjusted profile?
Globant’s strongest risk lies in market valuation and volatility, reflecting its growth premium and competitive pressures. DXC’s critical risk is its elevated leverage, increasing financial vulnerability. Despite this, DXC’s lower valuation multiples and strong Piotroski score suggest better risk-adjusted value. Notably, Globant’s Altman Z-Score in the safe zone contrasts with DXC’s distress zone, highlighting financial stability concerns at DXC. I view DXC as presenting a more balanced risk profile for value-oriented investors, while Globant offers growth with higher risk.
Final Verdict: Which stock to choose?
Globant’s superpower lies in its rapid revenue growth and improving profitability, driven by a scalable digital services model. Its main point of vigilance is the high valuation premium, which demands sustained execution to justify. It suits portfolios targeting aggressive growth with a tolerance for elevated risk.
DXC Technology’s strategic moat is its strong free cash flow generation at a low valuation, providing a margin of safety. Despite higher debt levels, it offers better stability relative to Globant’s volatility. This makes it more fitting for value-conscious investors seeking growth at a reasonable price.
If you prioritize growth with potential for outsized returns, Globant’s accelerating profitability and innovation edge outshine DXC. However, if you seek better cash flow stability and a more attractive valuation, DXC offers a safer, more measured investment scenario. Both carry risks, so matching your risk tolerance to these profiles is key.
Disclaimer: Investment carries a risk of loss of initial capital. The past performance is not a reliable indicator of future results. Be sure to understand risks before making an investment decision.
Go Further
I encourage you to read the complete analyses of Globant S.A. and DXC Technology Company to enhance your investment decisions: