Home > Comparison > Technology > IT vs DXC
The strategic rivalry between Gartner, Inc. and DXC Technology Company shapes the evolution of the technology services sector. Gartner operates as a research-driven advisory firm with subscription and consulting revenue streams. DXC, by contrast, is a large-scale IT services provider focused on infrastructure and business process outsourcing. This analysis evaluates their differing models to identify which offers superior risk-adjusted potential for a diversified portfolio in a competitive market environment.
Table of contents
Companies Overview
Gartner, Inc. and DXC Technology Company hold pivotal roles in the global information technology services sector.
Gartner, Inc.: Market Leader in IT Research and Advisory
Gartner, Inc. dominates as a research and advisory powerhouse. Its primary revenue stems from subscription-based research services, conferences, and consulting. In 2026, Gartner sharpens its focus on delivering actionable IT solutions, emphasizing digital transformation and cost optimization for enterprise clients worldwide.
DXC Technology Company: Comprehensive IT Services Provider
DXC Technology Company positions itself as a full-service IT solutions provider. It generates revenue through Global Business Services and Global Infrastructure Services, helping clients automate operations, migrate to cloud, and secure IT environments. DXC’s 2026 strategy prioritizes accelerating clients’ digital transformation while reducing operational risks and total cost of ownership.
Strategic Collision: Similarities & Divergences
Both companies thrive in the IT services landscape but differ fundamentally. Gartner relies on a subscription-based advisory model, while DXC offers hands-on infrastructure and application services. Their main battleground is enterprise digital transformation. Gartner excels in strategic insight; DXC competes on execution and operational scale. These distinctions define unique risk profiles and growth trajectories for investors.
Income Statement Comparison
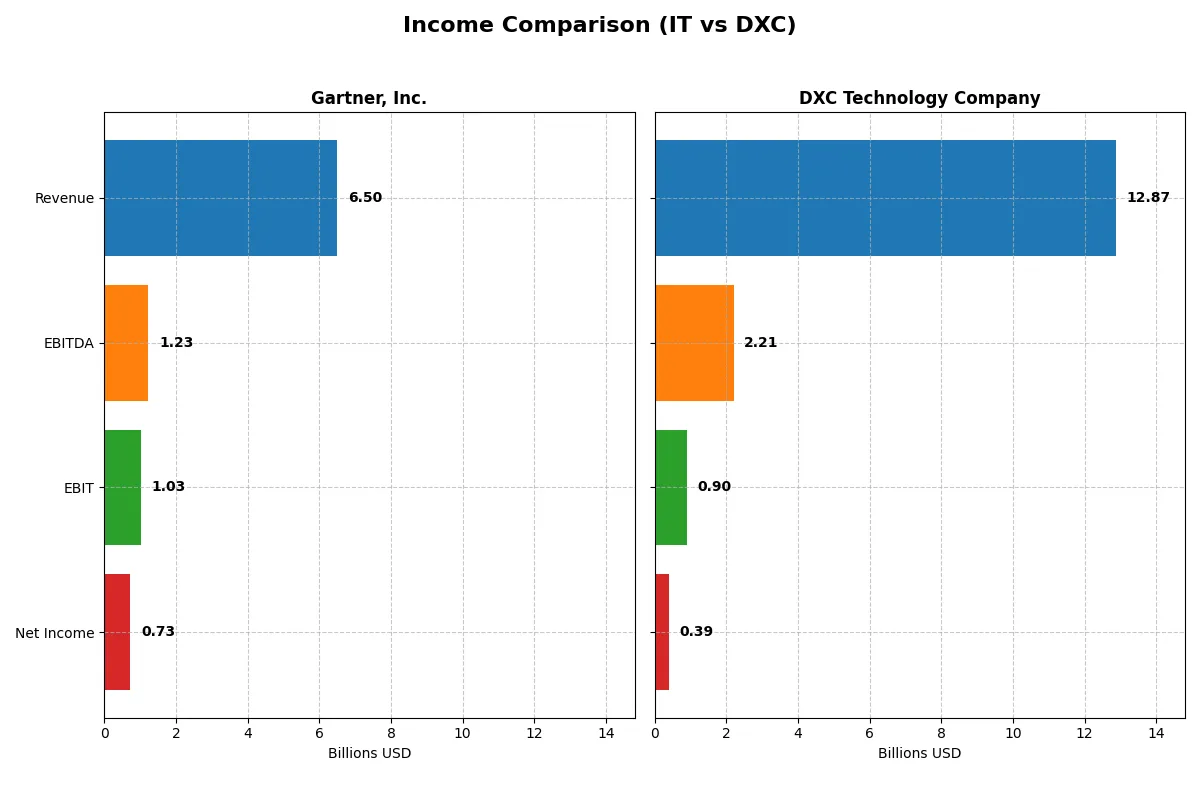
The following data dissects the core profitability and scalability of both corporate engines to reveal who dominates the bottom line:
| Metric | Gartner, Inc. (IT) | DXC Technology Company (DXC) |
|---|---|---|
| Revenue | 6.5B | 12.9B |
| Cost of Revenue | 2.1B | 9.8B |
| Operating Expenses | 3.4B | 2.4B |
| Gross Profit | 4.4B | 3.1B |
| EBITDA | 1.2B | 2.2B |
| EBIT | 1.0B | 895M |
| Interest Expense | 61M | 265M |
| Net Income | 729M | 389M |
| EPS | 9.68 | 2.15 |
| Fiscal Year | 2025 | 2025 |
Income Statement Analysis: The Bottom-Line Duel
This income statement comparison will uncover which company runs a more efficient and profitable business engine in the evolving tech landscape.
Gartner, Inc. Analysis
Gartner’s revenue grew steadily from $4.7B in 2021 to $6.5B in 2025, a 37% increase over five years. Net income fluctuated, peaking at $1.25B in 2024 before retreating to $729M in 2025. Its gross margin remains robust at 67.7%, but net margin contracted sharply to 11.2% in 2025, reflecting rising operating expenses and lower EBIT, signaling margin pressure despite solid revenue growth.
DXC Technology Company Analysis
DXC’s revenue declined from $16.3B in 2021 to $12.9B in 2025, down 21% overall. Net income swung from a $568M loss in 2023 to a positive $389M in 2025, showing a volatile recovery. Gross margin is tight at 24.1%, and net margin stands at 3%. However, DXC’s EBIT and net margin surged over 2024-2025, indicating improving operational control and profit momentum despite lower sales.
Margin Strength vs. Revenue Resilience
Gartner dominates in margin quality and revenue scale but faces deteriorating profitability and margin compression recently. DXC struggles with shrinking sales but posts marked earnings recovery and margin expansion in the latest year. For investors, Gartner appeals with stable top-line growth and superior margins; DXC offers a turnaround story with improving profitability but higher risk.
Financial Ratios Comparison
These vital ratios act as a diagnostic tool to expose the underlying fiscal health, valuation premiums, and capital efficiency of each company analyzed below:
| Ratios | Gartner, Inc. (IT) | DXC Technology Company (DXC) |
|---|---|---|
| ROE | 0.92 | 0.12 |
| ROIC | 0.22 | 0.04 |
| P/E | 30.06 | 7.92 |
| P/B | 27.73 | 0.95 |
| Current Ratio | 1.06 | 1.22 |
| Quick Ratio | 1.06 | 1.22 |
| D/E | 2.13 | 1.41 |
| Debt-to-Assets | 0.34 | 0.34 |
| Interest Coverage | 8.82 | 2.63 |
| Asset Turnover | 0.73 | 0.97 |
| Fixed Asset Turnover | 12.53 | 6.82 |
| Payout ratio | 0 | 0 |
| Dividend yield | 0 | 0 |
| Fiscal Year | 2025 | 2025 |
Efficiency & Valuation Duel: The Vital Signs
Financial ratios act as a company’s DNA, revealing hidden risks and operational excellence that shape investor confidence and portfolio outcomes.
Gartner, Inc.
Gartner shows a solid net margin at 11.22%, signaling good profitability despite ROE and ROIC being unfavorable at zero. Its P/E ratio of 24.91 suggests a neutral valuation, neither cheap nor stretched. The company retains earnings for growth, with no dividend yield, emphasizing reinvestment over shareholder payouts.
DXC Technology Company
DXC posts a modest net margin of 3.02% and a neutral ROE of 12.05%, reflecting cautious profitability. Its low P/E of 7.92 underlines an attractive valuation, while a current ratio of 1.22 indicates reasonable liquidity. DXC’s absence of dividends aligns with a focus on operational improvement and capital efficiency.
Premium Valuation vs. Operational Safety
Gartner commands a premium valuation with better profitability but weak shareholder returns. DXC offers a more conservative valuation and balanced liquidity, though with lower margins. Investors seeking growth may lean toward Gartner; those favoring stability and value might find DXC’s profile more fitting.
Which one offers the Superior Shareholder Reward?
Gartner, Inc. (IT) and DXC Technology Company (DXC) both forego dividends, focusing on reinvestment or buybacks. Gartner shows no dividend yield or payout but maintains strong free cash flow with a high FCF/OCF ratio (~0.93) and no buyback data, signaling reinvestment in growth. DXC also pays no dividends recently but reports modest free cash flow with a lower FCF/OCF ratio (~0.59) and a history of limited buyback activity. Gartner’s high margins and sustained FCF coverage suggest more sustainable shareholder value creation. I conclude Gartner offers a superior total return profile in 2026 due to its robust cash flow and disciplined capital allocation.
Comparative Score Analysis: The Strategic Profile
The radar chart reveals the fundamental DNA and trade-offs of Gartner, Inc. and DXC Technology Company in key financial dimensions:
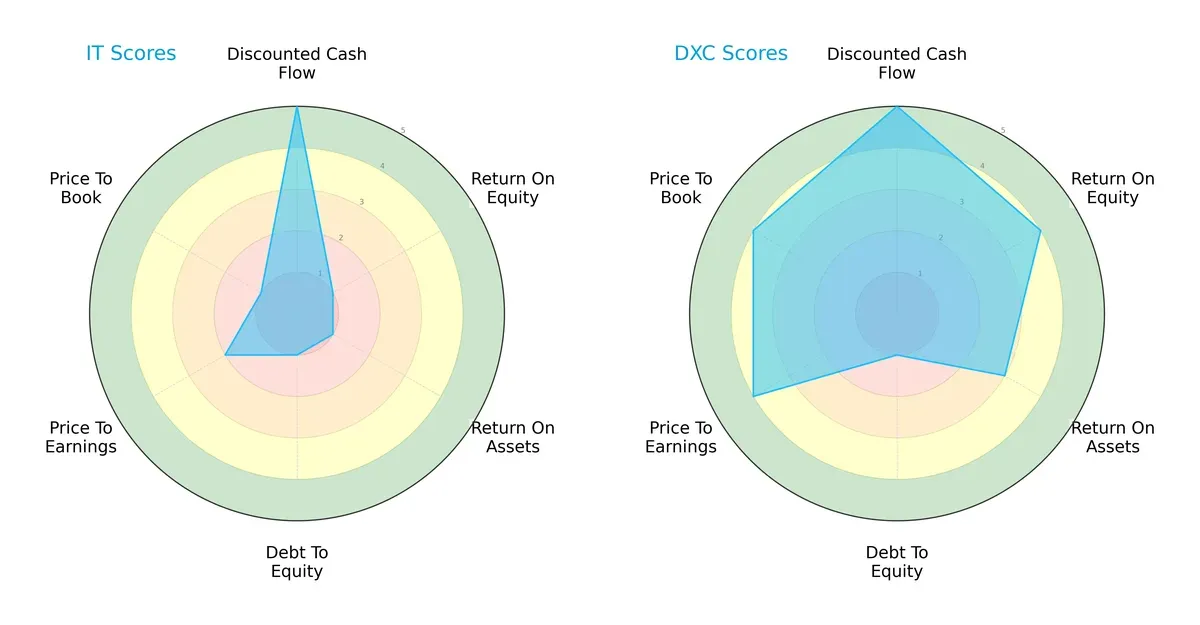
Gartner and DXC both score equally high in discounted cash flow (5), spotlighting strong future cash flow expectations. However, DXC dominates in return on equity (4 vs. 1) and return on assets (3 vs. 1), showing superior operational efficiency. Both firms share weak debt-to-equity scores (1), signaling elevated leverage risk. Valuation metrics favor DXC substantially (P/E: 4 vs. 2, P/B: 4 vs. 1), suggesting Gartner may be undervalued or facing market skepticism. DXC offers a more balanced profile, while Gartner leans heavily on its cash flow strength amid operational and leverage challenges.
Bankruptcy Risk: Solvency Showdown
The Altman Z-Score delta highlights a stark solvency contrast:
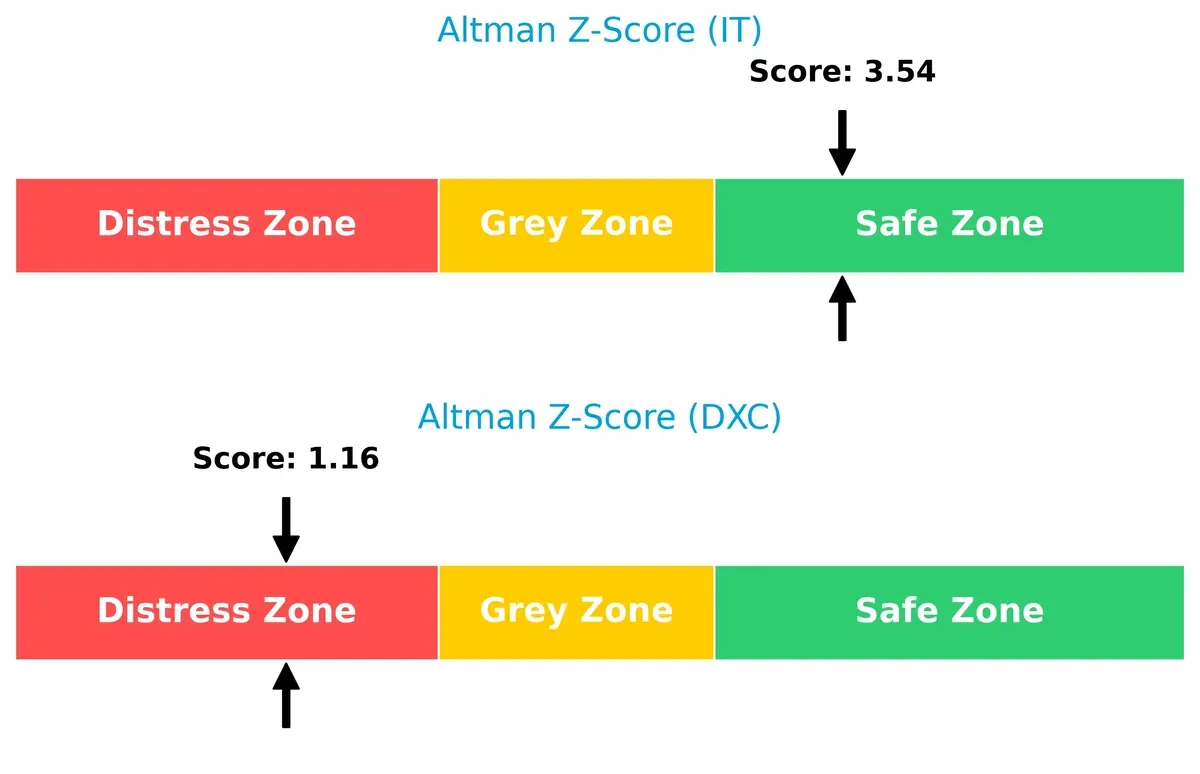
Gartner’s Z-Score of 3.54 places it firmly in the safe zone, indicating strong financial stability and low bankruptcy risk. Conversely, DXC’s 1.16 score falls in the distress zone, raising significant concerns about its long-term survival and vulnerability in cyclical downturns.
Financial Health: Quality of Operations
The Piotroski F-Score comparison exposes operational quality disparities:
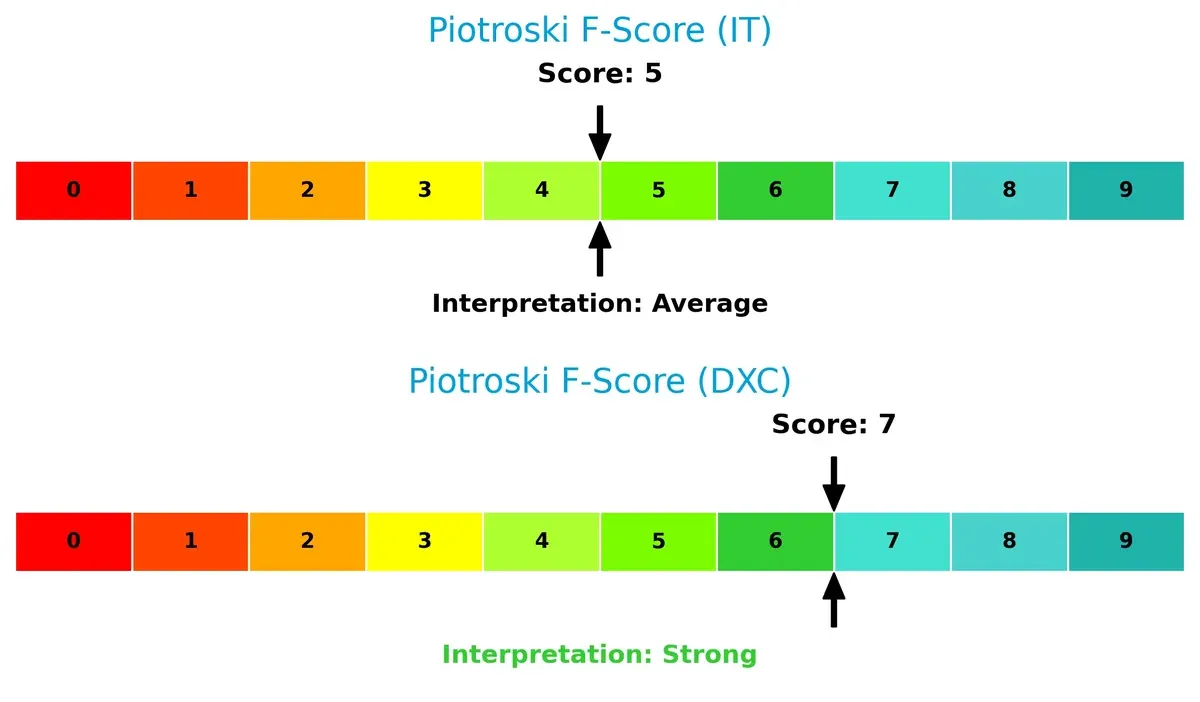
DXC scores a robust 7, signaling strong internal financial health and efficient capital allocation. Gartner’s 5 is average, hinting at potential red flags in profitability, liquidity, or leverage metrics. Investors should weigh DXC’s superior operational quality against its solvency risks prudently.
How are the two companies positioned?
This section dissects the operational DNA of Gartner and DXC by comparing their revenue distribution and internal dynamics. The goal is to confront their economic moats to reveal which model offers the most resilient competitive advantage today.
Revenue Segmentation: The Strategic Mix
The following comparison dissects how Gartner, Inc. and DXC Technology diversify their income streams and reveals their primary sector bets:
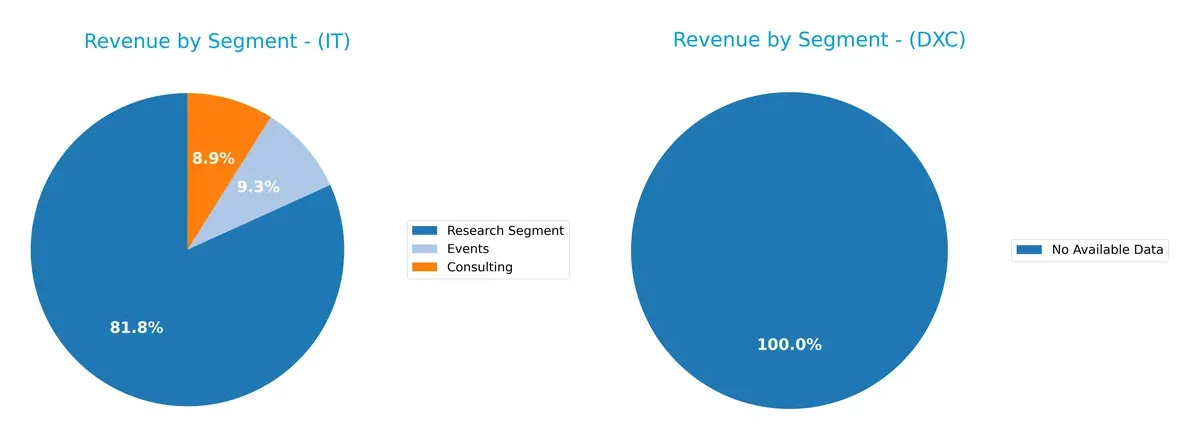
Gartner leans heavily on its Research Segment, generating $5.13B in 2024, dwarfing Consulting at $559M and Events at $583M. This concentration anchors its expertise-driven ecosystem, but poses concentration risk. DXC Technology lacks available segmentation data, preventing direct comparison. Gartner’s focused model leverages deep market insights, while DXC’s unknown mix leaves its strategic positioning unclear. Diversification remains a key differentiator in risk and growth potential.
Strengths and Weaknesses Comparison
This table compares the strengths and weaknesses of Gartner, Inc. and DXC Technology Company:
Gartner Strengths
- Diversified revenue streams across Consulting, Events, and Research segments
- Strong net margin at 11.22%
- Low debt-to-assets ratio and favorable interest coverage
- Solid market presence in US, Europe, and international regions
DXC Strengths
- Favorable WACC at 5.8% and attractive PE ratio of 7.92
- Strong quick ratio and fixed asset turnover
- Moderate ROE at 12.05% and neutral debt-to-assets ratio
- Balanced financial leverage with manageable debt levels
Gartner Weaknesses
- Unfavorable ROE and ROIC indicating weak capital efficiency
- Poor liquidity ratios with current and quick ratios at zero
- Low asset and fixed asset turnover ratios
- Zero dividend yield may deter income investors
DXC Weaknesses
- Low net margin at 3.02% signaling weak profitability
- Unfavorable ROIC and high debt-to-equity ratio at 1.41
- Neutral interest coverage suggests limited buffer for debt servicing
- No dividend yield limits shareholder income potential
Gartner excels in profitability and conservative leverage but struggles with capital efficiency and liquidity. DXC shows financial stability and asset efficiency yet faces profitability and debt concerns. Both companies exhibit distinct strategic strengths and risks shaping their operational outlook.
The Moat Duel: Analyzing Competitive Defensibility
A structural moat is the only reliable barrier protecting long-term profits from relentless competitive erosion in dynamic markets:
Gartner, Inc.: Intangible Asset Moat Rooted in Expertise and Data
Gartner’s moat stems from its deep research expertise and proprietary data assets, reflected in stable gross margins above 67%. Yet, recent EBIT and net margin declines hint at margin pressure. Expansion into consulting and conferences could deepen this moat if innovation accelerates.
DXC Technology Company: Cost and Scale Advantage Amid Operational Challenges
DXC’s moat relies on scale and cost efficiency in IT services, unlike Gartner’s intellectual capital focus. Despite a thinner 24% gross margin, DXC shows strong EBIT and net margin growth recently. Its broad service portfolio supports digital transformation, but revenue shrinkage raises caution.
Moat Battle: Intangible Expertise vs. Cost & Scale Efficiency
Gartner’s intangible asset moat is inherently deeper, supported by high margins and premium pricing power. DXC’s cost advantage is narrower and under pressure from declining revenues. I see Gartner better positioned to defend market share long term despite recent margin headwinds.
Which stock offers better returns?
Over the past year, both Gartner, Inc. and DXC Technology Company experienced significant price shifts, with Gartner showing steep declines and DXC revealing mixed momentum in recent months. Trading volumes diverged notably between the two.
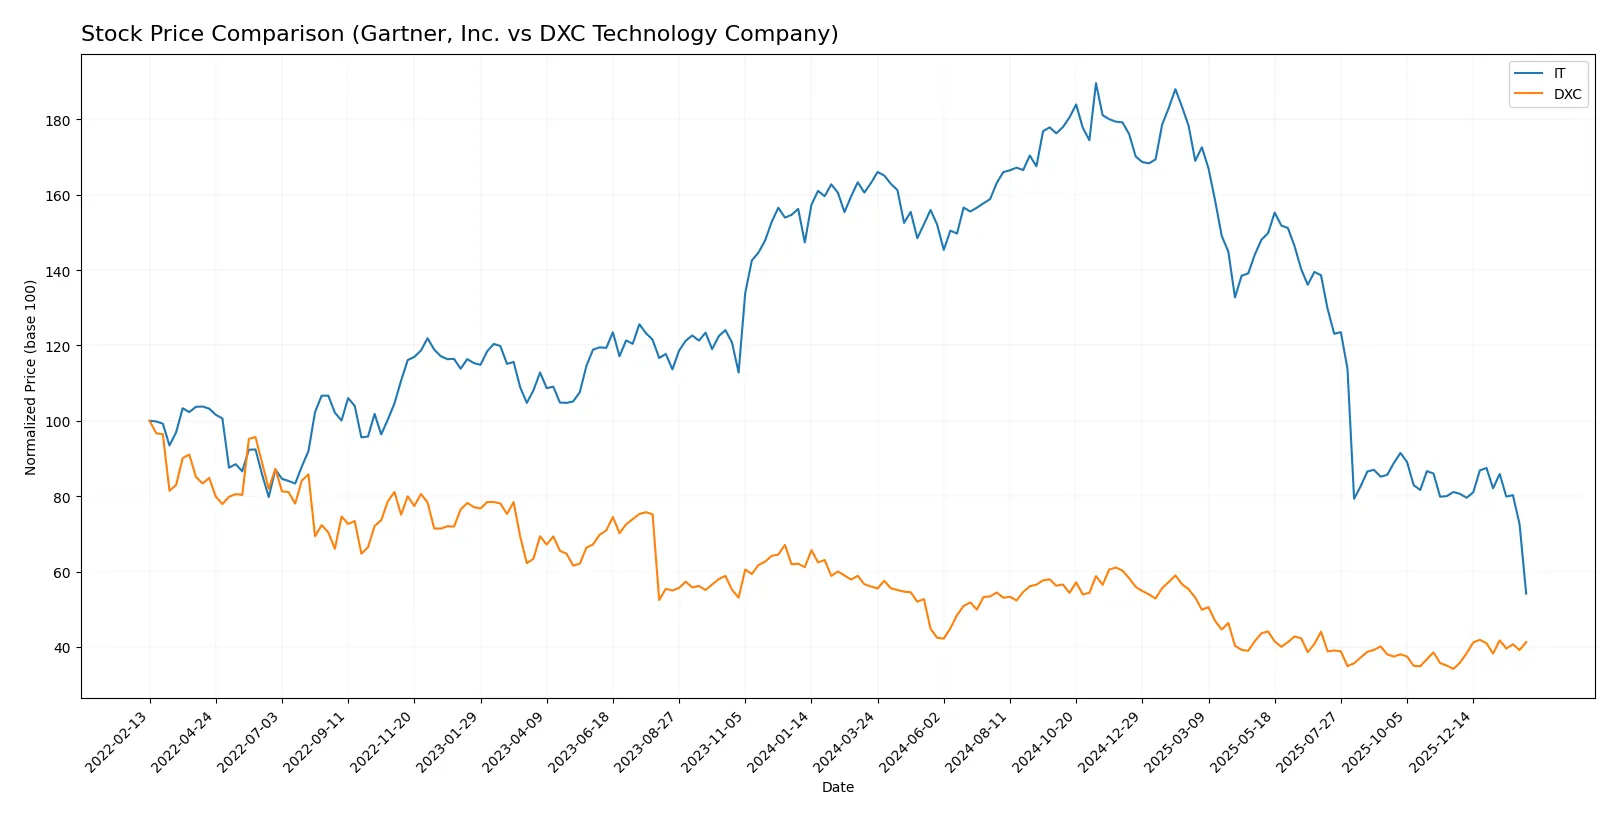
Trend Comparison
Gartner, Inc. stock declined 66.81% over the past year, marking a clear bearish trend with decelerating losses. Price volatility was high, ranging from 156.33 to 547.4, reflecting sharp fluctuations in market sentiment.
DXC Technology Company also followed a bearish trend with a 26.36% decline over one year, however, its recent 20.73% price increase signals accelerating positive momentum. Volatility remained low and stable compared to Gartner.
Comparing both, DXC delivered the highest market performance recently, reversing earlier losses, while Gartner sustained stronger overall declines and volatility throughout the year.
Target Prices
Analysts present a cautiously optimistic consensus for Gartner, Inc. and DXC Technology Company.
| Company | Target Low | Target High | Consensus |
|---|---|---|---|
| Gartner, Inc. | 170 | 275 | 206.3 |
| DXC Technology Company | 13 | 14 | 13.5 |
The consensus target for Gartner, Inc. at 206.3 suggests a 32% upside from its current price of 156.33. DXC’s target consensus of 13.5 implies a slight downside risk versus its current 15.2 price.

Don’t Let Luck Decide Your Entry Point
Optimize your entry points with our advanced ProRealTime indicators. You’ll get efficient buy signals with precise price targets for maximum performance. Start outperforming now!
How do institutions grade them?
Gartner, Inc. Grades
Below is the recent grading summary from reputable financial institutions.
| Grading Company | Action | New Grade | Date |
|---|---|---|---|
| Truist Securities | Maintain | Buy | 2026-02-06 |
| Barclays | Maintain | Equal Weight | 2026-02-05 |
| Morgan Stanley | Maintain | Equal Weight | 2026-02-04 |
| Wells Fargo | Maintain | Underweight | 2026-02-04 |
| UBS | Maintain | Neutral | 2026-01-09 |
| Morgan Stanley | Maintain | Equal Weight | 2025-12-17 |
| BMO Capital | Maintain | Market Perform | 2025-11-06 |
| Wells Fargo | Maintain | Underweight | 2025-11-05 |
| Barclays | Maintain | Equal Weight | 2025-11-05 |
| Goldman Sachs | Maintain | Buy | 2025-11-05 |
DXC Technology Company Grades
The table below lists recent grades from established grading firms.
| Grading Company | Action | New Grade | Date |
|---|---|---|---|
| BMO Capital | Maintain | Market Perform | 2026-02-03 |
| Stifel | Maintain | Hold | 2025-10-31 |
| JP Morgan | Maintain | Underweight | 2025-08-20 |
| Morgan Stanley | Maintain | Equal Weight | 2025-08-01 |
| RBC Capital | Maintain | Sector Perform | 2025-08-01 |
| JP Morgan | Maintain | Underweight | 2025-05-21 |
| RBC Capital | Maintain | Sector Perform | 2025-05-15 |
| BMO Capital | Maintain | Market Perform | 2025-05-15 |
| Morgan Stanley | Maintain | Equal Weight | 2025-05-15 |
| Guggenheim | Maintain | Neutral | 2025-05-12 |
Which company has the best grades?
Gartner, Inc. consistently earns Buy and Equal Weight grades, while DXC Technology mostly receives Market Perform and Underweight ratings. Gartner’s stronger grades suggest relatively higher institutional confidence, potentially affecting investor sentiment and valuation positively.
Risks specific to each company
The following categories identify critical pressure points and systemic threats facing Gartner, Inc. and DXC Technology Company in the 2026 market environment:
1. Market & Competition
Gartner, Inc.
- Operates globally with strong research and advisory moat but faces pressure from digital transformation competitors.
DXC Technology Company
- Provides broad IT services with scale advantages but intense competition in cloud and analytics sectors.
2. Capital Structure & Debt
Gartner, Inc.
- Debt metrics appear favorable; low leverage reduces financial risk.
DXC Technology Company
- High debt-to-equity ratio (1.41) signals elevated financial risk and potential refinancing challenges.
3. Stock Volatility
Gartner, Inc.
- Beta near 1.04 indicates market-level volatility; trading range wide but relatively stable volume.
DXC Technology Company
- Beta slightly higher at 1.08 suggests moderately higher volatility; recent price jump of 7.1% reflects potential market swings.
4. Regulatory & Legal
Gartner, Inc.
- Faces standard regulatory scrutiny typical for information services but no major known legal risks.
DXC Technology Company
- Operates across multiple jurisdictions with complex compliance needs, increasing regulatory risk exposure.
5. Supply Chain & Operations
Gartner, Inc.
- Relies on intellectual capital and digital delivery, minimizing traditional supply chain risks.
DXC Technology Company
- Heavy operational footprint with legacy system migrations increases supply chain and integration complexity.
6. ESG & Climate Transition
Gartner, Inc.
- ESG initiatives less capital-intensive, but reputation risk exists in tech advisory sector.
DXC Technology Company
- Larger environmental footprint due to infrastructure services; transition risks linked to energy efficiency mandates.
7. Geopolitical Exposure
Gartner, Inc.
- Global presence exposes it to geopolitical risks, but diversified markets mitigate localized shocks.
DXC Technology Company
- Significant exposure to North America, Europe, Asia, and Australia, increasing sensitivity to geopolitical tensions.
Which company shows a better risk-adjusted profile?
Gartner’s strongest risk lies in competitive innovation pressures, while DXC’s primary concern is its high leverage and operational complexity. I judge Gartner’s risk-adjusted profile as better due to lower financial risk and more stable operational model. DXC’s Altman Z-score in the distress zone and elevated debt raise caution despite strong operational scores.
Final Verdict: Which stock to choose?
Gartner, Inc. (IT) excels as a cash-generating powerhouse with solid income quality and a robust interest coverage ratio. Its superpower lies in delivering consistent profitability despite a challenging revenue growth environment. A point of vigilance is its declining ROIC trend, which could pressure long-term value creation. This name suits portfolios targeting aggressive growth with tolerance for operational headwinds.
DXC Technology Company (DXC) stands out with a strategic moat rooted in undervaluation and operational turnaround potential. Its attractive valuation multiples and improving earnings growth signal value creation despite weaker margins. Compared to Gartner, DXC offers better near-term stability for risk-conscious investors, fitting well in a GARP (Growth at a Reasonable Price) portfolio.
If you prioritize strong profitability and cash flow resilience, Gartner (IT) is the compelling choice due to its proven efficiency and income quality. However, if you seek value upside and improving fundamentals with more downside protection, DXC offers better stability and a favorable valuation profile. Each stock appeals to distinct investor profiles balancing growth and risk differently.
Disclaimer: Investment carries a risk of loss of initial capital. The past performance is not a reliable indicator of future results. Be sure to understand risks before making an investment decision.
Go Further
I encourage you to read the complete analyses of Gartner, Inc. and DXC Technology Company to enhance your investment decisions: