Home > Comparison > Technology > FISV vs DXC
The strategic rivalry between Fiserv, Inc. and DXC Technology Company shapes the competitive landscape of the technology sector. Fiserv excels as a payment and fintech services innovator, while DXC delivers comprehensive IT outsourcing and digital transformation solutions. This head-to-head contrasts a specialized fintech leader against a diversified IT services provider. This analysis aims to identify which company offers a superior risk-adjusted return for a diversified portfolio in the evolving technology industry.
Table of contents
Companies Overview
Fiserv and DXC Technology dominate distinct niches within the broad information technology services sector. Both firms leverage technology to streamline business operations but via markedly different value propositions.
Fiserv, Inc.: Payment and Financial Services Technology Leader
Fiserv stands as a global payment and financial services technology provider. Its revenue primarily stems from three segments: Acceptance, Fintech, and Payments, offering solutions from point-of-sale systems to digital banking and card transaction processing. In 2026, Fiserv sharpens its focus on omnichannel commerce and security, embedding cloud-based platforms like Clover to enhance merchant and financial institution client engagement.
DXC Technology Company: IT Services and Digital Transformation Specialist
DXC Technology operates as a provider of IT services and digital transformation solutions across multiple continents. Its revenue mixes Global Business Services—analytics, software engineering, and consulting—with Global Infrastructure Services focused on cloud migration and IT outsourcing. In 2026, DXC prioritizes accelerating secure application delivery and multi-cloud management to reduce clients’ operational risks and costs.
Strategic Collision: Similarities & Divergences
Fiserv and DXC share a commitment to technology-driven efficiency but diverge sharply in approach. Fiserv’s customer-centric, integrated payment ecosystem contrasts with DXC’s broader IT services focus on enterprise digital transformation and infrastructure. Their primary battleground lies in serving financial institutions—Fiserv via payments technology, DXC through IT modernization. Investors should note Fiserv’s specialized fintech moat against DXC’s diversified service portfolio and scale.
Income Statement Comparison
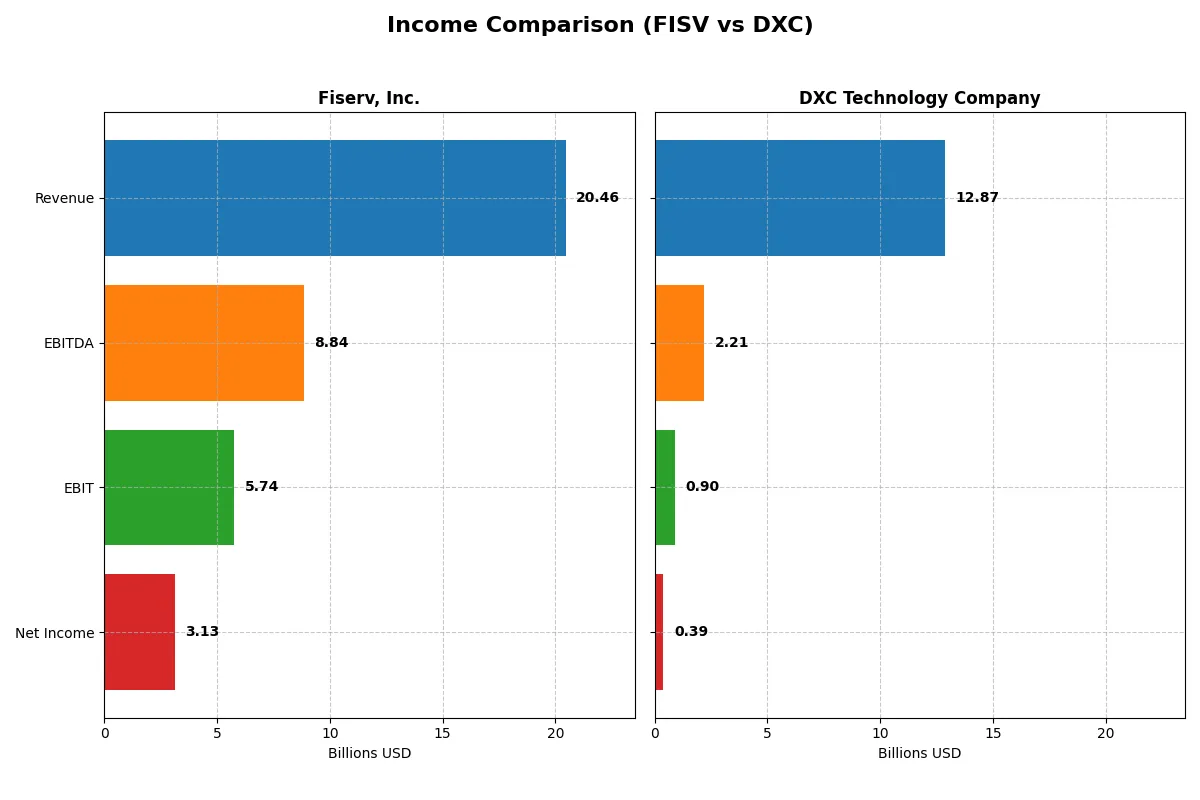
This data dissects the core profitability and scalability of both corporate engines to reveal who dominates the bottom line:
| Metric | Fiserv, Inc. (FISV) | DXC Technology Company (DXC) |
|---|---|---|
| Revenue | 20.46B | 12.87B |
| Cost of Revenue | 8.01B | 9.77B |
| Operating Expenses | 6.56B | 2.40B |
| Gross Profit | 12.44B | 3.10B |
| EBITDA | 8.84B | 2.21B |
| EBIT | 5.74B | 895M |
| Interest Expense | 1.24B | 265M |
| Net Income | 3.13B | 389M |
| EPS | 5.41 | 2.15 |
| Fiscal Year | 2024 | 2025 |
Income Statement Analysis: The Bottom-Line Duel
This income statement comparison reveals which company operates its business with greater efficiency and profit-generating power.
Fiserv, Inc. Analysis
Fiserv demonstrates strong revenue growth, rising from $14.9B in 2020 to $20.5B in 2024, with net income expanding from $958M to $3.13B. Its gross margin holds firm at 60.8%, reflecting excellent cost control. Despite a slight dip in net margin last year, overall momentum remains robust, driven by expanding EBIT and EPS growth.
DXC Technology Company Analysis
DXC faces declining revenue, down from $16.3B in 2021 to $12.9B in 2025, with a net income turnaround from a $568M loss in 2023 to $389M profit in 2025. Gross margins hover around 24%, much lower than Fiserv’s. EBIT margin is modest at 6.95%, but recent margin improvements and EPS growth signal cautious operational recovery.
Margin Strength vs. Revenue Resilience
Fiserv clearly leads with superior gross and net margins, delivering consistent revenue and profit growth over five years. DXC struggles with shrinking top-line and thinner margins but shows signs of profit stabilization recently. Investors seeking durable margin power and revenue resilience will find Fiserv’s profile more attractive.
Financial Ratios Comparison
These vital ratios act as a diagnostic tool to expose the underlying fiscal health, valuation premiums, and capital efficiency of the companies compared below:
| Ratios | Fiserv, Inc. (FISV) | DXC Technology Company (DXC) |
|---|---|---|
| ROE | 11.57% | 12.05% |
| ROIC | 8.70% | 4.43% |
| P/E | 38.0 | 7.92 |
| P/B | 4.39 | 0.95 |
| Current Ratio | 1.06 | 1.22 |
| Quick Ratio | 1.06 | 1.22 |
| D/E | 0.92 | 1.41 |
| Debt-to-Assets | 32.3% | 34.4% |
| Interest Coverage | 4.75 | 2.63 |
| Asset Turnover | 0.27 | 0.97 |
| Fixed Asset Turnover | 8.62 | 6.82 |
| Payout ratio | 0 | 0 |
| Dividend yield | 0 | 0 |
| Fiscal Year | 2024 | 2025 |
Efficiency & Valuation Duel: The Vital Signs
Ratios act as a company’s DNA, exposing hidden risks and operational excellence beyond surface-level financials.
Fiserv, Inc.
Fiserv posts a solid 11.6% ROE with a strong 15.3% net margin, reflecting efficient profitability. However, its P/E of 38 and P/B of 4.39 stretch valuation compared to industry norms. Fiserv offers no dividend, instead reinvesting earnings to sustain growth and maintain favorable WACC at 6.1%.
DXC Technology Company
DXC delivers a comparable 12.1% ROE but suffers from a low 3.0% net margin, signaling profitability challenges. Its valuation appears attractive with a P/E of 7.9 and P/B near 1, suggesting undervaluation. DXC lacks dividends, focusing on operational recovery and cash flow improvements amid moderate leverage concerns.
Valuation Stretch vs. Operational Recovery
Fiserv’s premium valuation contrasts with DXC’s value-driven profile. Fiserv shows steadier profitability but at a stretched price. DXC offers better valuation metrics but weaker margins, fitting investors favoring turnaround risk over growth stability.
Which one offers the Superior Shareholder Reward?
I compare Fiserv, Inc. (FISV) and DXC Technology Company (DXC) on their shareholder reward strategies. Neither pays dividends, so I focus on share buybacks and reinvestment. FISV boasts strong free cash flow (8.7/share) and reinvests in growth, maintaining a zero payout ratio. DXC’s free cash flow is lower (4.5/share) but it trades at a much cheaper valuation (P/FCF ~3.7 vs. FISV’s 23.5). Both show no dividends, but DXC’s modest buyback and heavy leverage raise sustainability concerns. FISV’s robust margins and capital allocation toward growth offer a more sustainable total return. I conclude FISV delivers superior shareholder reward through disciplined reinvestment and buybacks aligned with cash flow.
Comparative Score Analysis: The Strategic Profile
The radar chart reveals the fundamental DNA and trade-offs of Fiserv, Inc. and DXC Technology Company, highlighting their financial strengths and weaknesses side by side:
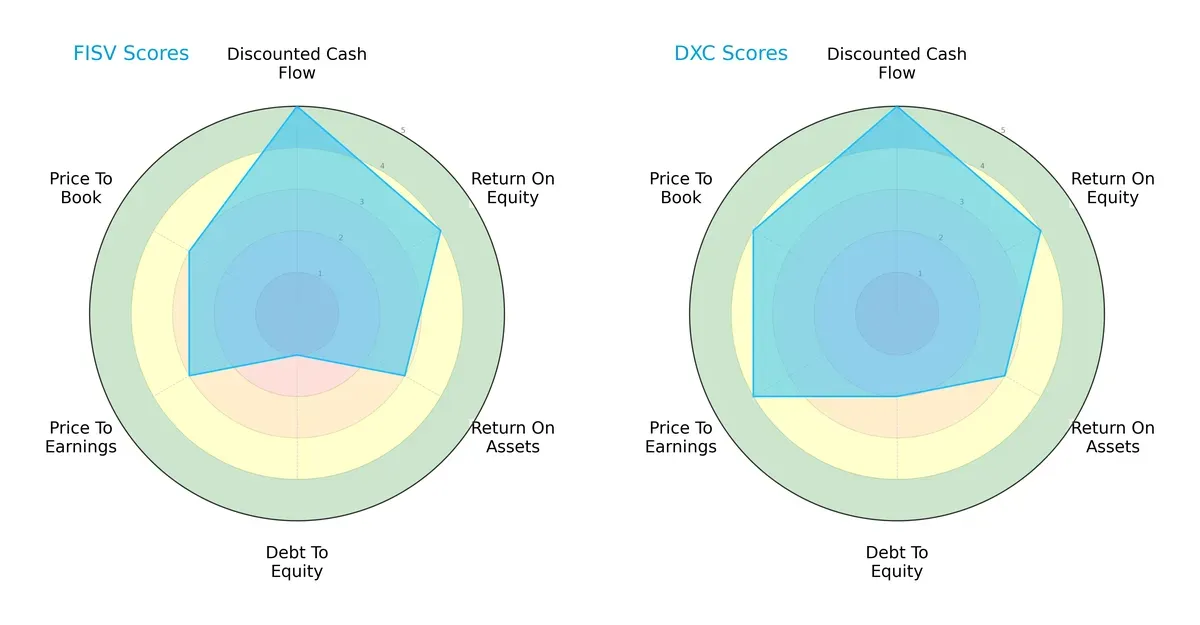
Fiserv and DXC both excel in Discounted Cash Flow with top scores of 5, reflecting strong valuation methodologies. Both share similar Return on Equity (4) and Return on Assets (3), indicating comparable operational efficiency. However, DXC’s Debt-to-Equity score of 2 surpasses Fiserv’s 1, signaling a more balanced capital structure and lower financial risk. DXC also holds an edge in valuation metrics with favorable Price-to-Earnings and Price-to-Book scores (4 each), while Fiserv lags moderately at 3. Overall, DXC maintains a more balanced profile, whereas Fiserv relies heavily on cash flow strength but carries higher leverage risk.
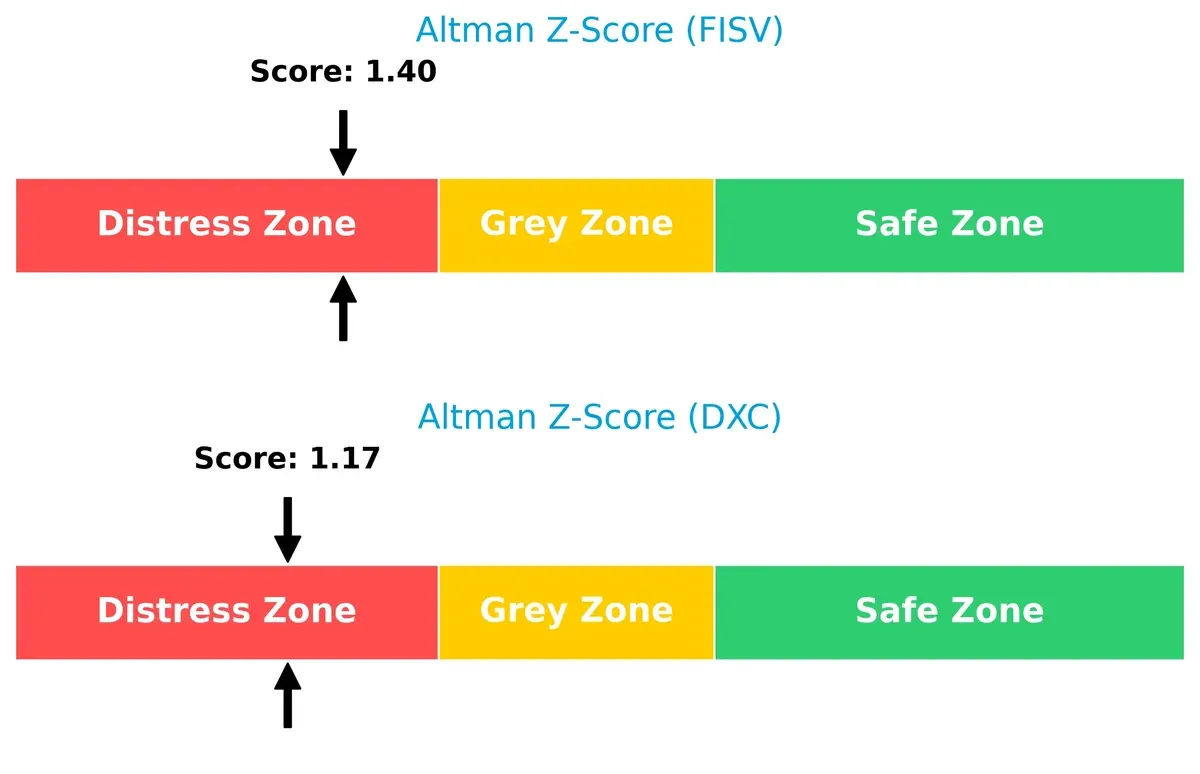
Bankruptcy Risk: Solvency Showdown
Fiserv’s Altman Z-Score of 1.40 slightly outperforms DXC’s 1.17, but both remain in the distress zone, signaling elevated bankruptcy risk in this economic cycle:
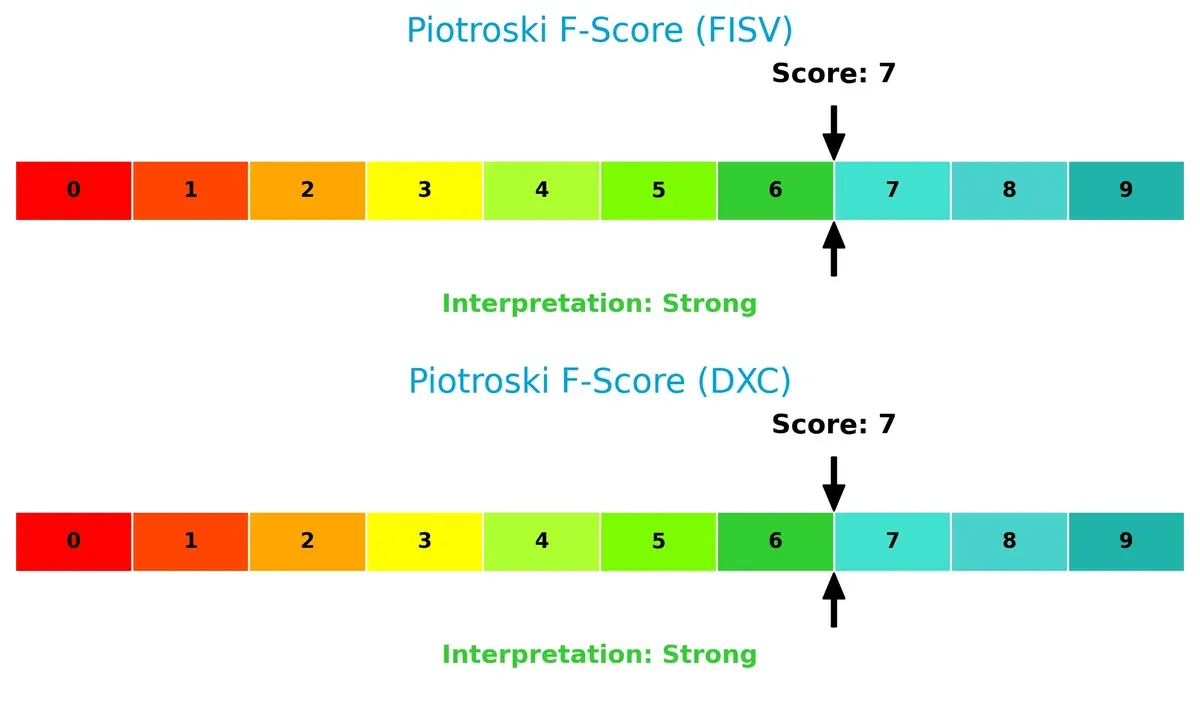
Financial Health: Quality of Operations
Both firms score a strong 7 on the Piotroski F-Score, reflecting solid internal financial health with no immediate red flags in profitability, leverage, or liquidity:
How are the two companies positioned?
This section dissects the operational DNA of FISV and DXC by comparing their revenue distribution and internal dynamics. The goal is to confront their economic moats and reveal which business model offers the most resilient competitive advantage today.
Revenue Segmentation: The Strategic Mix
This visual comparison dissects how Fiserv, Inc. and DXC Technology Company diversify their income streams and where their primary sector bets lie:
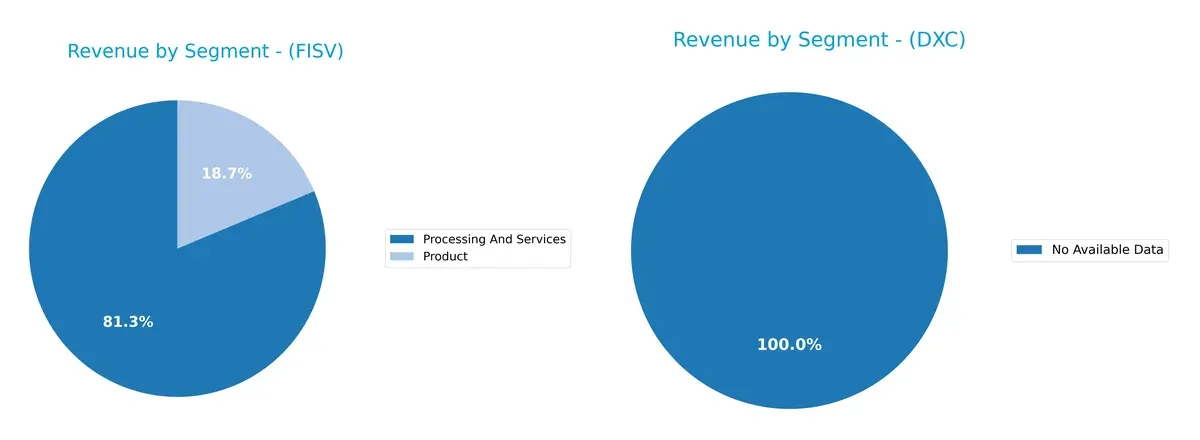
Fiserv, Inc. anchors its revenue heavily in Processing And Services with $16.6B in 2024, complemented by a smaller $3.8B Product segment. This concentration signals a strong infrastructure dominance and ecosystem lock-in in financial processing. DXC Technology lacks available data, preventing meaningful comparison. Fiserv’s focused mix suggests higher concentration risk but benefits from scale and specialization in core payments technology.
Strengths and Weaknesses Comparison
This table compares the Strengths and Weaknesses of Fiserv, Inc. and DXC Technology Company:
Fiserv Strengths
- Favorable net margin at 15.31%
- WACC lower than ROIC at 6.1%
- Quick ratio favorable at 1.06
- Strong fixed asset turnover at 8.62
- Diverse product and processing revenue streams
- Solid presence in U.S. and international markets
DXC Strengths
- Favorable WACC at 5.69%
- Low PE and PB ratios indicating undervaluation
- Favorable quick ratio at 1.22
- Neutral asset turnover at 0.97
- Favorable fixed asset turnover at 6.82
- Slightly favorable overall ratios
Fiserv Weaknesses
- Unfavorable high PE at 37.97 and PB at 4.39
- Asset turnover low at 0.27
- Zero dividend yield
- Neutral debt-to-equity and interest coverage ratios
DXC Weaknesses
- Low net margin at 3.02%
- Unfavorable low ROIC at 4.43%
- High debt-to-equity at 1.41
- Zero dividend yield
- Neutral interest coverage
Fiserv demonstrates strong profitability and operational efficiency but trades at high valuation multiples and has weak asset turnover. DXC shows potential undervaluation and solid capital structure risks, but profitability remains a concern. Both companies face zero dividend yields, which may impact income-focused investors.
The Moat Duel: Analyzing Competitive Defensibility
Structural moats protect long-term profits from competitive erosion. Only durable advantages withstand market disruptions and sustain value creation:
Fiserv, Inc.: Switching Costs Moat
Fiserv leverages high switching costs through integrated payment and fintech platforms. Its robust 28% EBIT margin and rising ROIC confirm a durable moat. Expansion into cloud-based services deepens its competitive edge in 2026.
DXC Technology Company: Operational Scale Moat
DXC relies on scale and service breadth but lacks Fiserv’s switching cost advantage. Its declining ROIC and thin 7% EBIT margin signal weakening moats. Digital transformation could stabilize DXC, yet competition remains fierce in 2026.
Switching Costs vs. Scale Efficiency
Fiserv’s growing ROIC and stable margins reveal a deeper moat than DXC’s shrinking returns. I see Fiserv better equipped to defend market share through sticky client relationships and scalable fintech innovation.
Which stock offers better returns?
Over the past 12 months, both stocks show significant price declines, with recent trading dynamics indicating shifts in momentum and buyer-seller dominance.
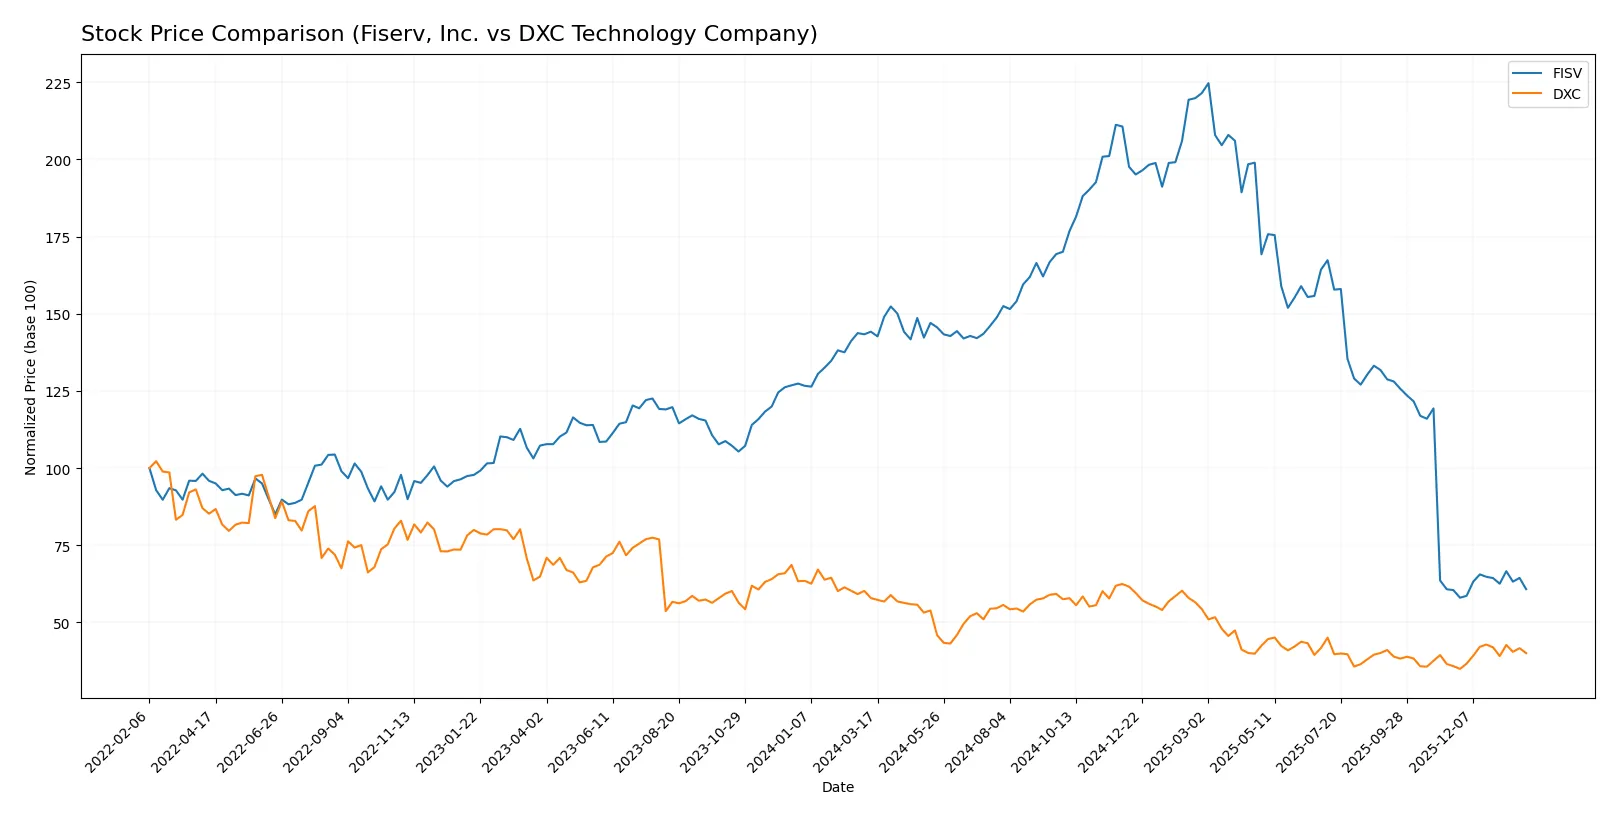
Trend Comparison
Fiserv, Inc. (FISV) experienced a sharp 57.86% price decline over the past year, marking a bearish trend with accelerating losses and high volatility. Recent weeks show a slight 0.49% gain, suggesting a minor stabilization.
DXC Technology Company (DXC) faced a 30.82% price drop over the same period, also bearish with accelerating losses but far lower volatility. Its recent 11.77% price increase points to a stronger short-term recovery.
Comparing trends, DXC outperformed FISV in market performance, delivering a less severe annual decline and more robust recent gains.
Target Prices
Analysts show a broad range for Fiserv, Inc. and a tighter range for DXC Technology Company.
| Company | Target Low | Target High | Consensus |
|---|---|---|---|
| Fiserv, Inc. | 62 | 180 | 105.61 |
| DXC Technology Company | 13 | 14 | 13.5 |
Fiserv’s target consensus of 105.61 suggests significant upside from its current 63.73 price, reflecting optimistic growth expectations. DXC’s consensus at 13.5 is slightly below its current price of 14.43, signaling cautious analyst sentiment.

Don’t Let Luck Decide Your Entry Point
Optimize your entry points with our advanced ProRealTime indicators. You’ll get efficient buy signals with precise price targets for maximum performance. Start outperforming now!
How do institutions grade them?
Fiserv, Inc. Grades
The following table summarizes recent grades awarded to Fiserv, Inc. by various financial institutions.
| Grading Company | Action | New Grade | Date |
|---|---|---|---|
| Tigress Financial | Maintain | Buy | 2025-12-31 |
| Mizuho | Maintain | Outperform | 2025-12-22 |
| Argus Research | Downgrade | Hold | 2025-10-30 |
| RBC Capital | Maintain | Outperform | 2025-10-30 |
| Bernstein | Downgrade | Market Perform | 2025-10-30 |
| Seaport Global | Downgrade | Neutral | 2025-10-30 |
| Keybanc | Downgrade | Sector Weight | 2025-10-30 |
| Truist Securities | Downgrade | Hold | 2025-10-30 |
| Keefe, Bruyette & Woods | Maintain | Outperform | 2025-10-30 |
| UBS | Downgrade | Neutral | 2025-10-30 |
DXC Technology Company Grades
This table presents the latest grades from reputable institutions for DXC Technology Company.
| Grading Company | Action | New Grade | Date |
|---|---|---|---|
| Stifel | Maintain | Hold | 2025-10-31 |
| JP Morgan | Maintain | Underweight | 2025-08-20 |
| Morgan Stanley | Maintain | Equal Weight | 2025-08-01 |
| RBC Capital | Maintain | Sector Perform | 2025-08-01 |
| JP Morgan | Maintain | Underweight | 2025-05-21 |
| RBC Capital | Maintain | Sector Perform | 2025-05-15 |
| BMO Capital | Maintain | Market Perform | 2025-05-15 |
| Morgan Stanley | Maintain | Equal Weight | 2025-05-15 |
| Guggenheim | Maintain | Neutral | 2025-05-12 |
| Susquehanna | Maintain | Neutral | 2025-04-23 |
Which company has the best grades?
Fiserv, Inc. has received generally stronger grades, including multiple “Buy” and “Outperform” ratings. DXC Technology’s ratings are mostly neutral or underweight. Investors may view Fiserv’s higher grades as a signal of comparatively better market sentiment and potential growth prospects.
Risks specific to each company
The following categories identify the critical pressure points and systemic threats facing both firms in the 2026 market environment:
1. Market & Competition
Fiserv, Inc.
- Faces pressure from fintech disruptors and cloud-native competitors in payments and financial services.
DXC Technology Company
- Competes in a commoditized IT services market with aggressive pricing and technology shifts.
2. Capital Structure & Debt
Fiserv, Inc.
- Moderate leverage (D/E 0.92), interest coverage is adequate at 4.64x, but debt-to-equity score is very unfavorable.
DXC Technology Company
- Higher leverage (D/E 1.41) with lower interest coverage at 3.38x, a moderate debt-to-equity score reflects elevated financial risk.
3. Stock Volatility
Fiserv, Inc.
- Beta at 0.80 indicates below-market volatility, range wide from $59.61 to $238.59 suggesting past price swings.
DXC Technology Company
- Beta at 1.05 signals market-level volatility, narrower price range $11.82 to $23.75 with recent stabilization signs.
4. Regulatory & Legal
Fiserv, Inc.
- Subject to stringent financial regulations and data security laws affecting global payment processing.
DXC Technology Company
- Faces regulatory risks in IT outsourcing and data management across multiple jurisdictions.
5. Supply Chain & Operations
Fiserv, Inc.
- Relies on software platforms and partnerships; technology integration risks could disrupt service delivery.
DXC Technology Company
- Complex global operations expose DXC to supply chain disruptions and client contract renewals risk.
6. ESG & Climate Transition
Fiserv, Inc.
- Limited disclosure on ESG metrics; increasing pressure to improve sustainability in data centers and operations.
DXC Technology Company
- ESG initiatives more advanced but face challenges in reducing carbon footprint amid large-scale infrastructure services.
7. Geopolitical Exposure
Fiserv, Inc.
- Primarily US-focused but serves global clients, exposing it to cross-border regulatory and trade tensions.
DXC Technology Company
- Significant international exposure with operations in volatile regions, heightening geopolitical and compliance risks.
Which company shows a better risk-adjusted profile?
Fiserv’s main risk lies in competitive disruption within payments technology. DXC’s greatest vulnerability is its elevated financial leverage impacting stability. Despite both being in financial distress zones per Altman Z-Score, DXC’s more favorable valuation multiples and stronger ratings suggest a slightly better risk-adjusted profile. The wide price range of Fiserv’s stock reflects market uncertainty about its growth trajectory, justifying cautious positioning.
Final Verdict: Which stock to choose?
Fiserv, Inc. excels as a cash-generating powerhouse with a very favorable economic moat, marked by growing profitability and disciplined capital allocation. Its point of vigilance lies in valuation multiples, which appear stretched relative to its peers. This stock suits portfolios seeking steady long-term growth with moderate risk tolerance.
DXC Technology Company leans on its value proposition as a potential turnaround play, supported by low valuation multiples and a slightly favorable rating profile. However, it faces a very unfavorable moat with declining returns and profitability. It fits portfolios that prioritize value investing with a higher risk appetite and patience for recovery.
If you prioritize durable competitive advantages and consistent value creation, Fiserv outshines due to its strong moat and robust income growth. However, if you seek deep value opportunities with a margin of safety and can withstand operational challenges, DXC offers better stability in valuation and upside potential. Both scenarios warrant careful risk management and monitoring.
Disclaimer: Investment carries a risk of loss of initial capital. The past performance is not a reliable indicator of future results. Be sure to understand risks before making an investment decision.
Go Further
I encourage you to read the complete analyses of Fiserv, Inc. and DXC Technology Company to enhance your investment decisions: