Home > Comparison > Technology > FIS vs DXC
The strategic rivalry between Fidelity National Information Services, Inc. (FIS) and DXC Technology Company defines the current trajectory of the technology services sector. FIS operates as a diversified fintech powerhouse focused on merchant, banking, and capital markets solutions, while DXC Technology emphasizes IT services with a strong footprint in global business and infrastructure services. This analysis will clarify which company offers a superior risk-adjusted outlook for a diversified portfolio amid evolving digital transformation demands.
Table of contents
Companies Overview
Fidelity National Information Services and DXC Technology stand as key players in the evolving Information Technology Services sector.
Fidelity National Information Services, Inc.: A Comprehensive Financial Technology Powerhouse
Fidelity National Information Services dominates as a provider of technology solutions for merchants, banks, and capital markets. Its core revenue stems from Merchant Solutions, Banking Solutions, and Capital Market Solutions, delivering services from enterprise acquiring to securities processing. In 2026, the company strategically emphasizes digital solutions and risk management to sustain its competitive edge in global financial services.
DXC Technology Company: A Diverse IT Services Innovator
DXC Technology Company leads in information technology services and solutions, focusing on Global Business Services and Global Infrastructure Services. It generates revenue through analytics, consulting, cloud migration, and IT outsourcing. The 2026 strategy revolves around accelerating digital transformation and secure multi-cloud management, aiming to reduce client costs and risks while enhancing operational agility.
Strategic Collision: Similarities & Divergences
Both firms operate in the IT services space but diverge in approach: Fidelity National Information Services offers a closed ecosystem of financial technology, while DXC Technology delivers a more open, client-focused IT infrastructure platform. Their main market battle unfolds in digital transformation services for financial institutions and enterprises. Investors face distinct profiles: Fidelity leans on specialized fintech solutions, whereas DXC bets on broad IT modernization and cloud expertise.
Income Statement Comparison
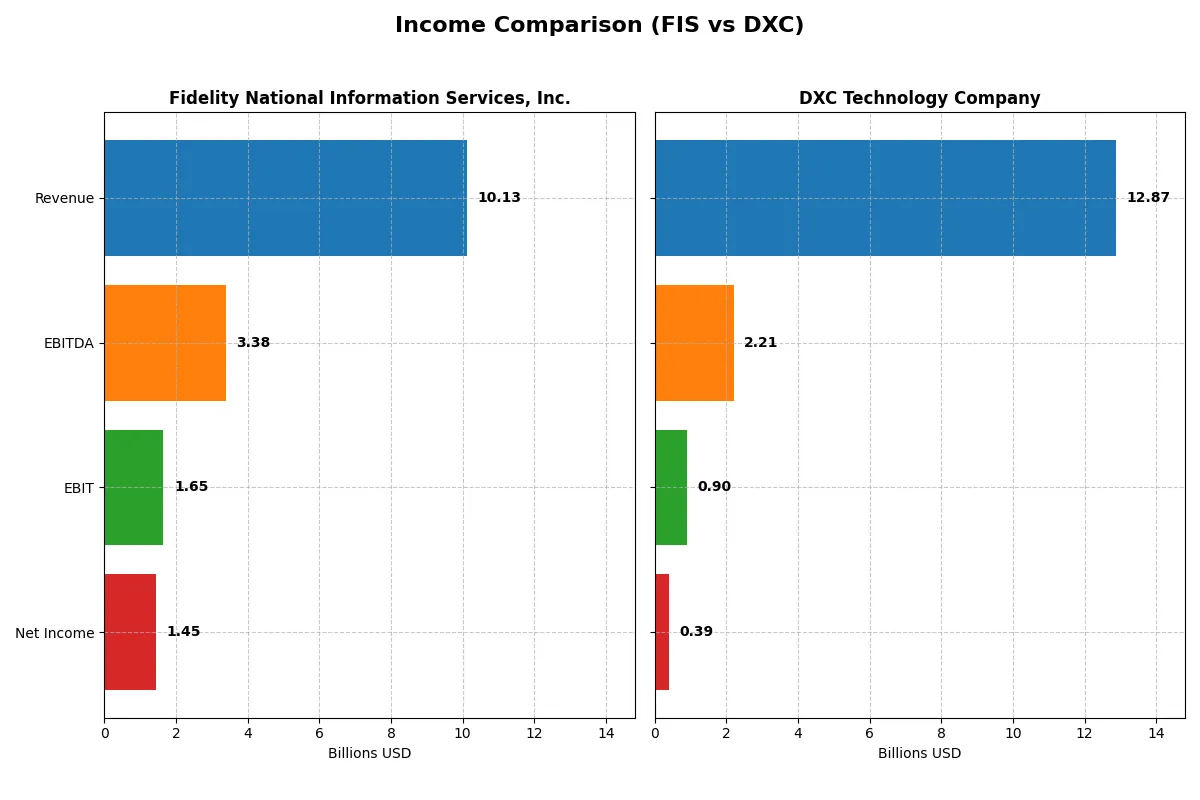
This data dissects the core profitability and scalability of both corporate engines to reveal who dominates the bottom line:
| Metric | Fidelity National Information Services, Inc. (FIS) | DXC Technology Company (DXC) |
|---|---|---|
| Revenue | 10.13B | 12.87B |
| Cost of Revenue | 6.32B | 9.77B |
| Operating Expenses | 2.10B | 2.40B |
| Gross Profit | 3.80B | 3.10B |
| EBITDA | 3.39B | 2.21B |
| EBIT | 1.65B | 0.90B |
| Interest Expense | 351M | 265M |
| Net Income | 1.45B | 389M |
| EPS | 1.42 | 2.15 |
| Fiscal Year | 2024 | 2025 |
Income Statement Analysis: The Bottom-Line Duel
This income statement comparison uncovers the true efficiency and profitability trajectories of these two distinct corporate engines.
Fidelity National Information Services, Inc. Analysis
FIS’s revenue shows modest growth, reaching $10.1B in 2024, while net income surged to $1.45B after recovering from prior losses. Gross and net margins hold strong at 37.6% and 14.3%, respectively, reflecting solid cost control. The 2024 EBIT margin jumped nearly 20%, signaling improved operating efficiency and momentum.
DXC Technology Company Analysis
DXC’s revenue declined slightly to $12.9B in 2025, with net income rebounding to $389M from losses in prior years. The gross margin remains favorable at 24.1%, but net margin lags at 3.0%. EBIT margin improved to 7%, indicating operational gains despite the top-line contraction, yet profitability remains modest compared to peers.
Margin Strength vs. Revenue Resilience
FIS outpaces DXC with superior margins, a stronger net income rebound, and more efficient cost management. DXC shows momentum in correcting losses but struggles with lower profitability and shrinking revenues. Investors seeking margin power and robust bottom-line growth may find FIS’s profile more attractive.
Financial Ratios Comparison
These vital ratios act as a diagnostic tool to expose the underlying fiscal health, valuation premiums, and capital efficiency of the companies compared below:
| Ratios | Fidelity National Information Services, Inc. (FIS) | DXC Technology Company (DXC) |
|---|---|---|
| ROE | 9.24% | 12.05% |
| ROIC | 3.99% | 4.43% |
| P/E | 30.80 | 7.92 |
| P/B | 2.85 | 0.95 |
| Current Ratio | 0.85 | 1.22 |
| Quick Ratio | 0.85 | 1.22 |
| D/E | 0.74 | 1.41 |
| Debt-to-Assets | 34.16% | 34.43% |
| Interest Coverage | 4.87 | 2.63 |
| Asset Turnover | 0.30 | 0.97 |
| Fixed Asset Turnover | 11.56 | 6.82 |
| Payout ratio | 55.17% | 0% |
| Dividend yield | 1.79% | 0% |
| Fiscal Year | 2024 | 2025 |
Efficiency & Valuation Duel: The Vital Signs
Financial ratios act as a company’s DNA, exposing hidden risks and revealing operational excellence critical to investment decisions.
Fidelity National Information Services, Inc.
FIS shows a solid net margin of 14.32%, but its ROE at 9.24% and ROIC at 3.99% lag behind its 6.42% WACC, signaling weak profitability efficiency. The stock trades at a stretched P/E of 30.8, indicating expensive valuation. Dividend yield stands neutral at 1.79%, reflecting moderate shareholder returns without aggressive buybacks.
DXC Technology Company
DXC posts a modest net margin of 3.02% with a neutral ROE of 12.05%, surpassing its WACC of 5.69%, which suggests reasonable capital efficiency. Valuation appears attractive with a low P/E of 7.92 and P/B below 1, implying undervaluation. No dividend payout marks a focus on reinvestment, though debt-to-equity at 1.41 raises leverage concerns.
Valuation Stretch vs. Operational Efficiency
DXC offers a better balance between valuation and operational metrics, trading at a discount with neutral to favorable profitability ratios. FIS, while profitable at the margin level, shows stretched valuation and weaker returns on equity and capital. Investors seeking value and efficiency may lean toward DXC; those favoring margin stability face higher valuation risk with FIS.
Which one offers the Superior Shareholder Reward?
I compare Fidelity National Information Services, Inc. (FIS) and DXC Technology Company (DXC) on shareholder returns through dividends and buybacks. FIS yields 1.79% with a 55% payout ratio, supported by free cash flow of 3.57B. Its buybacks are steady, reflecting a balanced capital return. DXC pays no dividend but retains 4.55B FCF, investing heavily in growth and acquisitions. DXC’s buyback program is modest but meaningful. I see FIS’s dividend-plus-buyback model as more sustainable, delivering predictable income and share price support. DXC’s reinvestment strategy suits growth investors but carries more execution risk. For 2026 total return, I favor FIS for superior, more reliable shareholder reward.
Comparative Score Analysis: The Strategic Profile
The radar chart reveals the fundamental DNA and trade-offs of Fidelity National Information Services, Inc. and DXC Technology Company:
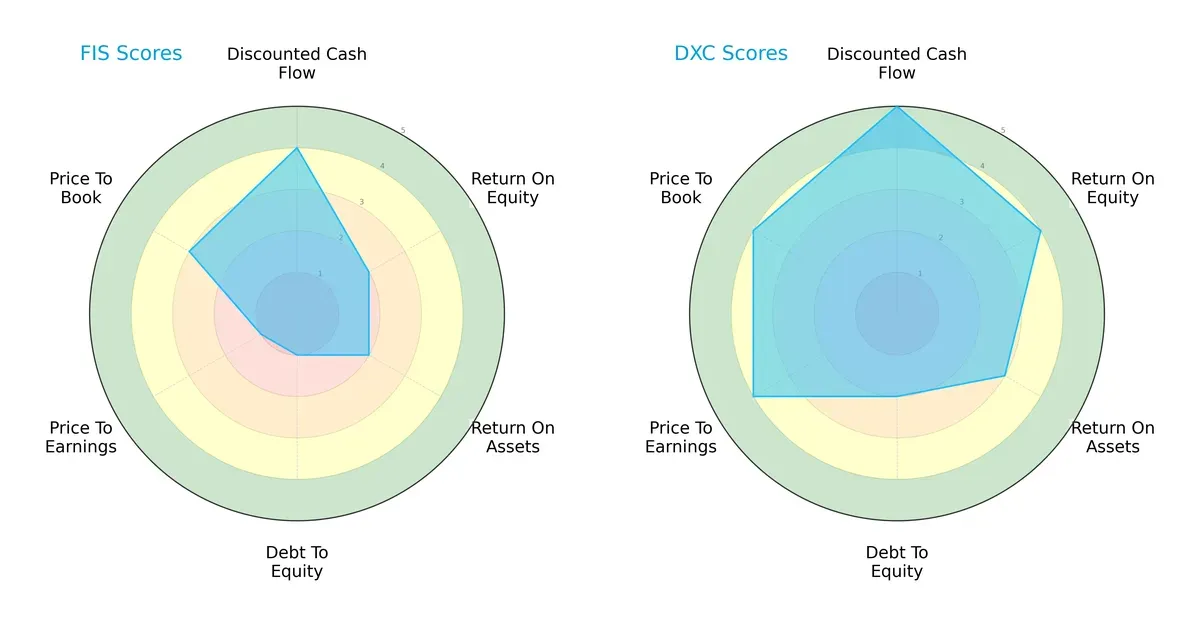
DXC dominates in overall financial health with an overall score of 4 versus FIS’s 2. DXC excels in discounted cash flow (5 vs. 4) and return on equity (4 vs. 2), reflecting superior capital allocation and profitability. FIS lags notably in debt management (score 1 vs. 2) and valuation metrics (P/E 1 vs. 4; P/B 3 vs. 4), signaling riskier leverage and potential overvaluation. I see DXC as the more balanced company, while FIS relies on a specific edge in moderate DCF but carries clear financial vulnerabilities.
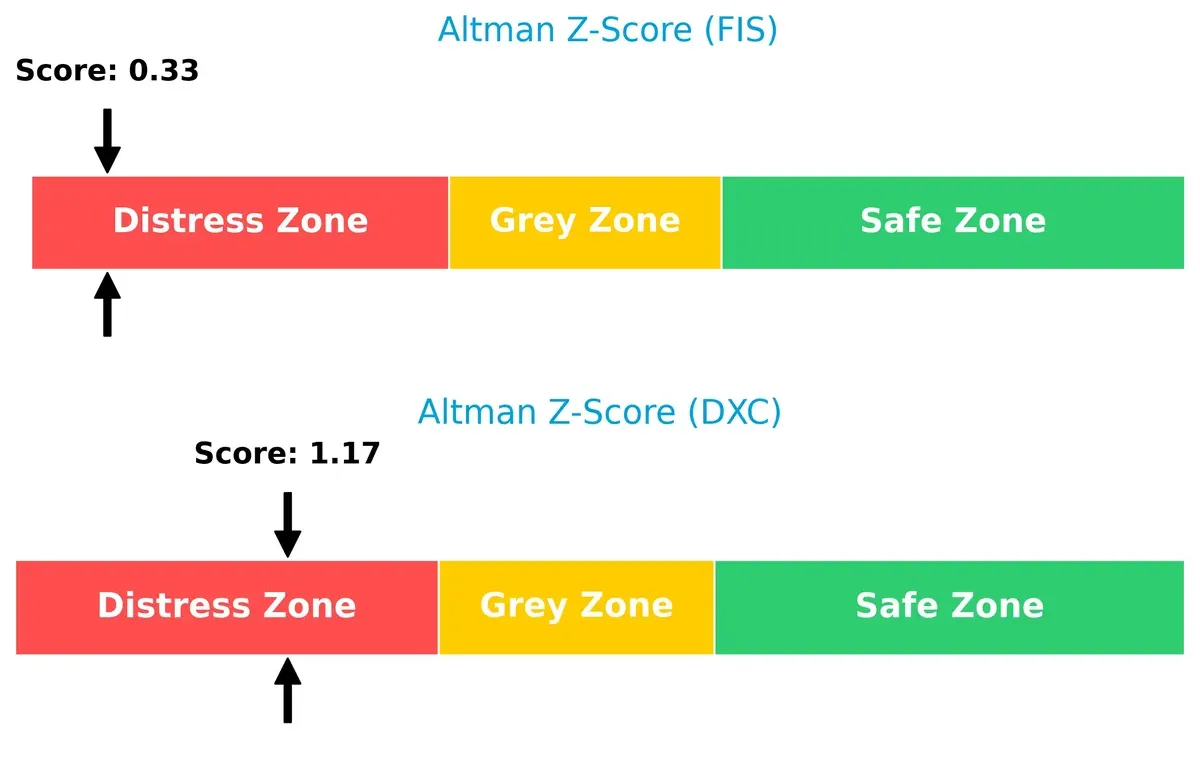
Bankruptcy Risk: Solvency Showdown
FIS’s Altman Z-Score of 0.33 versus DXC’s 1.17 places both firms in the distress zone, with FIS facing a higher bankruptcy risk. This implies elevated long-term survival challenges for FIS amid current market volatility:
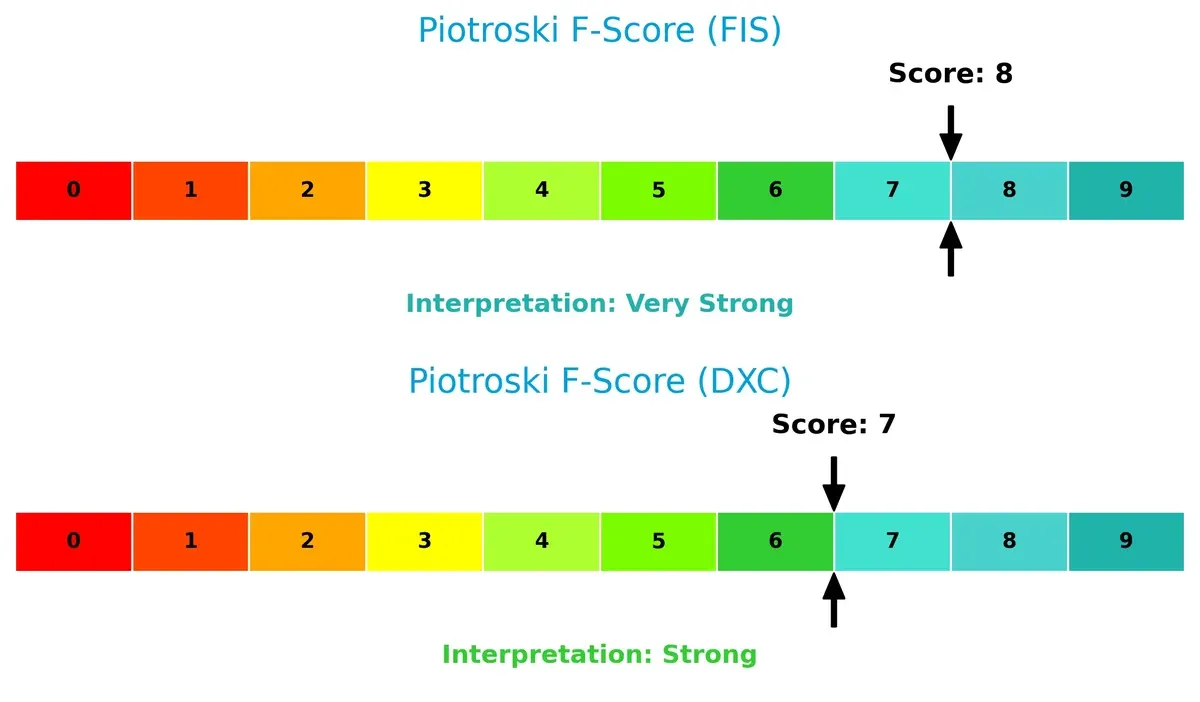
Financial Health: Quality of Operations
FIS scores an impressive 8 on the Piotroski F-Score, slightly above DXC’s 7, indicating very strong operational health. This suggests FIS maintains robust internal controls and profitability metrics, despite solvency concerns:
How are the two companies positioned?
This section dissects the operational DNA of FIS and DXC by comparing their revenue distribution and internal dynamics. The goal is to confront their economic moats and identify which model offers the most resilient, sustainable advantage today.
Revenue Segmentation: The Strategic Mix
This visual comparison dissects how Fidelity National Information Services, Inc. and DXC Technology Company diversify their income streams and where their primary sector bets lie:
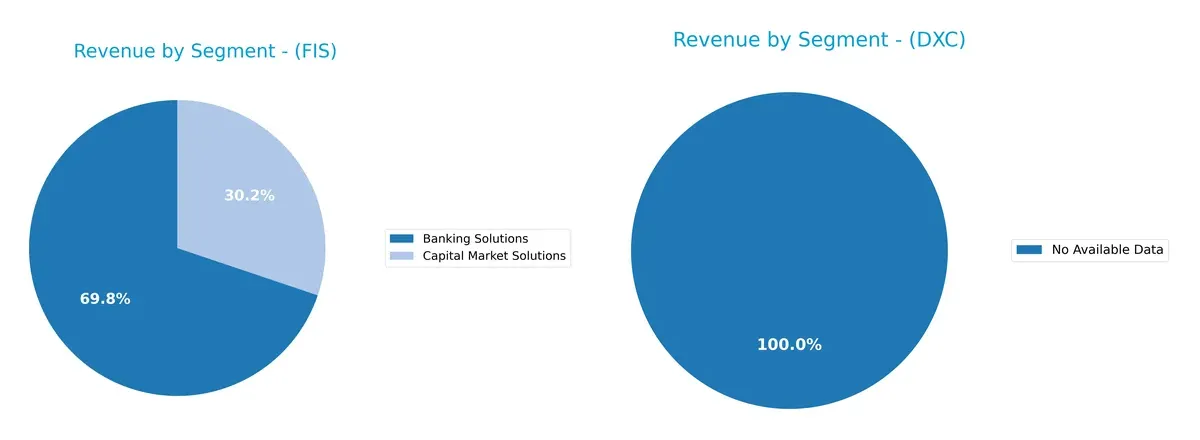
Fidelity National Information Services, Inc. clearly anchors its revenue in Banking Solutions with $6.9B in 2024, complemented by $3B from Capital Market Solutions. DXC Technology Company lacks available segment data, preventing a direct comparison. FIS’s reliance on two strong segments suggests focused expertise but carries moderate concentration risk. This mix supports ecosystem lock-in within financial services, leveraging infrastructure dominance to sustain competitive moats.
Strengths and Weaknesses Comparison
This table compares the Strengths and Weaknesses of Fidelity National Information Services, Inc. (FIS) and DXC Technology Company (DXC):
FIS Strengths
- Strong Banking Solutions revenue of $6.9B in 2024
- Significant North America presence with $7.8B revenue
- Favorable net margin at 14.3%
- Low WACC at 6.42% supports capital efficiency
- High fixed asset turnover at 11.56 indicating asset productivity
DXC Strengths
- Favorable P/E of 7.92 and P/B of 0.95 suggest valuation appeal
- Neutral ROE of 12.05% indicates moderate profitability
- Favorable quick ratio at 1.22 supports liquidity
- Lower WACC at 5.69% enhances value creation
- Fixed asset turnover of 6.82 shows asset use efficiency
FIS Weaknesses
- ROE at 9.24% and ROIC at 3.99% below WACC of 6.42% signals weak returns
- Low current ratio of 0.85 indicates liquidity risk
- Unfavorable asset turnover at 0.3 suggests inefficient asset use
- High P/E of 30.8 may imply overvaluation
- Net margin lower than sector leaders
DXC Weaknesses
- Net margin at 3.02% is weak compared to peers
- Debt-to-equity ratio at 1.41 indicates higher leverage risk
- No dividend yield reduces income appeal
- ROIC at 4.43% below WACC of 5.69% signals capital inefficiency
- Interest coverage at 3.38 may constrain debt servicing
FIS exhibits strong revenue diversification and profitability in banking and North America markets but faces challenges in profitability ratios and liquidity. DXC shows valuation attractiveness and liquidity strengths but struggles with low margins and higher leverage. These contrasts highlight differing strategic focuses and operational risks.
The Moat Duel: Analyzing Competitive Defensibility
A structural moat is the only true shield protecting long-term profits from relentless competitive erosion in dynamic markets:
Fidelity National Information Services, Inc. (FIS): Expanding Intangible Assets Moat
FIS leverages deep intangible assets—technology platforms and client integrations—that stabilize margins and support a 14% net margin. Its growing ROIC trend signals improving capital efficiency despite currently shedding value. New digital banking solutions in 2026 could deepen its moat.
DXC Technology Company (DXC): Cost and Service Scale Moat
DXC depends on scale-driven cost advantages and a broad service portfolio, contrasting with FIS’s intangible focus. However, its declining ROIC and weaker margins reflect shrinking capital returns. DXC’s cloud migration services could spark a turnaround if it reverses profitability trends.
Intangible Assets vs. Scale Efficiency: Who Holds the Deeper Moat?
FIS’s intangible assets foster higher margin stability and improving profitability, granting it a wider moat than DXC’s scale-dependent model. FIS is better positioned to defend market share through innovation and client lock-in.
Which stock offers better returns?
The past year shows marked declines for both stocks, with DXC Technology’s recent rebound contrasting Fidelity National Information Services’ sustained downward momentum.
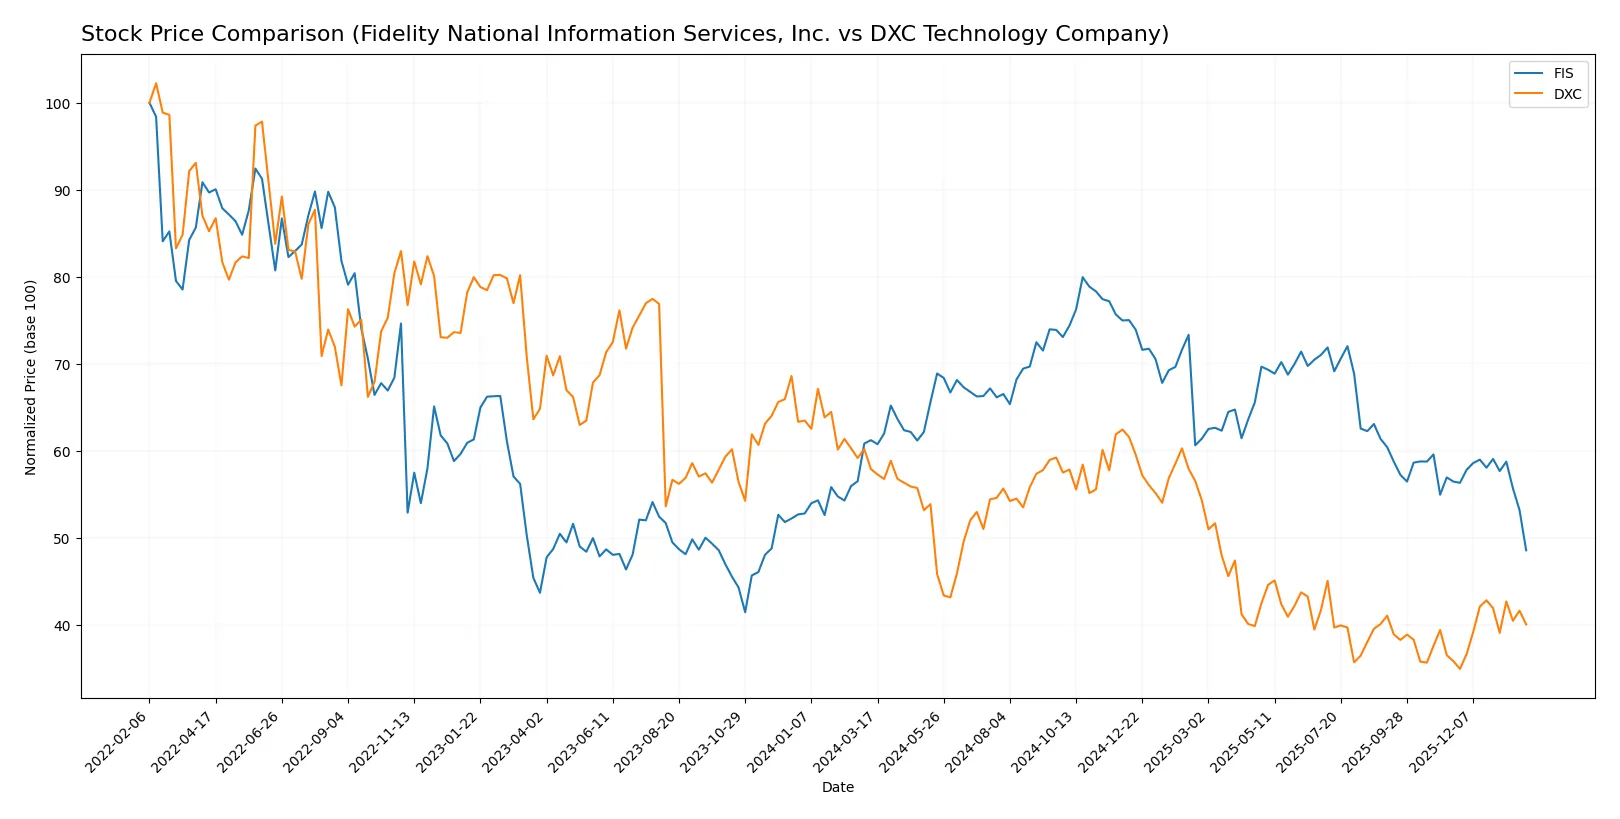
Trend Comparison
Fidelity National Information Services, Inc. experienced a 20.67% price drop over the past 12 months, marking a bearish trend with decelerating losses and volatility marked by a 7.34 standard deviation.
DXC Technology Company saw a sharper 30.82% decline overall, confirming a bearish trend but with accelerating losses. Recently, DXC posted an 11.77% gain, signaling a short-term bullish reversal.
Comparing both, DXC exhibited the largest overall loss but the strongest recent recovery. Fidelity’s trend remained uniformly negative, placing DXC ahead in recent performance dynamics.
Target Prices
Analysts present a moderate upside potential for both Fidelity National Information Services, Inc. and DXC Technology Company.
| Company | Target Low | Target High | Consensus |
|---|---|---|---|
| Fidelity National Information Services, Inc. | 69 | 85 | 75.43 |
| DXC Technology Company | 13 | 14 | 13.5 |
FIS’s consensus target of 75.43 implies a 36% upside from its current 55.25 price, signaling strong analyst confidence. DXC’s target consensus at 13.5 sits slightly below its current 14.43 price, suggesting limited near-term upside.

Don’t Let Luck Decide Your Entry Point
Optimize your entry points with our advanced ProRealTime indicators. You’ll get efficient buy signals with precise price targets for maximum performance. Start outperforming now!
How do institutions grade them?
Here is a comparison of the latest reliable institutional grades for both companies:
Fidelity National Information Services, Inc. Grades
The following table summarizes recent grades from reputable firms covering FIS:
| Grading Company | Action | New Grade | Date |
|---|---|---|---|
| Truist Securities | Maintain | Hold | 2025-11-19 |
| RBC Capital | Maintain | Outperform | 2025-11-06 |
| JP Morgan | Maintain | Overweight | 2025-11-06 |
| UBS | Maintain | Buy | 2025-11-06 |
| Truist Securities | Maintain | Hold | 2025-10-24 |
| Keefe, Bruyette & Woods | Maintain | Outperform | 2025-10-01 |
| UBS | Upgrade | Buy | 2025-09-30 |
| UBS | Maintain | Neutral | 2025-08-06 |
| Keefe, Bruyette & Woods | Maintain | Outperform | 2025-08-06 |
| Truist Securities | Maintain | Hold | 2025-07-17 |
DXC Technology Company Grades
This table presents recent credible grades assigned to DXC Technology:
| Grading Company | Action | New Grade | Date |
|---|---|---|---|
| Stifel | Maintain | Hold | 2025-10-31 |
| JP Morgan | Maintain | Underweight | 2025-08-20 |
| Morgan Stanley | Maintain | Equal Weight | 2025-08-01 |
| RBC Capital | Maintain | Sector Perform | 2025-08-01 |
| JP Morgan | Maintain | Underweight | 2025-05-21 |
| RBC Capital | Maintain | Sector Perform | 2025-05-15 |
| BMO Capital | Maintain | Market Perform | 2025-05-15 |
| Morgan Stanley | Maintain | Equal Weight | 2025-05-15 |
| Guggenheim | Maintain | Neutral | 2025-05-12 |
| Susquehanna | Maintain | Neutral | 2025-04-23 |
Which company has the best grades?
FIS holds consistently stronger grades, including multiple Buy and Outperform ratings. DXC’s grades cluster around Hold and Underweight, signaling more cautious sentiment. Investors may view FIS as having more institutional confidence.
Risks specific to each company
The following categories identify the critical pressure points and systemic threats facing both firms in the 2026 market environment:
1. Market & Competition
Fidelity National Information Services, Inc.
- Faces intense competition in fintech and digital banking solutions with pressure on margins.
DXC Technology Company
- Competes in IT services with a broad service portfolio but faces pricing pressure and market fragmentation.
2. Capital Structure & Debt
Fidelity National Information Services, Inc.
- Maintains moderate leverage (D/E 0.74) but weak interest coverage (4.7x) and low liquidity (current ratio 0.85) raise red flags.
DXC Technology Company
- Higher leverage (D/E 1.41) and weaker interest coverage (3.38x) increase financial risk despite better liquidity ratios (1.22).
3. Stock Volatility
Fidelity National Information Services, Inc.
- Beta below 1 (0.939) suggests less volatility than the market, offering some stability.
DXC Technology Company
- Beta above 1 (1.045) signals higher stock price volatility and market sensitivity.
4. Regulatory & Legal
Fidelity National Information Services, Inc.
- Operates in highly regulated financial services sector, exposing it to compliance risks and evolving fintech regulations.
DXC Technology Company
- Faces regulatory complexity across multiple jurisdictions, especially in data security and cloud services compliance.
5. Supply Chain & Operations
Fidelity National Information Services, Inc.
- Relies on technology infrastructure and partnerships; operational disruptions could impact service delivery.
DXC Technology Company
- Complex global infrastructure services increase operational risk, especially in cloud migration and security.
6. ESG & Climate Transition
Fidelity National Information Services, Inc.
- ESG initiatives less emphasized; potential reputational risks amid rising investor focus on sustainability.
DXC Technology Company
- Increasing pressure to improve ESG metrics and energy efficiency in IT operations and data centers.
7. Geopolitical Exposure
Fidelity National Information Services, Inc.
- Primarily US-focused with moderate international exposure, limiting geopolitical risk.
DXC Technology Company
- Global footprint across North America, Europe, Asia, and Australia increases exposure to geopolitical tensions and trade policies.
Which company shows a better risk-adjusted profile?
DXC Technology’s key risk lies in its high leverage and operational complexity, while Fidelity National Information Services faces liquidity constraints and regulatory pressures. Despite DXC’s higher debt, its stronger valuation metrics and better liquidity suggest a more balanced risk profile. Fidelity’s Altman Z-Score deep in distress zone signals urgent financial caution. This contrast underscores DXC’s relatively superior risk-adjusted position in 2026.
Final Verdict: Which stock to choose?
Fidelity National Information Services, Inc. (FIS) stands out for its resilient operational improvements and growing profitability despite value destruction. Its superpower lies in improving income quality and expanding margins. The point of vigilance is its weak liquidity and capital efficiency, making it suitable for investors with an appetite for turnaround stories and aggressive growth.
DXC Technology Company (DXC) offers a compelling moat through undervaluation and solid balance sheet metrics. Its strategic edge lies in a more favorable valuation and stronger cash flow yields, providing better safety compared to FIS. DXC fits well in portfolios seeking GARP (Growth at a Reasonable Price) with a risk-conscious approach.
If you prioritize high-growth potential and can tolerate short-term financial strain, FIS is the compelling choice due to accelerating profitability and margin expansion. However, if you seek better stability and valuation discipline, DXC offers superior financial footing and risk management. Both companies present distinct analytical scenarios aligned with different investor profiles.
Disclaimer: Investment carries a risk of loss of initial capital. The past performance is not a reliable indicator of future results. Be sure to understand risks before making an investment decision.
Go Further
I encourage you to read the complete analyses of Fidelity National Information Services, Inc. and DXC Technology Company to enhance your investment decisions: