Home > Comparison > Technology > EPAM vs DXC
The strategic rivalry between EPAM Systems, Inc. and DXC Technology Company shapes the evolution of the information technology services sector. EPAM operates as a high-margin digital platform engineering firm, while DXC emphasizes broad IT outsourcing and infrastructure services. This head-to-head reflects a contest between specialized innovation and scale-driven operational breadth. This analysis will clarify which corporate model offers a superior risk-adjusted return for a diversified portfolio in today’s technology landscape.
Table of contents
Companies Overview
EPAM Systems and DXC Technology shape the landscape of global IT services with distinct scale and specialization.
EPAM Systems, Inc.: Digital Platform Engineering Leader
EPAM Systems excels as a digital platform engineering and software development powerhouse. Its revenue stems primarily from engineering services, infrastructure management, and digital consulting. In 2026, EPAM focuses strategically on integrated engineering practices, smart automation, and advanced solutions like AI and virtual reality, reinforcing its competitive edge in customized software innovation.
DXC Technology Company: IT Services and Solutions Provider
DXC Technology operates as a broad-spectrum information technology services firm. It generates revenue through global business services and infrastructure solutions, including cloud migration and security. The 2026 strategy centers on accelerating digital transformation, agile process automation, and secure multi-cloud management, targeting enterprise modernization and risk reduction across North America, Europe, and Asia.
Strategic Collision: Similarities & Divergences
Both companies deliver IT services but diverge in approach: EPAM emphasizes bespoke software engineering and innovation, while DXC prioritizes integrated infrastructure and cloud services. Their primary battleground lies in digital transformation, where EPAM targets customized platforms and DXC focuses on scalable cloud ecosystems. This creates distinct investment profiles—EPAM as a growth-oriented specialist and DXC as a broad-based service consolidator.
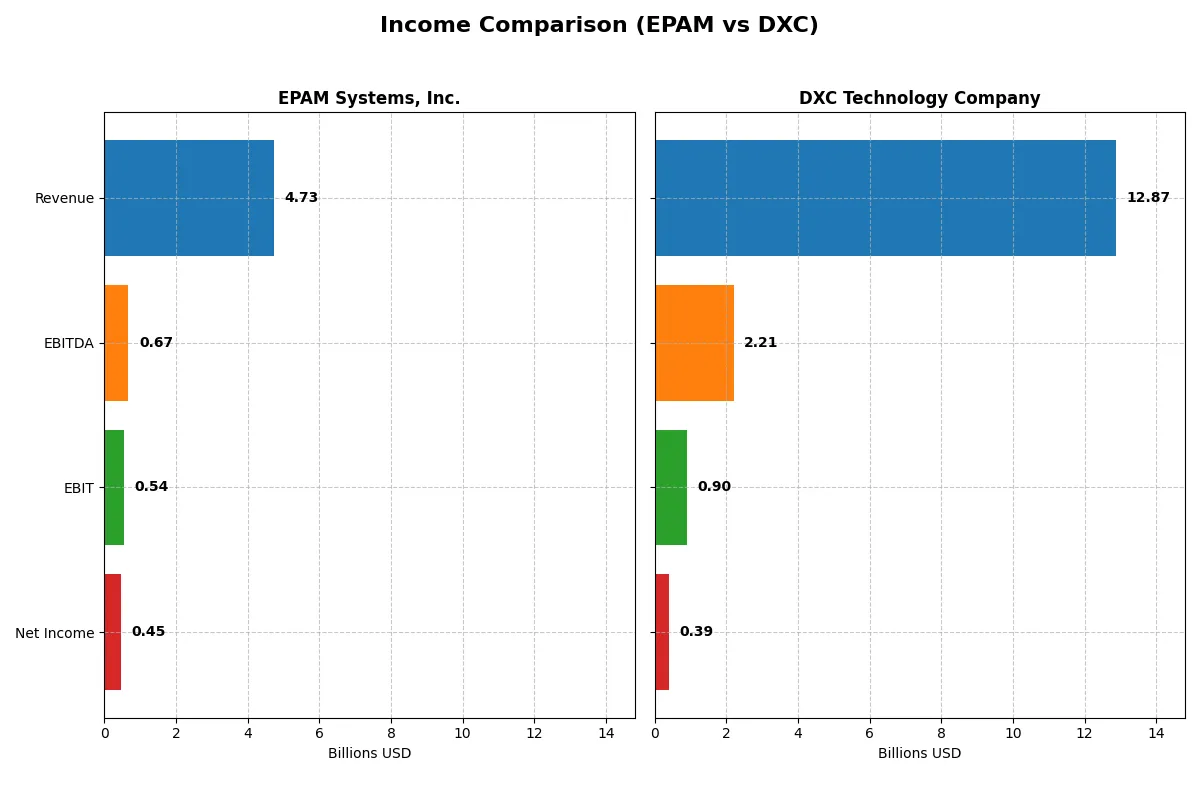
Income Statement Comparison
The following data dissects the core profitability and scalability of both corporate engines to reveal who dominates the bottom line:
| Metric | EPAM Systems, Inc. (EPAM) | DXC Technology Company (DXC) |
|---|---|---|
| Revenue | 4.73B | 12.87B |
| Cost of Revenue | 3.28B | 9.77B |
| Operating Expenses | 906M | 2.40B |
| Gross Profit | 1.45B | 3.10B |
| EBITDA | 672M | 2.21B |
| EBIT | 545M | 895M |
| Interest Expense | 0 | 265M |
| Net Income | 455M | 389M |
| EPS | 7.93 | 2.15 |
| Fiscal Year | 2024 | 2025 |
Income Statement Analysis: The Bottom-Line Duel
The following income statement comparison reveals the true efficiency and profitability dynamics behind EPAM Systems and DXC Technology’s business engines.
EPAM Systems, Inc. Analysis
EPAM’s revenue rose steadily from $2.7B in 2020 to $4.7B in 2024, reflecting a strong 78% growth over five years. Net income climbed from $327M to $455M, despite a slight dip in net margin to 9.6%. Gross margins consistently hover near 31%, indicating robust cost control. In 2024, EPAM’s improving EBIT and net income growth signal operational momentum and efficiency.
DXC Technology Company Analysis
DXC’s revenue declined from $16.3B in 2021 to $12.9B in 2025, a 21% drop reflecting ongoing challenges. Net income swung from a $568M loss in 2023 to a $389M profit in 2025, with net margin recovering to 3%. Gross margin steadied around 24%, lower than EPAM’s, while EBIT margin improved but remains modest. DXC’s recent earnings rebound shows potential, though revenue contraction weighs on overall efficiency.
Margin Strength vs. Revenue Resilience
EPAM outperforms DXC with higher gross and net margins and consistent revenue growth, underscoring operational efficiency and margin power. DXC’s volatile earnings and shrinking top line reveal structural challenges despite recent profit recovery. For investors prioritizing steady profit generation and margin health, EPAM’s profile offers a clearer fundamental advantage.
Financial Ratios Comparison
These vital ratios act as a diagnostic tool to expose the underlying fiscal health, valuation premiums, and capital efficiency of the companies compared below:
| Ratios | EPAM Systems, Inc. (EPAM) | DXC Technology Company (DXC) |
|---|---|---|
| ROE | 12.5% | 12.0% |
| ROIC | 10.7% | 4.4% |
| P/E | 29.5 | 7.9 |
| P/B | 3.69 | 0.95 |
| Current Ratio | 2.96 | 1.22 |
| Quick Ratio | 2.96 | 1.22 |
| D/E | 0.045 | 1.41 |
| Debt-to-Assets | 3.4% | 34.4% |
| Interest Coverage | 0 | 2.63 |
| Asset Turnover | 1.00 | 0.97 |
| Fixed Asset Turnover | 14.07 | 6.82 |
| Payout ratio | 0% | 0% |
| Dividend yield | 0% | 0% |
| Fiscal Year | 2024 | 2025 |
Efficiency & Valuation Duel: The Vital Signs
Financial ratios act as a company’s DNA, uncovering hidden risks and operational strengths that shape investor decisions.
EPAM Systems, Inc.
EPAM displays solid profitability with a 12.52% ROE and a 9.61% net margin, signaling operational competence. However, its valuation is stretched, marked by a high P/E of 29.47 and P/B of 3.69. The firm reinvests earnings rather than paying dividends, focusing on growth and capital preservation.
DXC Technology Company
DXC shows moderate profitability with a neutral 12.05% ROE but a weak 3.02% net margin. Its valuation appears attractive, with a low P/E of 7.92 and P/B under 1. The company carries higher leverage and offers no dividend, reflecting a cautious balance between risk and capital efficiency.
Premium Valuation vs. Operational Safety
EPAM commands a premium valuation but boasts better profitability and financial stability. DXC offers a cheaper entry but faces profit and debt concerns. Investors seeking operational safety may lean toward EPAM, while value seekers might prefer DXC’s discounted profile.
Which one offers the Superior Shareholder Reward?
I contrast EPAM Systems, Inc. and DXC Technology Company on their shareholder returns through dividends and buybacks. Neither pays dividends currently, so I focus on payout ratios, free cash flow (FCF) coverage, and buyback intensity. EPAM generates robust free cash flow of about 9.2/share with zero dividend payout, reinvesting heavily in growth and R&D. Its free cash flow covers capital expenditures remarkably well, above 17x, indicating strong internal funding capability. DXC delivers lower free cash flow at roughly 4.5/share and has no meaningful dividends or buybacks recently, while carrying high debt leverage (debt/equity >1.4) and weaker cash ratios. EPAM’s capital-light model and strong cash generation underpin a more sustainable total return strategy. I see EPAM offering superior long-term shareholder rewards through disciplined reinvestment and potential future buybacks, whereas DXC’s riskier balance sheet and weaker cash flow limit its appeal in 2026.
Comparative Score Analysis: The Strategic Profile
The radar chart reveals the fundamental DNA and trade-offs of EPAM Systems, Inc. and DXC Technology Company, highlighting their core financial strengths and weaknesses:
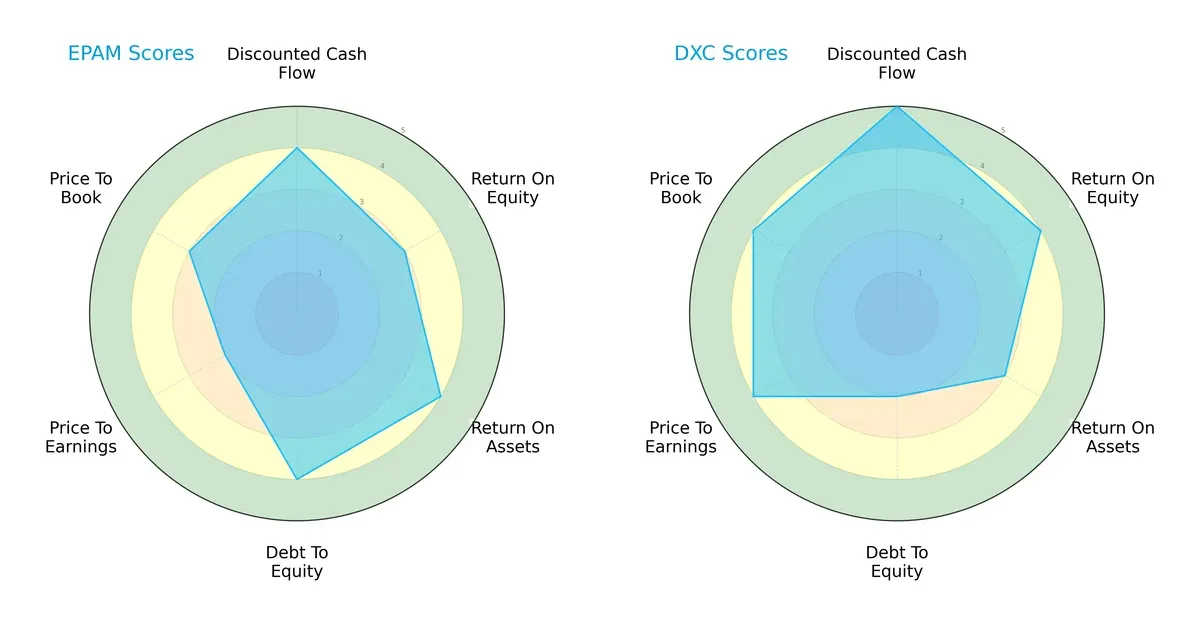
EPAM shows balanced strengths in DCF (4), ROA (4), and Debt/Equity (4), but lags in PE (2) and PB (3) valuation metrics. DXC excels in DCF (5) and ROE (4) but carries higher financial risk with a weaker Debt/Equity score (2). EPAM presents a more stable financial structure, while DXC relies on cash flow and profitability edges.
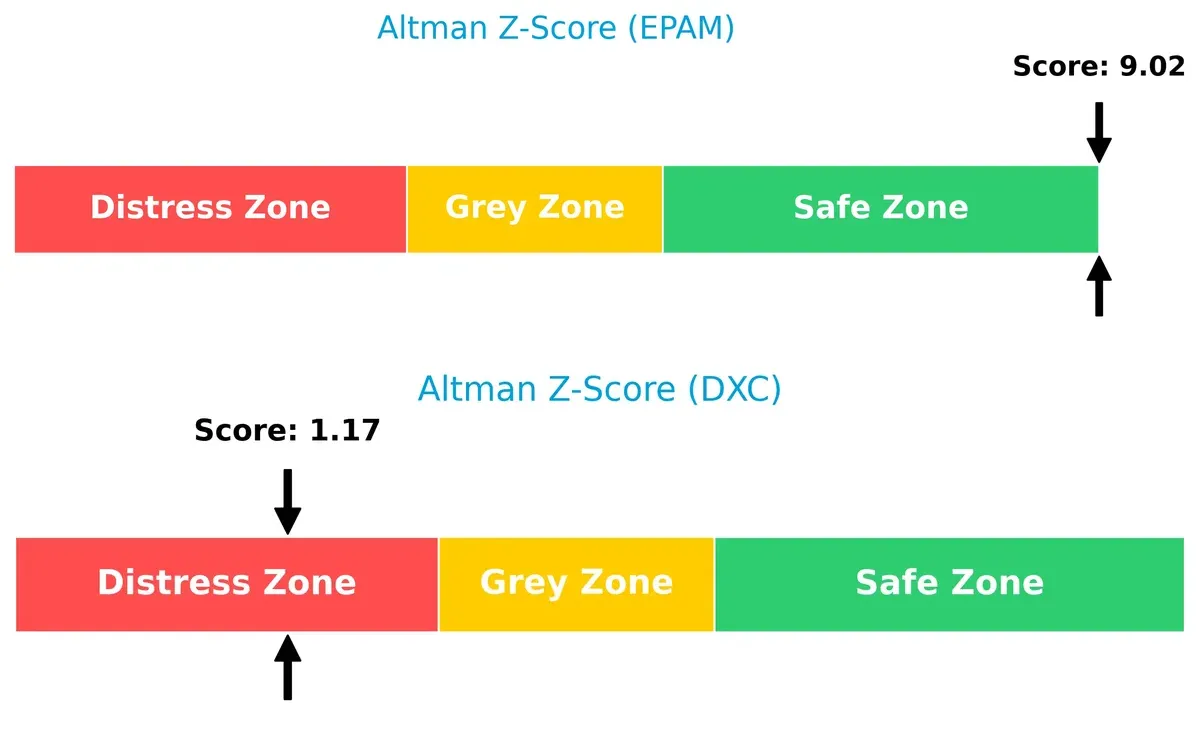
Bankruptcy Risk: Solvency Showdown
The Altman Z-Score delta signals a stark contrast in solvency: EPAM scores 9.0, firmly in the safe zone, while DXC’s 1.2 puts it in the distress zone, indicating elevated bankruptcy risk in this cycle:
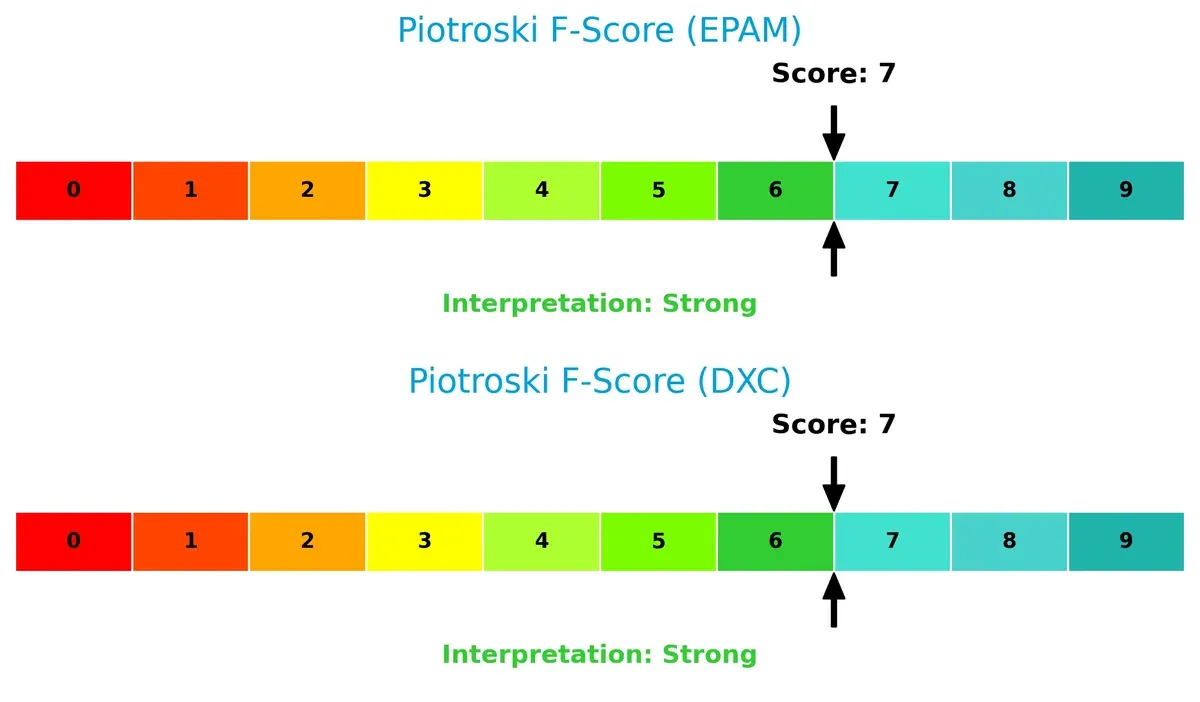
Financial Health: Quality of Operations
Both companies register strong Piotroski F-Scores of 7, reflecting solid operational quality and financial robustness. Neither shows immediate red flags in internal metrics, but ongoing vigilance is warranted:
How are the two companies positioned?
This section dissects EPAM and DXC’s operational DNA by comparing revenue distribution and internal strengths and weaknesses. The goal is to confront their economic moats to identify the most resilient, sustainable competitive advantage today.
Revenue Segmentation: The Strategic Mix
This visual comparison dissects how EPAM Systems, Inc. and DXC Technology Company diversify their income streams and where their primary sector bets lie:
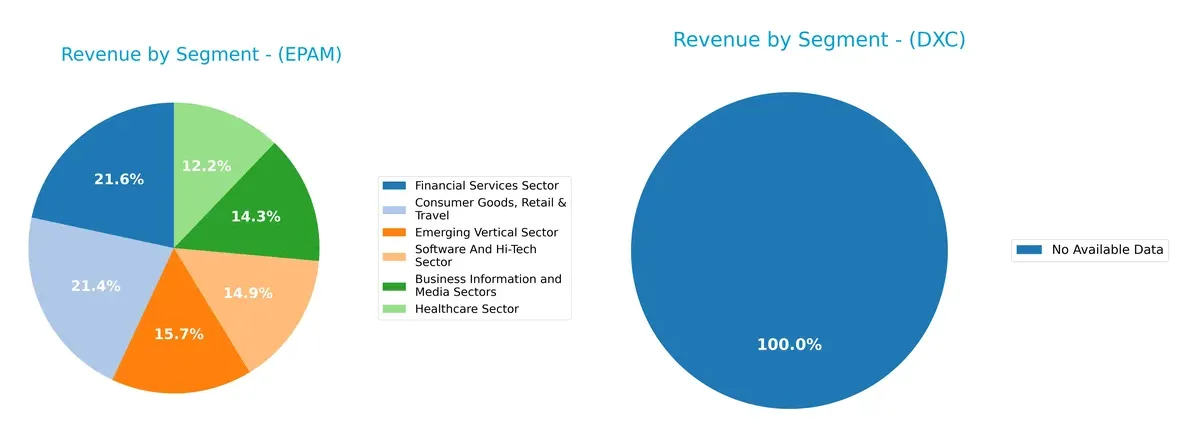
EPAM shows a well-balanced revenue mix, with its largest segments—Consumer Goods, Retail & Travel at $1.01B and Financial Services at $1.02B—closely matched. This diversification contrasts sharply with DXC, which lacks available segment data. EPAM’s broad sector exposure reduces concentration risk and signals ecosystem lock-in across media, healthcare, and hi-tech. DXC’s missing data, however, raises transparency concerns for investors assessing its strategic focus.
Strengths and Weaknesses Comparison
This table compares the Strengths and Weaknesses of EPAM Systems, Inc. and DXC Technology Company:
EPAM Strengths
- Diversified revenue across six verticals
- Strong global presence with $2.68B US revenue
- High current and quick ratios (~2.96) indicate liquidity
- Very low debt-to-equity (0.04) reduces financial risk
- High fixed asset turnover (14.07) shows efficient asset use
DXC Strengths
- Favorable valuation metrics (PE 7.92, PB 0.95) suggest undervaluation
- Lower WACC (5.69%) reduces capital costs
- Favorable quick ratio (1.22) supports liquidity
- Moderate fixed asset turnover (6.82) supports operational efficiency
- Neutral ROE (~12%) maintains steady profitability
EPAM Weaknesses
- ROIC (10.67%) below WACC (11.82%) signals value destruction
- Unfavorable PE (29.47) and PB (3.69) imply expensive valuation
- Zero dividend yield limits income for investors
- Neutral net margin (9.61%) limits profitability upside
- Moderate net margin and ROE indicate room for improvement
DXC Weaknesses
- Low net margin (3.02%) limits profitability
- High debt-to-equity (1.41) raises financial risk
- ROIC (4.43%) below WACC (5.69%) indicates poor capital returns
- Interest coverage (3.38) only neutral, potential risk if earnings drop
- Zero dividend yield also limits income potential
EPAM benefits from strong liquidity, asset efficiency, and a balanced global footprint but faces challenges in capital returns and valuation. DXC shows favorable valuation and cost of capital but struggles with profitability and higher leverage, highlighting different strategic priorities.
The Moat Duel: Analyzing Competitive Defensibility
A structural moat is the only true safeguard for long-term profits against relentless competition erosion:
EPAM Systems, Inc.: Intangible Assets Moat
EPAM leverages deep software engineering expertise and client trust to sustain high ROIC and margin stability. Yet, declining ROIC signals pressure, though expansion in AI and digital platforms could reinforce its moat in 2026.
DXC Technology Company: Scale and Service Integration Moat
DXC relies on global infrastructure scale and integrated IT services, contrasting EPAM’s tech focus. Its ROIC also declines, but aggressive digital transformation services may unlock new growth avenues amidst market disruption.
Intangible Expertise vs. Scale Integration: Who Holds the Stronger Moat?
Both companies face shrinking ROIC and value destruction, showing weak moats. EPAM’s intangible asset base offers a slightly deeper moat, but DXC’s scale could defend niche segments better. EPAM appears better positioned to protect market share long term.
Which stock offers better returns?
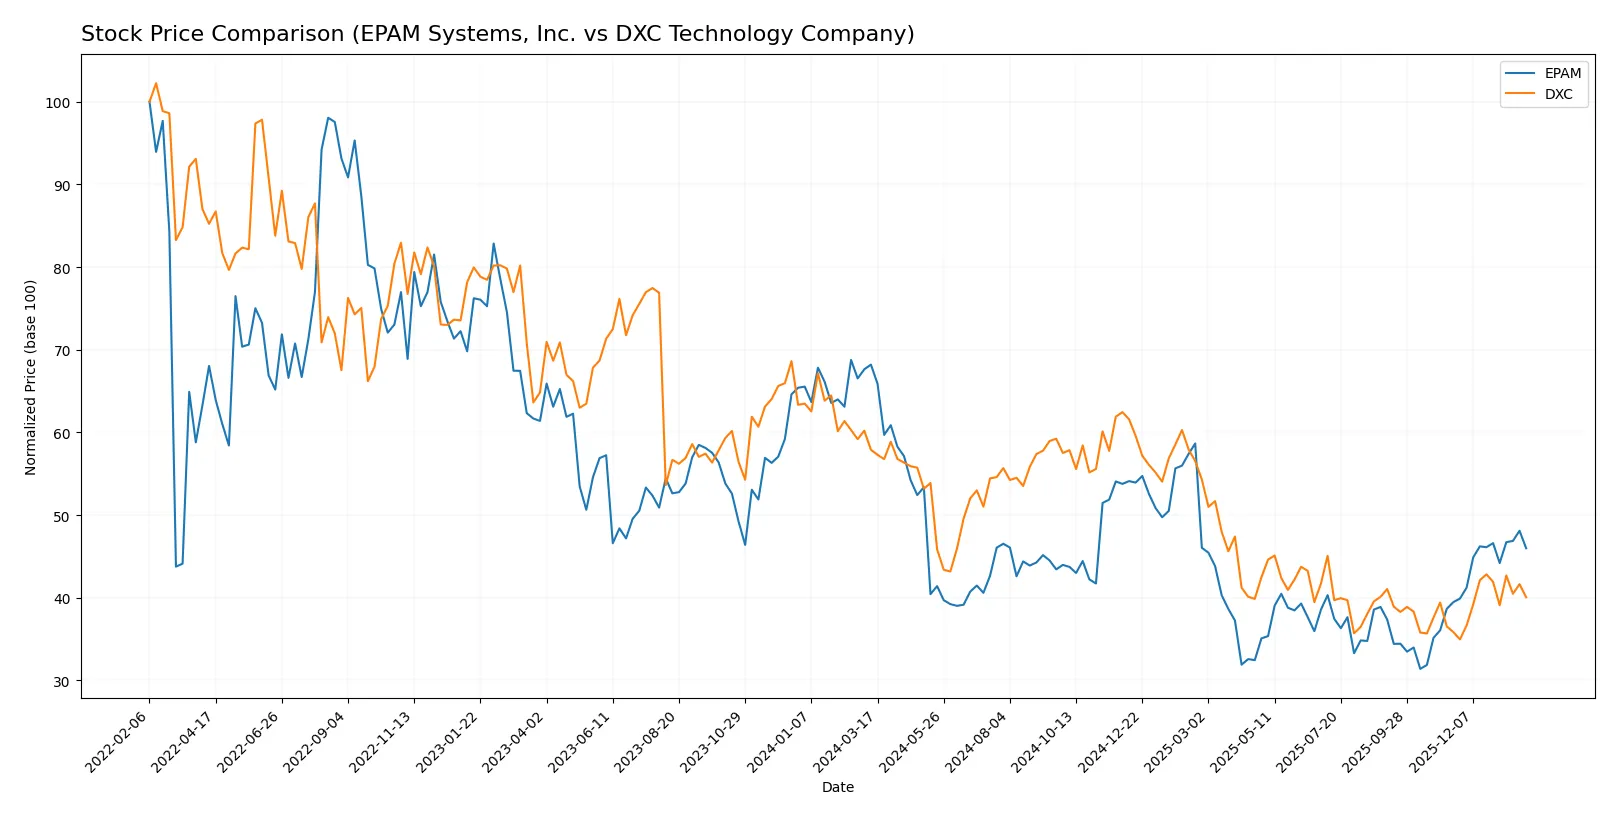
The past year shows both EPAM Systems and DXC Technology in a bearish trend, with notable price declines but recent recoveries in late 2025 into early 2026.
Trend Comparison
EPAM Systems’ stock fell 32.58% over the past year, marking a bearish trend with accelerating decline and high volatility. It recently rebounded 16.52% from November 2025 to February 2026.
DXC Technology’s stock dropped 30.82% in the same period, also bearish with accelerating losses but much lower volatility. It gained 11.77% in the recent months ending February 2026.
EPAM’s larger overall decline contrasts with its stronger recent rebound and higher buyer dominance, delivering a more volatile but relatively improved market performance versus DXC.
Target Prices
Analysts present a clear consensus on target prices for EPAM Systems and DXC Technology.
| Company | Target Low | Target High | Consensus |
|---|---|---|---|
| EPAM Systems, Inc. | 175 | 247 | 214 |
| DXC Technology Company | 13 | 14 | 13.5 |
The target consensus for EPAM at $214 slightly exceeds the current price of $208.6, indicating modest upside potential. DXC’s consensus target of $13.5 is just below its current price of $14.43, suggesting limited near-term growth expectations.

Don’t Let Luck Decide Your Entry Point
Optimize your entry points with our advanced ProRealTime indicators. You’ll get efficient buy signals with precise price targets for maximum performance. Start outperforming now!
How do institutions grade them?
The institutional grades for EPAM Systems, Inc. and DXC Technology Company are as follows:
EPAM Systems, Inc. Grades
Here are the latest grades from major financial institutions for EPAM Systems, Inc.:
| Grading Company | Action | New Grade | Date |
|---|---|---|---|
| Citigroup | Maintain | Neutral | 2026-01-29 |
| Wells Fargo | Maintain | Overweight | 2026-01-14 |
| TD Cowen | Maintain | Buy | 2026-01-09 |
| Mizuho | Maintain | Outperform | 2025-11-11 |
| JP Morgan | Maintain | Overweight | 2025-11-07 |
| Morgan Stanley | Maintain | Equal Weight | 2025-09-09 |
| JP Morgan | Maintain | Overweight | 2025-08-20 |
| Barclays | Maintain | Overweight | 2025-05-12 |
| Needham | Maintain | Buy | 2025-05-09 |
| Piper Sandler | Maintain | Neutral | 2025-05-09 |
DXC Technology Company Grades
Below are recent institutional grades for DXC Technology Company:
| Grading Company | Action | New Grade | Date |
|---|---|---|---|
| Stifel | Maintain | Hold | 2025-10-31 |
| JP Morgan | Maintain | Underweight | 2025-08-20 |
| Morgan Stanley | Maintain | Equal Weight | 2025-08-01 |
| RBC Capital | Maintain | Sector Perform | 2025-08-01 |
| JP Morgan | Maintain | Underweight | 2025-05-21 |
| RBC Capital | Maintain | Sector Perform | 2025-05-15 |
| BMO Capital | Maintain | Market Perform | 2025-05-15 |
| Morgan Stanley | Maintain | Equal Weight | 2025-05-15 |
| Guggenheim | Maintain | Neutral | 2025-05-12 |
| Susquehanna | Maintain | Neutral | 2025-04-23 |
Which company has the best grades?
EPAM Systems holds consistently higher grades, including multiple Buy and Overweight ratings. DXC Technology’s grades cluster around Hold, Neutral, and Underweight. This suggests EPAM is favored by analysts, potentially impacting investor confidence and valuation positively relative to DXC.
Risks specific to each company
The following categories identify critical pressure points and systemic threats facing EPAM Systems, Inc. and DXC Technology Company in the 2026 market environment:
1. Market & Competition
EPAM Systems, Inc.
- Faces intense competition in digital engineering and software services with high innovation demands.
DXC Technology Company
- Competes in legacy IT services with pressure to transform rapidly amid cloud and automation trends.
2. Capital Structure & Debt
EPAM Systems, Inc.
- Maintains a very low debt-to-equity ratio (0.04), ensuring financial flexibility and low leverage risk.
DXC Technology Company
- Carries high debt-to-equity (1.41), increasing financial risk and interest burden in volatile markets.
3. Stock Volatility
EPAM Systems, Inc.
- Exhibits high beta (1.727), implying greater stock price swings relative to the market.
DXC Technology Company
- Has moderate beta (1.045), indicating more stable stock price behavior.
4. Regulatory & Legal
EPAM Systems, Inc.
- Subject to global data protection and IT outsourcing regulations, requiring continuous compliance investment.
DXC Technology Company
- Faces regulatory scrutiny in multiple jurisdictions for IT infrastructure and security services.
5. Supply Chain & Operations
EPAM Systems, Inc.
- Relies heavily on skilled global IT talent and cloud infrastructure, vulnerable to talent shortages.
DXC Technology Company
- Operations depend on legacy system integrations and vendor management, exposing it to operational disruptions.
6. ESG & Climate Transition
EPAM Systems, Inc.
- Increasing pressure to integrate ESG principles into digital innovation and sustainability solutions.
DXC Technology Company
- Faces challenges in modernizing IT assets to meet climate-related regulations and reduce carbon footprint.
7. Geopolitical Exposure
EPAM Systems, Inc.
- Exposure to geopolitical risks in key Eastern European delivery centers amid global tensions.
DXC Technology Company
- Broad geographic footprint exposes it to trade restrictions and regulatory changes across continents.
Which company shows a better risk-adjusted profile?
EPAM’s dominant risk is its high stock volatility and comparatively unfavorable ROIC versus WACC, signaling capital allocation challenges. DXC’s biggest risk stems from its heavy leverage and operational dependency on legacy systems, which constrain agility. Despite EPAM’s valuation premium and volatility, its low debt and strong liquidity underpin a better risk-adjusted profile. DXC’s distressed Altman Z-score highlights financial distress risk, despite a favorable valuation. I’m particularly concerned by DXC’s Altman Z-score of 1.17 placing it in the distress zone, contrasting with EPAM’s safe zone score near 9. This gap reflects stronger balance sheet resilience for EPAM in 2026.
Final Verdict: Which stock to choose?
EPAM Systems stands out as a cash-generative powerhouse with robust liquidity and operational efficiency. Its ability to maintain a strong current ratio and minimal debt underpins financial resilience. However, its declining ROIC below WACC signals value destruction—a point of vigilance. EPAM suits portfolios aiming for aggressive growth with tolerance for cyclical risks.
DXC Technology’s strategic moat lies in its attractive valuation and disciplined capital structure, reflected in a favorable WACC and low price multiples. It offers greater safety relative to EPAM, despite weaker profitability and ongoing operational challenges. DXC fits well within GARP (Growth at a Reasonable Price) portfolios seeking stability amid turnaround potential.
If you prioritize growth backed by strong cash flow and can absorb valuation premium, EPAM is the compelling choice due to its efficiency and scale. However, if you seek better valuation discipline and relative stability with a cautious growth tilt, DXC offers a more conservative profile. Both present analytical scenarios tailored to distinct investor appetites amid challenging sector dynamics.
Disclaimer: Investment carries a risk of loss of initial capital. The past performance is not a reliable indicator of future results. Be sure to understand risks before making an investment decision.
Go Further
I encourage you to read the complete analyses of EPAM Systems, Inc. and DXC Technology Company to enhance your investment decisions: