Home > Comparison > Basic Materials > SHW vs DD
The strategic rivalry between The Sherwin-Williams Company and DuPont de Nemours, Inc. shapes the specialty chemicals sector’s future. Sherwin-Williams operates as a capital-intensive coatings giant with a broad product portfolio, while DuPont focuses on technology-driven materials and innovative solutions. This head-to-head pits industrial scale against advanced R&D. This analysis will determine which corporate path offers superior risk-adjusted returns for a diversified portfolio in 2026.
Table of contents
Companies Overview
The Sherwin-Williams Company and DuPont de Nemours, Inc. are heavyweight players in the specialty chemicals sector, shaping global industrial and consumer markets.
The Sherwin-Williams Company: Leading Paints and Coatings Innovator
The Sherwin-Williams Company dominates the architectural and industrial coatings market. It generates revenue through diverse segments including Americas Group and Performance Coatings, supplying paints, coatings, and related products. In 2026, it emphasizes expanding its retail footprint and enhancing product innovation to sustain its competitive advantage and global market reach.
DuPont de Nemours, Inc.: Advanced Materials and Solutions Provider
DuPont de Nemours, Inc. focuses on technology-driven materials and specialty chemicals. Its revenue stems from Electronics & Industrial, Mobility & Materials, and Water & Protection segments, delivering materials for semiconductors, mobility, and safety markets. The company’s 2026 strategy centers on advancing high-performance materials and integrated systems across critical industrial applications.
Strategic Collision: Similarities & Divergences
Both companies excel in specialty chemicals but diverge in their business philosophies: Sherwin-Williams leans on a broad retail-driven model, while DuPont targets high-tech, industrial applications. Their primary battleground lies in specialty coatings and materials innovation. Investors will find Sherwin-Williams offers scale and retail dominance, whereas DuPont presents a focused, technology-centric growth profile.
Income Statement Comparison
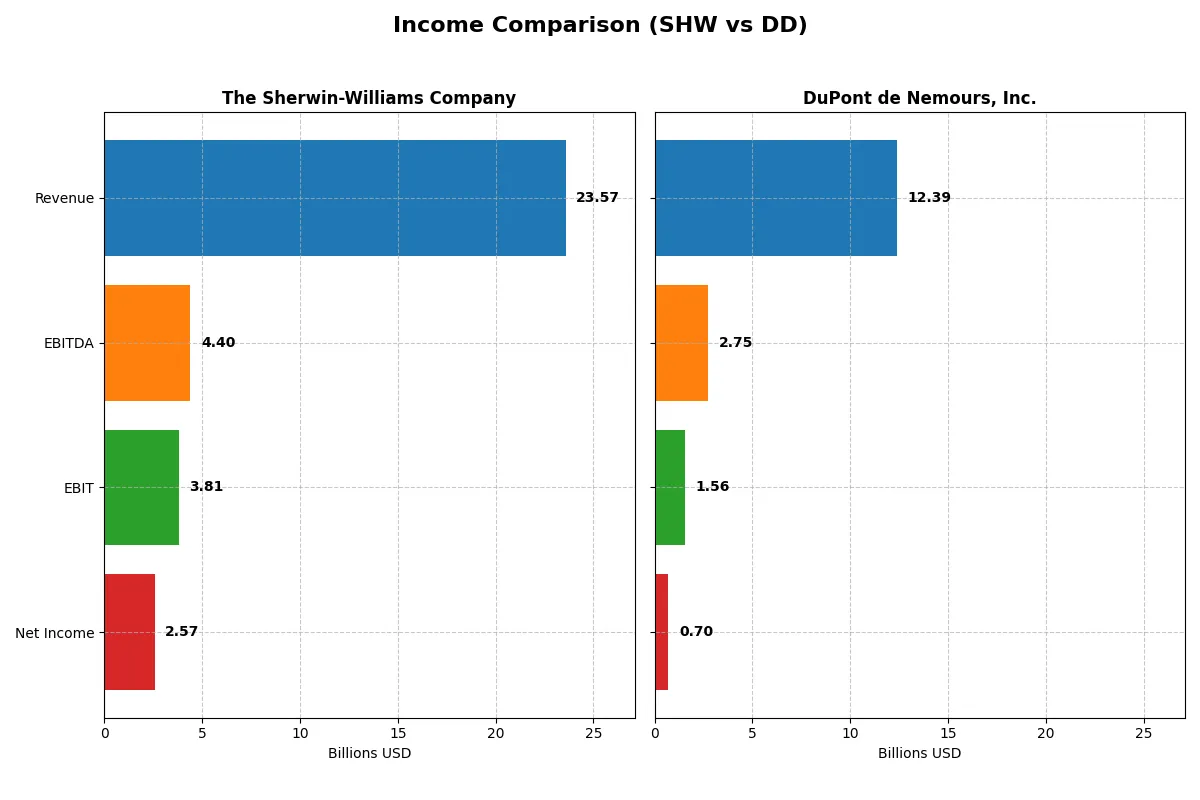
This data dissects the core profitability and scalability of both corporate engines to reveal who dominates the bottom line:
| Metric | The Sherwin-Williams Company (SHW) | DuPont de Nemours, Inc. (DD) |
|---|---|---|
| Revenue | 23.6B | 12.4B |
| Cost of Revenue | 12.0B | 8.5B |
| Operating Expenses | 7.7B | 2.1B |
| Gross Profit | 11.5B | 3.9B |
| EBITDA | 4.4B | 2.8B |
| EBIT | 3.8B | 1.6B |
| Interest Expense | 469M | 366M |
| Net Income | 2.6B | 703M |
| EPS | 10.38 | 1.68 |
| Fiscal Year | 2025 | 2024 |
Income Statement Analysis: The Bottom-Line Duel
This income statement comparison reveals the true efficiency and profitability of two leading chemical industry players.
The Sherwin-Williams Company Analysis
Sherwin-Williams shows steady revenue growth, reaching $23.6B in 2025 with net income of $2.57B. Its gross margin holds strong near 49%, and net margin remains healthy at 10.9%. Despite slight recent declines in EBIT and net margin growth, the company exhibits solid overall momentum and operational efficiency.
DuPont de Nemours, Inc. Analysis
DuPont posted $12.4B revenue in 2024, with net income at $703M. Its gross margin stands at 31.6%, while net margin lags at 5.7%. However, DuPont displays robust recent improvements, with a 73% EBIT growth and nearly 79% EPS growth year-over-year, signaling accelerating profitability after prior volatility.
Margin Power vs. Growth Momentum
Sherwin-Williams leads in scale and margin quality, delivering consistent profits and expanding margins over five years. DuPont, though smaller with thinner margins, shows impressive recent earnings acceleration and margin expansion. Sherwin-Williams appeals to investors favoring stable, efficient earnings; DuPont suits those chasing high growth potential amid greater volatility.
Financial Ratios Comparison
These vital ratios act as a diagnostic tool to expose the underlying fiscal health, valuation premiums, and capital efficiency of the companies compared below:
| Ratios | The Sherwin-Williams Company (SHW) | DuPont de Nemours, Inc. (DD) |
|---|---|---|
| ROE | 55.9% | 3.0% |
| ROIC | 15.2% | 3.5% |
| P/E | 31.1 | 19.0 |
| P/B | 17.4 | 0.57 |
| Current Ratio | 0.87 | 1.33 |
| Quick Ratio | 0.53 | 0.88 |
| D/E | 2.81 | 0.31 |
| Debt-to-Assets | 50.0% | 19.6% |
| Interest Coverage | 8.1x | 5.0x |
| Asset Turnover | 0.91 | 0.34 |
| Fixed Asset Turnover | 3.84 | 2.15 |
| Payout Ratio | 30.3% | 90.3% |
| Dividend Yield | 0.98% | 4.75% |
| Fiscal Year | 2025 | 2024 |
Efficiency & Valuation Duel: The Vital Signs
Ratios act as a company’s DNA, uncovering hidden risks and operational strengths essential for investment insight.
The Sherwin-Williams Company
Sherwin-Williams posts a robust ROE of 55.86% and a net margin of 10.9%, signaling strong profitability. However, its P/E ratio of 31.08 and P/B of 17.36 suggest the stock is expensive and stretched. Shareholders receive a modest 0.98% dividend yield, reflecting a preference for cautious capital return amid operational strength.
DuPont de Nemours, Inc.
DuPont shows a modest ROE of 3.01% and a net margin of 5.68%, highlighting limited profitability. Its P/E ratio near 19.02 and very low P/B of 0.57 indicate the stock is reasonably valued and potentially undervalued. A healthy 4.75% dividend yield rewards shareholders, balancing slower growth with steady income.
Premium Valuation vs. Income Stability
Sherwin-Williams commands a premium valuation backed by strong returns but carries balance sheet risks. DuPont offers a more conservative valuation with consistent dividends and lower leverage. Investors seeking growth might lean toward Sherwin-Williams, while income-focused investors may prefer DuPont’s stable yield and valuation profile.
Which one offers the Superior Shareholder Reward?
I see Sherwin-Williams (SHW) offers a modest dividend yield near 1% with a sustainable payout ratio around 30%. Its steady buyback program supports total returns. DuPont (DD) delivers a much higher 4.7% yield but pays out over 90% of earnings, risking dividend sustainability. DD’s buybacks are less aggressive. SHW’s balanced distribution and strong cash flow coverage make it a safer long-term reward. I conclude SHW offers a superior total return profile in 2026 due to sustainable dividends and disciplined buybacks.
Comparative Score Analysis: The Strategic Profile
The radar chart reveals the fundamental DNA and trade-offs of The Sherwin-Williams Company and DuPont de Nemours, Inc., highlighting their distinct financial strengths and weaknesses:
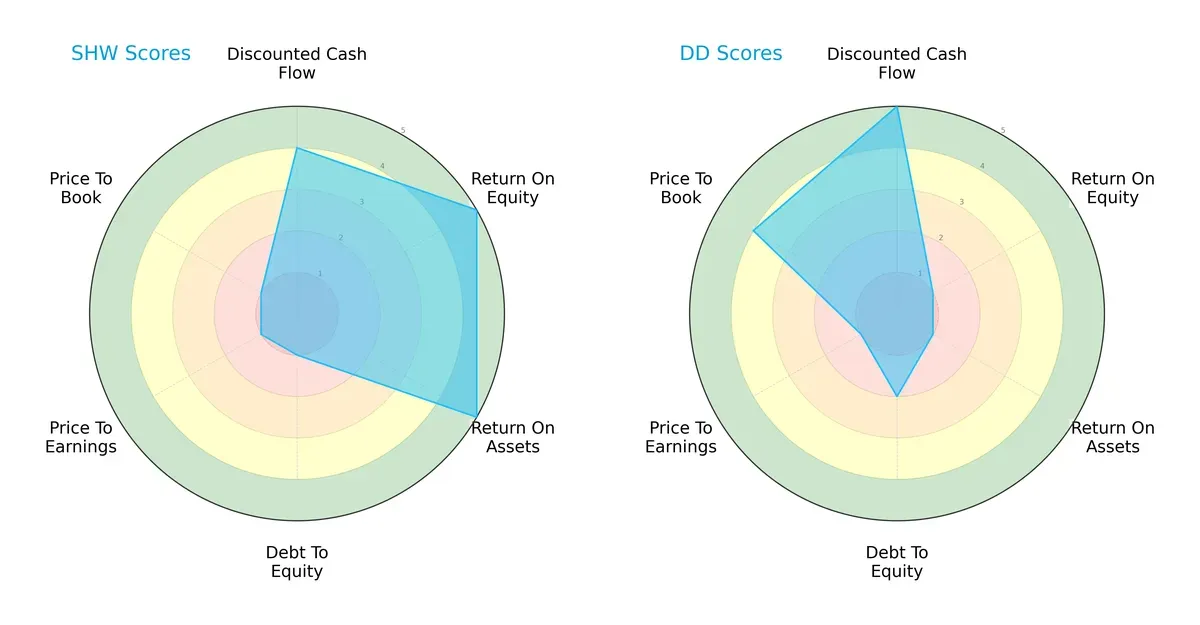
Sherwin-Williams boasts strong profitability with top ROE and ROA scores (5 each), while DuPont excels in discounted cash flow valuation (score 5) and price-to-book attractiveness (score 4). However, Sherwin-Williams carries high financial risk, reflected by a weak debt-to-equity score (1). DuPont shows a more balanced leverage profile but suffers from poor profitability scores (ROE 1, ROA 1). Overall, Sherwin-Williams relies on operational efficiency, while DuPont leverages valuation factors.
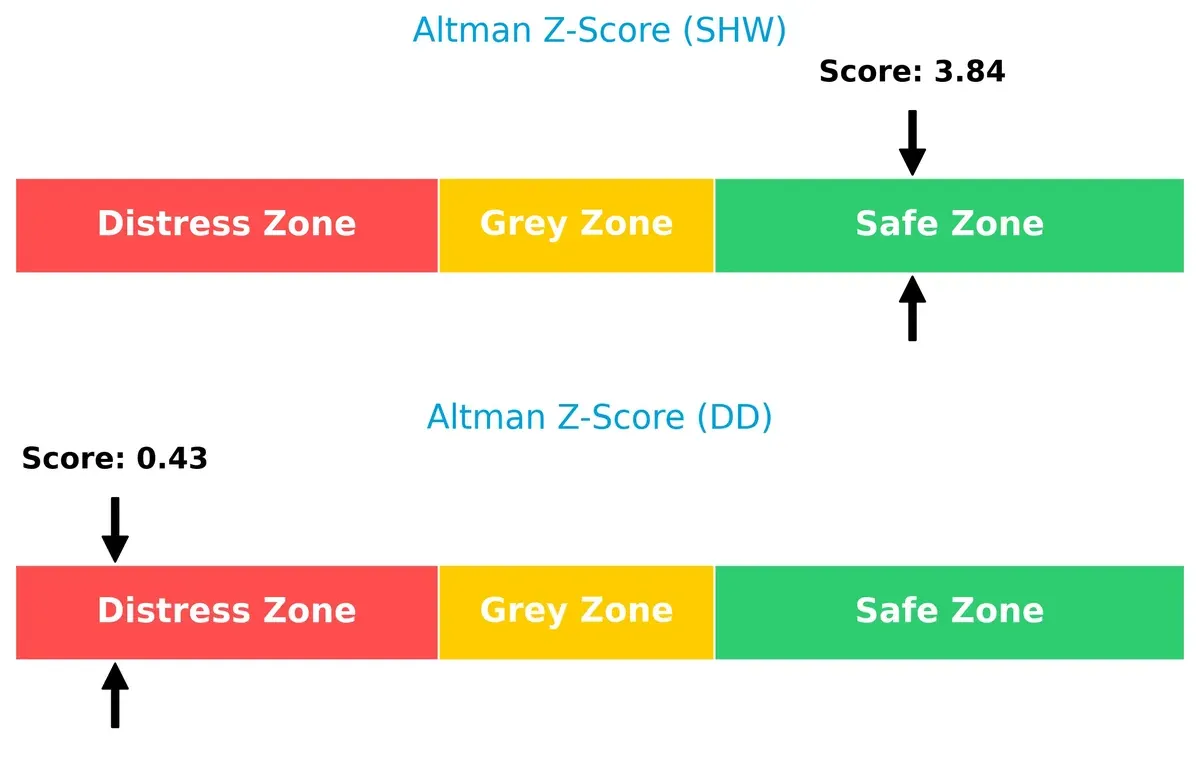
Bankruptcy Risk: Solvency Showdown
Sherwin-Williams’s Altman Z-Score of 3.84 places it safely above distress, signaling strong long-term survival potential. DuPont’s 0.43 score signals high bankruptcy risk in this cycle:
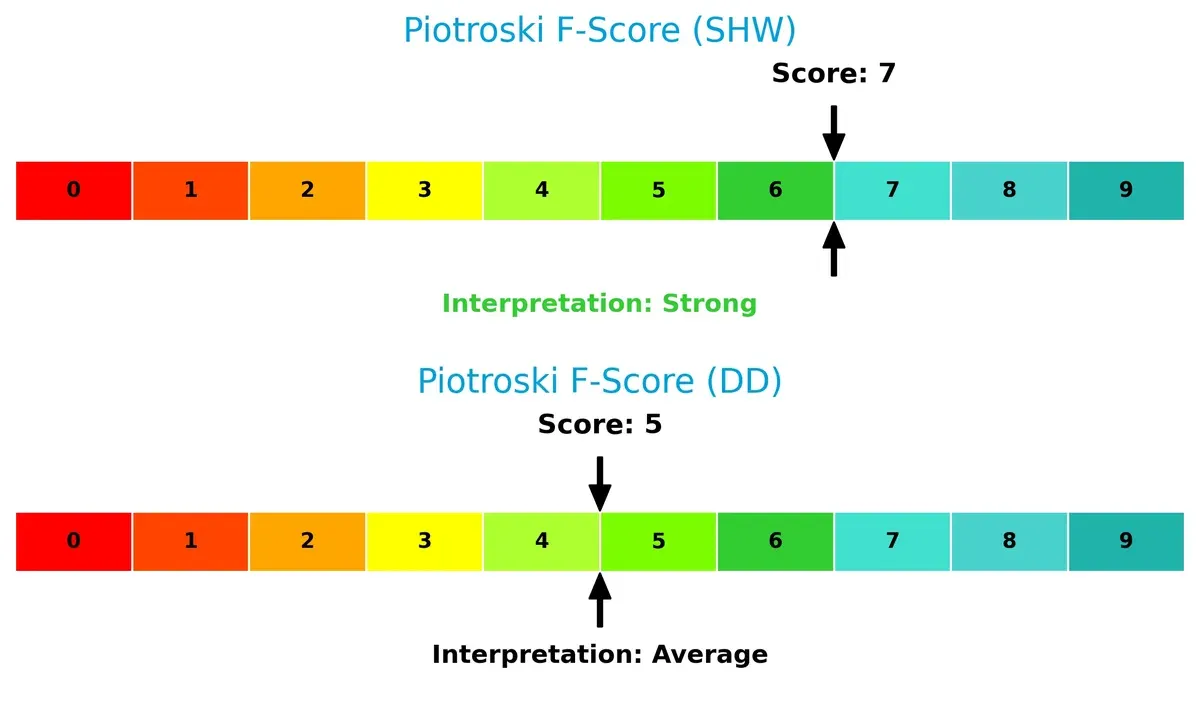
Financial Health: Quality of Operations
Sherwin-Williams scores a robust 7 on the Piotroski F-Score, indicating strong financial health and operational quality. DuPont’s 5 signals average health with some internal red flags compared to its peer:
How are the two companies positioned?
This section dissects the operational DNA of SHW and DD by comparing their revenue distribution by segment and internal dynamics. The goal is to confront their economic moats to identify the most resilient competitive advantage today.
Revenue Segmentation: The Strategic Mix
This visual comparison dissects how The Sherwin-Williams Company and DuPont de Nemours, Inc. diversify income streams and where their primary sector bets lie:
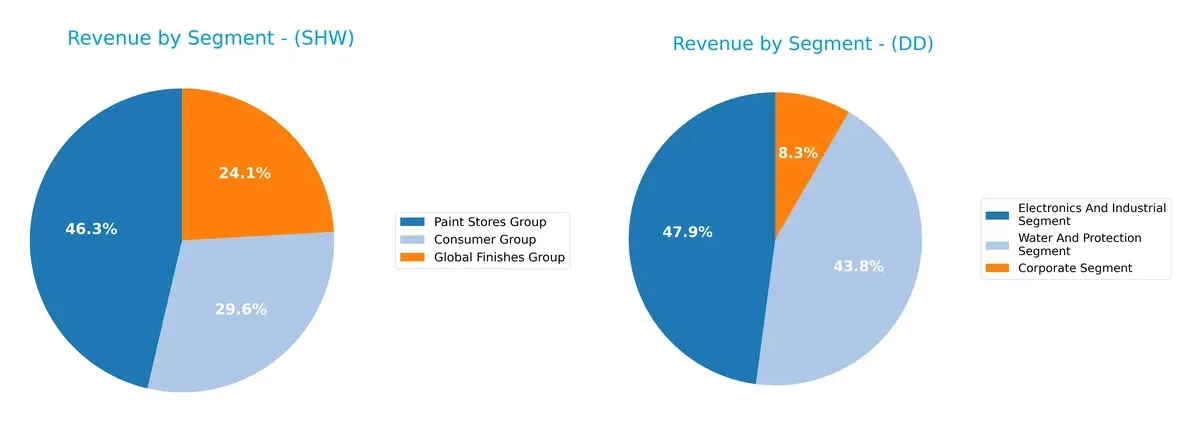
Sherwin-Williams anchors revenue in its Paint Stores Group with $13.2B, dwarfing its Consumer Group ($8.4B) and Global Finishes Group ($6.9B). This concentration signals strong retail ecosystem control but exposes it to sector-specific risks. DuPont shows a balanced mix, with Electronics & Industrial ($5.9B) and Water & Protection ($5.4B) segments nearly equal. Its diversified portfolio mitigates risk but may dilute focus compared to Sherwin-Williams’ infrastructure dominance.
Strengths and Weaknesses Comparison
This table compares the Strengths and Weaknesses of Sherwin-Williams and DuPont de Nemours based on diversification, profitability, financials, innovation, global presence, and market share:
SHW Strengths
- Strong profitability with 10.9% net margin and 55.86% ROE
- Favorable ROIC at 15.21% above WACC
- High fixed asset turnover at 3.84
- Leading Paint Stores Group revenue of 13.2B
DD Strengths
- Favorable WACC at 7.78% supports capital efficiency
- Low debt-to-equity ratio of 0.31 and debt to assets at 19.57%
- Diverse product segments including Electronics and Water Protection
- Significant global presence across Asia Pacific, U.S., EMEA, Latin America
SHW Weaknesses
- Unfavorable liquidity ratios with current ratio 0.87 and quick ratio 0.53
- High leverage with debt-to-equity of 2.81
- Unfavorable valuation multiples: PE 31.08 and PB 17.36
- Low dividend yield of 0.98%
DD Weaknesses
- Low profitability metrics: ROE 3.01% and ROIC 3.54% below WACC
- Weak asset turnover at 0.34 limits efficiency
- Neutral interest coverage at 4.26
- Market segments and geographic revenue highly variable
Sherwin-Williams excels in profitability and asset utilization but faces liquidity and leverage risks. DuPont shows financial prudence with low leverage and global diversification but struggles with profitability and operational efficiency. Both companies’ profiles suggest contrasting strategic focuses.
The Moat Duel: Analyzing Competitive Defensibility
A structural moat is the only reliable barrier protecting long-term profits from relentless competition erosion. Let’s dissect two chemical giants’ moats:
The Sherwin-Williams Company: Dominant Switching Costs
Sherwin-Williams leverages high switching costs through exclusive distribution and trusted brands, reflected in a strong 6.3% ROIC premium over WACC. Its stable margins and expanding geographic footprint deepen this moat in 2026.
DuPont de Nemours, Inc.: Innovation-Driven Intangible Assets
DuPont’s moat stems from proprietary technology and patents, unlike Sherwin’s customer lock-in. Despite a negative ROIC spread, improving profitability signals potential moat strengthening via new materials in emerging markets.
Moat Strength Clash: Switching Costs vs. Patent Innovation
Sherwin-Williams holds the wider moat with durable value creation and margin resilience. DuPont shows promise but currently struggles to convert innovation into sustained economic profits. Sherwin dominates moat defense today.
Which stock offers better returns?
The past year shows distinct price momentum and trading volume shifts for The Sherwin-Williams Company and DuPont de Nemours, Inc., reflecting varied investor confidence and market reactions.
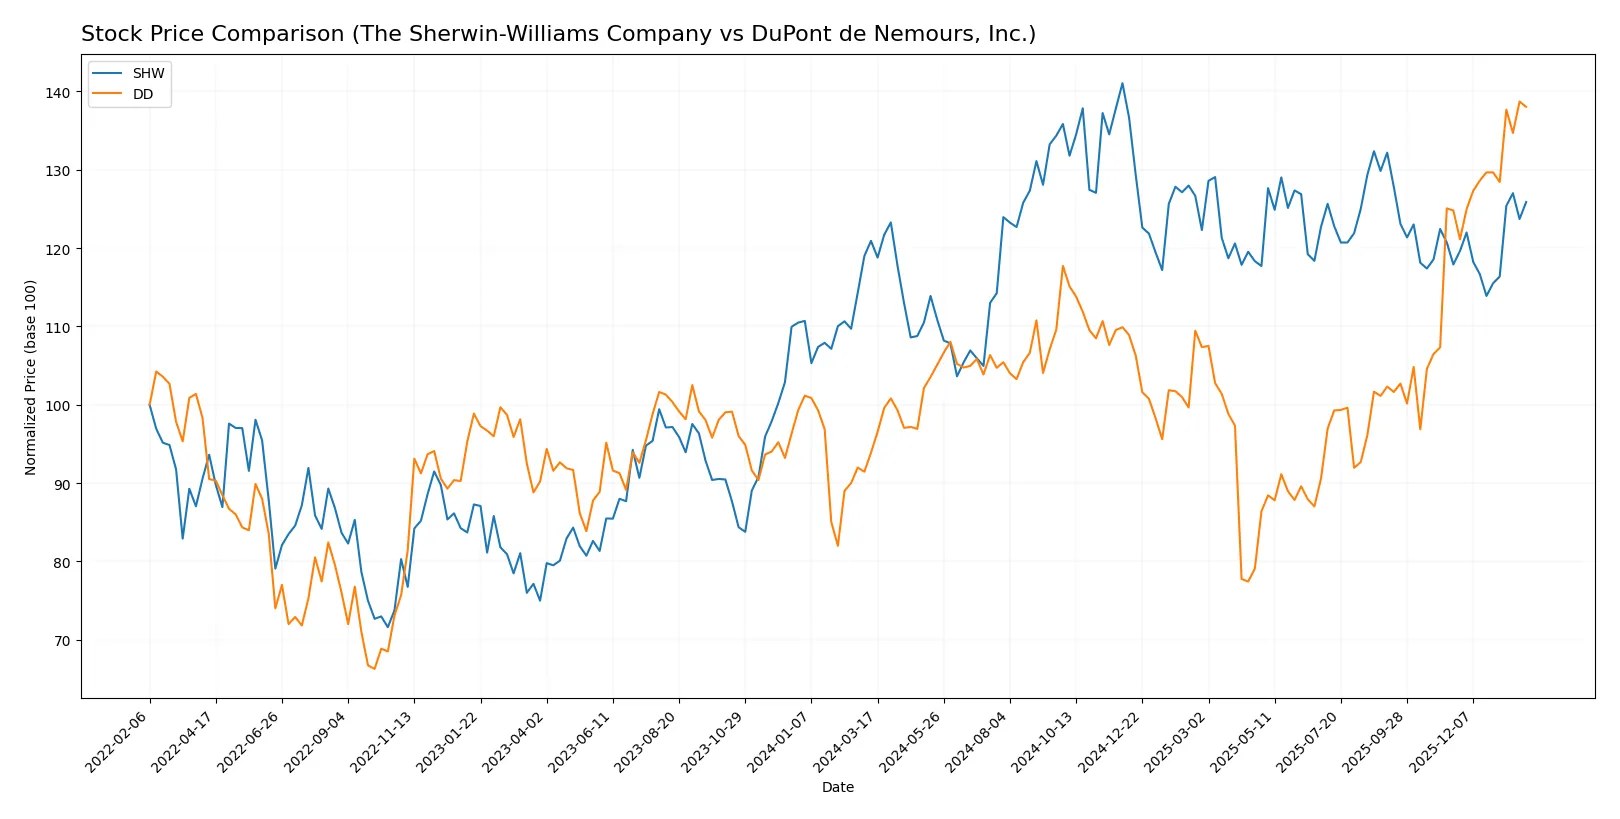
Trend Comparison
The Sherwin-Williams Company’s stock gained 4.09% over the past 12 months, indicating a bullish trend with accelerating momentum and a notable high of 397.4. Volatility remains elevated at a 22.46 standard deviation.
DuPont de Nemours, Inc. recorded a robust 47.04% price increase over the last year, also bullish with accelerating gains. Price volatility is moderate, with a 3.96 standard deviation and a peak price of 44.14.
DuPont outperformed Sherwin-Williams significantly, delivering the highest market returns despite lower trading volume and a decelerating recent trend slope.
Target Prices
Analysts present a mixed but insightful target consensus for Sherwin-Williams and DuPont de Nemours.
| Company | Target Low | Target High | Consensus |
|---|---|---|---|
| The Sherwin-Williams Company | 371 | 420 | 393.5 |
| DuPont de Nemours, Inc. | 44 | 107 | 55.5 |
Sherwin-Williams’ target consensus of 393.5 exceeds its current price of 354.64, suggesting upside potential. DuPont’s consensus at 55.5 also implies upside from its current 43.92, though with wider price uncertainty.

Don’t Let Luck Decide Your Entry Point
Optimize your entry points with our advanced ProRealTime indicators. You’ll get efficient buy signals with precise price targets for maximum performance. Start outperforming now!
How do institutions grade them?
The Sherwin-Williams Company Grades
Here are the latest institutional grades for Sherwin-Williams from major firms:
| Grading Company | Action | New Grade | Date |
|---|---|---|---|
| RBC Capital | maintain | Outperform | 2026-01-30 |
| UBS | maintain | Buy | 2026-01-12 |
| Mizuho | maintain | Outperform | 2025-12-18 |
| Citigroup | upgrade | Buy | 2025-12-18 |
| Citigroup | maintain | Neutral | 2025-10-30 |
| RBC Capital | maintain | Outperform | 2025-10-29 |
| Wells Fargo | maintain | Overweight | 2025-10-29 |
| JP Morgan | maintain | Overweight | 2025-10-29 |
| UBS | maintain | Buy | 2025-10-29 |
| B of A Securities | maintain | Neutral | 2025-10-14 |
DuPont de Nemours, Inc. Grades
Below are the recent grades assigned to DuPont by reputable institutions:
| Grading Company | Action | New Grade | Date |
|---|---|---|---|
| Citigroup | maintain | Buy | 2026-01-21 |
| JP Morgan | maintain | Overweight | 2026-01-16 |
| Keybanc | maintain | Overweight | 2026-01-09 |
| UBS | maintain | Buy | 2026-01-07 |
| Mizuho | maintain | Outperform | 2025-12-18 |
| RBC Capital | maintain | Outperform | 2025-11-18 |
| Wells Fargo | maintain | Overweight | 2025-11-07 |
| UBS | maintain | Buy | 2025-11-07 |
| Keybanc | maintain | Overweight | 2025-11-07 |
| UBS | maintain | Buy | 2025-11-05 |
Which company has the best grades?
Both companies maintain strong institutional support with mostly positive grades. Sherwin-Williams has multiple “Outperform” and “Buy” grades, including a recent upgrade, signaling growing confidence. DuPont also holds consistently positive grades, mainly “Buy” and “Overweight.” Investors may view Sherwin-Williams’ upgrades as a sign of increasing momentum relative to DuPont.
Risks specific to each company
The following categories identify the critical pressure points and systemic threats facing both firms in the 2026 market environment:
1. Market & Competition
The Sherwin-Williams Company
- Dominates specialty coatings with strong brand presence but faces premium valuation risks.
DuPont de Nemours, Inc.
- Operates diverse chemical segments with moderate margins, challenged by slower growth and intense innovation competition.
2. Capital Structure & Debt
The Sherwin-Williams Company
- High debt-to-equity ratio (2.81) signals leverage risk despite solid interest coverage.
DuPont de Nemours, Inc.
- Conservative leverage profile with low debt-to-equity (0.31) reduces financial risk.
3. Stock Volatility
The Sherwin-Williams Company
- Beta at 1.26 indicates elevated sensitivity to market swings.
DuPont de Nemours, Inc.
- Lower beta (1.11) suggests comparatively stable stock price behavior.
4. Regulatory & Legal
The Sherwin-Williams Company
- Subject to environmental regulations impacting coatings production costs.
DuPont de Nemours, Inc.
- Faces stringent compliance demands across chemical and materials segments globally.
5. Supply Chain & Operations
The Sherwin-Williams Company
- Large store network (5,000 locations) creates operational complexity but enhances market reach.
DuPont de Nemours, Inc.
- Complex global supply chains in advanced materials increase exposure to disruption risks.
6. ESG & Climate Transition
The Sherwin-Williams Company
- Focus on sustainable coatings, yet faces pressure to reduce carbon footprint in manufacturing.
DuPont de Nemours, Inc.
- Invests in clean technologies but must manage legacy chemical risks and transition costs.
7. Geopolitical Exposure
The Sherwin-Williams Company
- Primarily North and South America focused, limiting geopolitical volatility.
DuPont de Nemours, Inc.
- Greater global footprint exposes it to trade tensions and regional instability.
Which company shows a better risk-adjusted profile?
The Sherwin-Williams Company’s highest risk is its elevated leverage, which could amplify financial stress in downturns despite strong operational efficiency. DuPont’s primary risk stems from its weak profitability and distress-level Altman Z-score, signaling bankruptcy risk. I see DuPont’s lower debt and better valuation as mitigating factors, but its financial distress is a red flag. Sherwin-Williams’ leverage risk is balanced by robust returns and a safe zone Altman score. Overall, Sherwin-Williams demonstrates a better risk-adjusted profile in 2026, supported by its strong profitability and financial stability despite valuation and liquidity concerns.
Final Verdict: Which stock to choose?
The Sherwin-Williams Company’s superpower lies in its durable competitive advantage and impressive value creation. Its robust ROIC consistently outpaces its cost of capital, fueling growing profitability. However, its low liquidity ratios pose a point of vigilance. It fits well in aggressive growth portfolios that can tolerate balance sheet leverage.
DuPont de Nemours commands a strategic moat through a strong safety profile and disciplined capital structure. Its lower debt levels and favorable valuation metrics offer relative stability compared to Sherwin-Williams. This positions DuPont as a solid candidate for investors seeking growth at a reasonable price with an emphasis on income.
If you prioritize long-term value creation with a proven moat and are comfortable with leverage, Sherwin-Williams outshines due to its superior profitability and growth durability. However, if you seek better financial stability and a more conservative risk profile, DuPont offers a compelling scenario for steady growth and income generation.
Disclaimer: Investment carries a risk of loss of initial capital. The past performance is not a reliable indicator of future results. Be sure to understand risks before making an investment decision.
Go Further
I encourage you to read the complete analyses of The Sherwin-Williams Company and DuPont de Nemours, Inc. to enhance your investment decisions: