Home > Comparison > Basic Materials > PPG vs DD
The strategic rivalry between PPG Industries, Inc. and DuPont de Nemours, Inc. shapes the specialty chemicals sector’s evolution. PPG operates as a diversified coatings and specialty materials powerhouse, while DuPont delivers technology-driven materials across electronics, mobility, and water solutions. This clash highlights a contest between broad industrial coatings expertise and focused innovation in high-tech materials. This analysis will determine which trajectory offers superior risk-adjusted returns for a diversified portfolio in Basic Materials.
Table of contents
Companies Overview
PPG Industries and DuPont de Nemours are heavyweight players in the specialty chemicals sector, shaping industrial innovation globally.
PPG Industries, Inc.: Global Leader in Coatings and Specialty Materials
PPG Industries dominates the specialty coatings market, generating revenue through diverse paints, coatings, and engineered materials worldwide. Its Performance and Industrial Coatings segments cater to automotive, aerospace, metal protection, and consumer applications. In 2026, PPG’s strategic focus centers on expanding advanced materials and digital software solutions to enhance customer service and operational efficiency.
DuPont de Nemours, Inc.: Innovator in Technology-Based Materials
DuPont de Nemours excels in technology-driven materials across electronics, mobility, and water protection sectors. Its core revenue stems from supplying advanced materials and integrated systems for semiconductor fabrication, transportation, and safety solutions. The 2026 strategy emphasizes innovation in high-performance materials and sustainability, targeting growth in semiconductor and renewable energy markets.
Strategic Collision: Similarities & Divergences
Both companies compete in specialty chemicals but diverge in philosophy: PPG emphasizes a broad coatings portfolio with digital enhancements, while DuPont pursues a technology-centric, materials science approach. Their primary battleground lies in advanced materials for industrial and electronics sectors. Investors face distinct profiles: PPG offers stability through diversified coatings; DuPont presents growth potential via cutting-edge innovations.
Income Statement Comparison
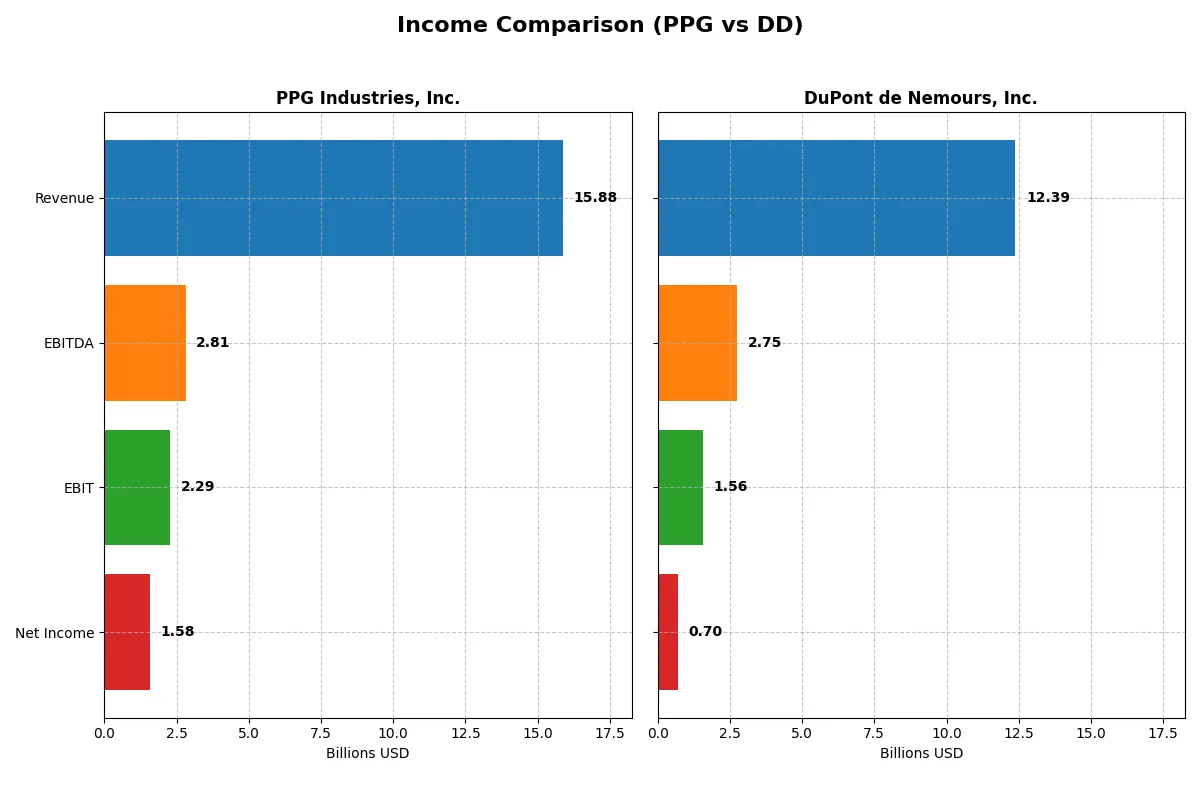
This data dissects the core profitability and scalability of both corporate engines to reveal who dominates the bottom line:
| Metric | PPG Industries, Inc. (PPG) | DuPont de Nemours, Inc. (DD) |
|---|---|---|
| Revenue | 15.9B | 12.4B |
| Cost of Revenue | 9.8B | 8.5B |
| Operating Expenses | 3.9B | 2.1B |
| Gross Profit | 6.0B | 3.9B |
| EBITDA | 2.8B | 2.8B |
| EBIT | 2.3B | 1.6B |
| Interest Expense | 241M | 366M |
| Net Income | 1.6B | 703M |
| EPS | 6.96 | 1.68 |
| Fiscal Year | 2025 | 2024 |
Income Statement Analysis: The Bottom-Line Duel
The income statement comparison reveals which company runs a more efficient and profitable operation over recent years.
PPG Industries, Inc. Analysis
PPG’s revenue slightly dipped by 0.2% in 2025, but net income surged 41%, signaling a sharp improvement in profitability. Gross margin contracts by 8.5%, yet the firm maintains a strong 38% rate, reflecting solid cost control. The net margin nears 10%, with EPS growth exceeding 45%, highlighting operational momentum and margin expansion.
DuPont de Nemours, Inc. Analysis
DuPont’s revenue grew 2.6% in 2024, alongside a 7.7% rise in gross profit, supporting steady top-line momentum. Gross margin stands at a healthy 31.6%, while net margin improves markedly to 5.7%. Net income and EPS more than doubled over the period, indicating effective margin recovery and capitalizing on operational leverage despite moderate revenue contraction overall.
Margin Strength vs. Growth Acceleration
PPG outperforms in margin quality, boasting higher gross and net margins that signal robust cost efficiency. DuPont excels in net income and EPS growth, fueled by operational leverage and marked net margin expansion. For investors, PPG’s profile suits those valuing margin stability, while DuPont appeals to growth-oriented investors chasing accelerating profitability.
Financial Ratios Comparison
These vital ratios act as a diagnostic tool to expose the underlying fiscal health, valuation premiums, and capital efficiency of the companies compared below:
| Ratios | PPG Industries, Inc. (PPG) | DuPont de Nemours, Inc. (DD) |
|---|---|---|
| ROE | -44.5% | 3.0% |
| ROIC | 43.1% | 3.5% |
| P/E | 14.7 | 19.0 |
| P/B | -6.54 | 0.57 |
| Current Ratio | 1.62 | 1.33 |
| Quick Ratio | 1.22 | 0.88 |
| D/E | -2.10 | 0.31 |
| Debt-to-Assets | 93.6% | 19.6% |
| Interest Coverage | 9.0 | 5.0 |
| Asset Turnover | 1.99 | 0.34 |
| Fixed Asset Turnover | 0 | 2.15 |
| Payout Ratio | 39.8% | 90.3% |
| Dividend yield | 2.71% | 4.75% |
| Fiscal Year | 2025 | 2024 |
Efficiency & Valuation Duel: The Vital Signs
Ratios act as the company’s DNA, exposing hidden risks and revealing true operational and financial strengths behind surface figures.
PPG Industries, Inc.
PPG displays strong operational efficiency with a high ROIC of 43.13% comfortably above its WACC of 7.85%. Its P/E ratio of 14.71 signals a fairly valued stock. Despite a negative ROE of -44.48%, PPG maintains shareholder returns via a 2.71% dividend yield, balancing reinvestment with income.
DuPont de Nemours, Inc.
DuPont posts modest profitability with an ROE of 3.01% and ROIC of 3.54%, both trailing industry norms. Its higher P/E of 19.02 suggests a stretched valuation. The company supports investors with a 4.75% dividend yield amid neutral liquidity ratios, relying less on operational efficiency.
Balanced Valuation vs. Operational Strength
PPG offers a superior operational profile with favorable capital returns and solid valuation metrics. DuPont trades at a premium but delivers weaker profitability. Investors prioritizing capital efficiency may prefer PPG, while income-focused profiles might find DuPont’s higher dividend appealing despite operational drawbacks.
Which one offers the Superior Shareholder Reward?
I find DuPont de Nemours, Inc. (DD) offers a superior shareholder reward in 2026. DD delivers a higher dividend yield near 4.7%, but with a payout ratio above 90%, signaling riskier sustainability. PPG Industries, Inc. (PPG) yields about 2.7% with a more conservative payout near 40%, preserving cash flow. PPG’s buyback activity appears restrained due to negative free cash flow per share recently, while DD shows consistent free cash flow supporting dividends and buybacks. DD’s low price-to-book ratio (~0.57) versus PPG’s negative equity reflects undervaluation, enhancing total return potential. I favor DD for a balanced income and growth profile despite higher payout risk.
Comparative Score Analysis: The Strategic Profile
The radar chart reveals the fundamental DNA and trade-offs of PPG Industries and DuPont de Nemours, highlighting their financial strengths and valuation nuances:
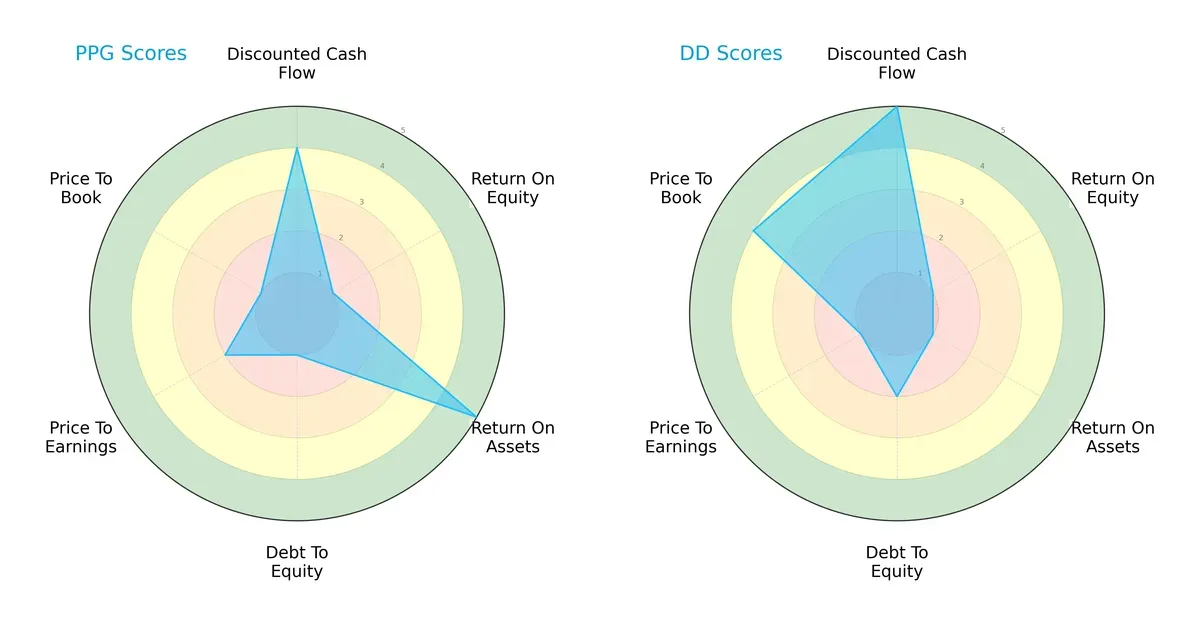
PPG displays a balanced profile with a strong ROA (5) and favorable DCF score (4), but it suffers from weak ROE (1) and poor debt management (1). DuPont leans heavily on a top-tier DCF score (5) but struggles with asset efficiency (ROA 1) and valuation metrics, indicating reliance on cash flow projections over operational strength. PPG’s profile suggests operational resilience, while DuPont’s edge depends on future cash flow optimism.
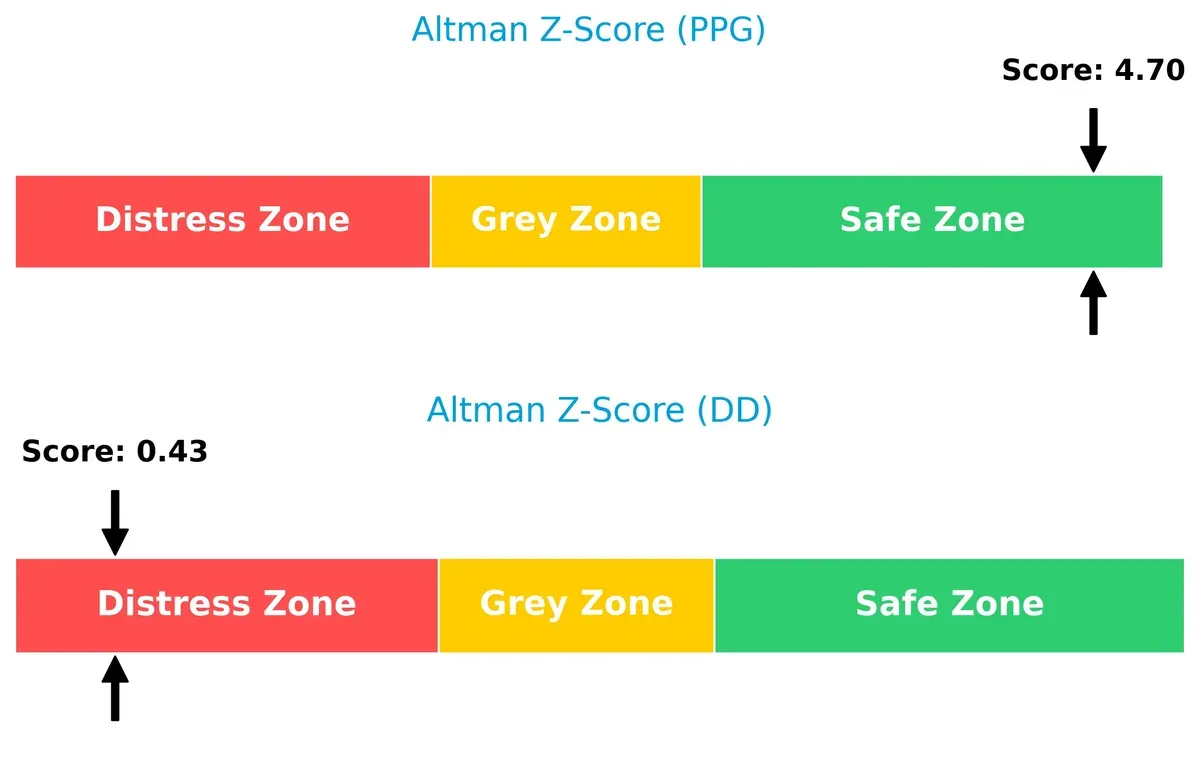
Bankruptcy Risk: Solvency Showdown
PPG’s Altman Z-Score of 4.7 places it firmly in the safe zone, contrasting sharply with DuPont’s distress zone score of 0.4, signaling heightened bankruptcy risk in this cycle:
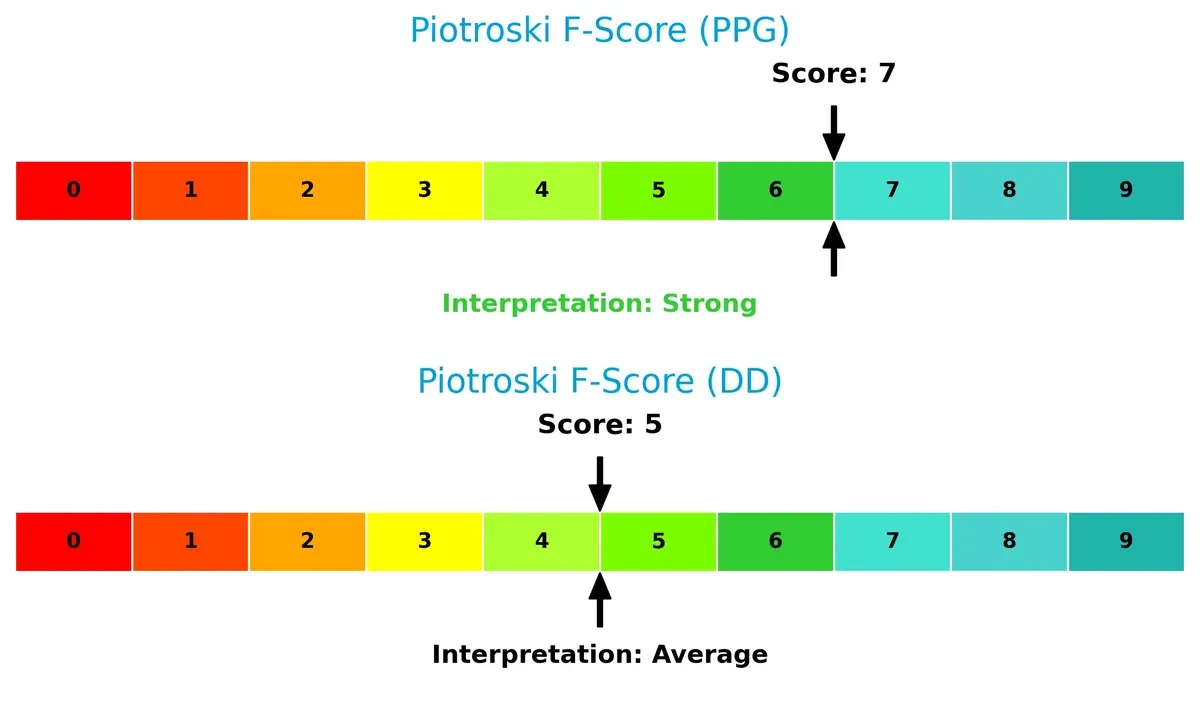
Financial Health: Quality of Operations
PPG’s Piotroski F-Score of 7 shows strong financial health, outperforming DuPont’s average score of 5, which raises caution about internal operational weaknesses:
How are the two companies positioned?
This section dissects the operational DNA of PPG and DuPont by comparing their revenue distribution and internal strengths and weaknesses. The goal is to confront their economic moats to reveal which model offers the most resilient, sustainable competitive advantage today.
Revenue Segmentation: The Strategic Mix
This visual comparison dissects how PPG Industries and DuPont de Nemours diversify their income streams and where their primary sector bets lie:
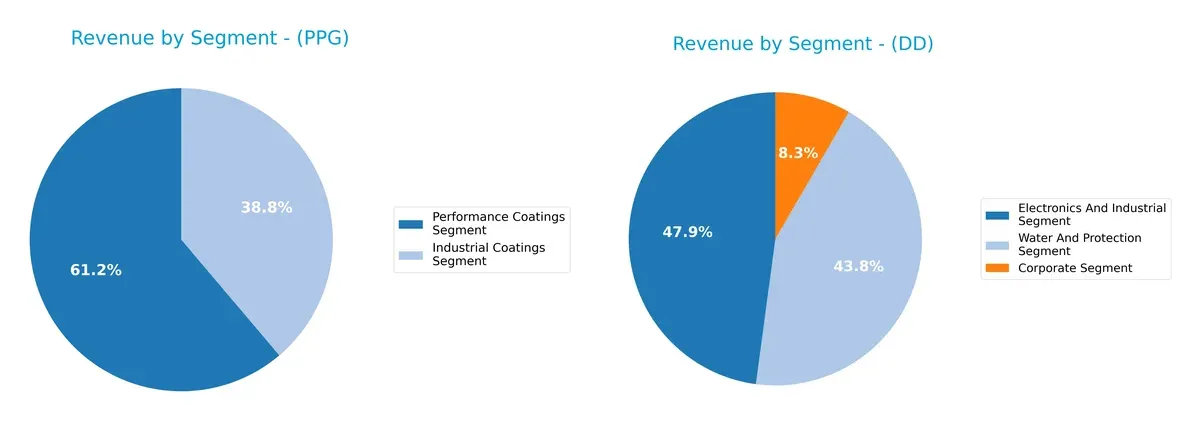
PPG Industries anchors its revenue in two segments: Performance Coatings at $11.16B and Industrial Coatings at $7.08B, showing a focused but balanced product mix. DuPont, with three sizable segments—Electronics and Industrial ($5.93B), Water and Protection ($5.42B), and Corporate ($1.03B) in 2024—exhibits broader diversification. PPG’s concentration risks contrast with DuPont’s ecosystem lock-in strategy, leveraging multiple industrial verticals for resilience.
Strengths and Weaknesses Comparison
This table compares the Strengths and Weaknesses of PPG and DuPont based on diversification, profitability, financials, innovation, global presence, and market share:
PPG Strengths
- Strong industrial and performance coatings segments with steady revenue growth
- Favorable ROIC and WACC indicating value creation
- Solid liquidity ratios and interest coverage
- Broad geographic presence across North America, EMEA, Asia Pacific
DuPont Strengths
- Diversified product segments including electronics, water, and protection
- Favorable debt-to-assets ratio lowers financial risk
- Higher dividend yield supports income investors
- Large revenue base in Asia Pacific and U.S. & Canada markets
PPG Weaknesses
- High debt-to-assets ratio signals leverage risk
- Negative ROE despite strong ROIC suggests equity inefficiency
- Fixed asset turnover at zero raises operational concerns
DuPont Weaknesses
- Low ROIC and ROE reflect weaker profitability
- Neutral current and quick ratios indicate moderate liquidity
- Unfavorable asset turnover points to lower operational efficiency
PPG’s strengths lie in operational efficiency and strong capital returns but face financial leverage risks. DuPont benefits from diversification and lower debt but struggles with profitability and asset utilization. These contrasts highlight differing strategic focuses and risk profiles.
The Moat Duel: Analyzing Competitive Defensibility
A structural moat is the only reliable shield protecting long-term profits from relentless competition erosion:
PPG Industries, Inc.: Robust Value Creator with Durable Cost Advantage
PPG’s moat stems from its cost advantage and specialized coatings portfolio. Its ROIC exceeds WACC by 35%, showing strong capital efficiency. Growing profitability suggests expanding barriers in 2026 amid new industrial coatings.
DuPont de Nemours, Inc.: Innovation-Driven Moat with Profitability Challenges
DuPont leverages technology and innovation as its moat, contrasting PPG’s cost edge. Despite improving ROIC trends, it still sheds value as ROIC lags below WACC. Expansion in electronics materials could extend its competitive reach.
Cost Leadership vs. Innovation Edge in Specialty Chemicals
PPG’s wider moat emerges from consistent value creation and superior capital returns. DuPont shows promise but must convert innovation into sustained profits. PPG is better positioned to defend market share through operational excellence.
Which stock offers better returns?
The past year reveals stark contrasts in price action and trading dynamics between PPG Industries and DuPont de Nemours, marked by divergent trends and volume behaviors.
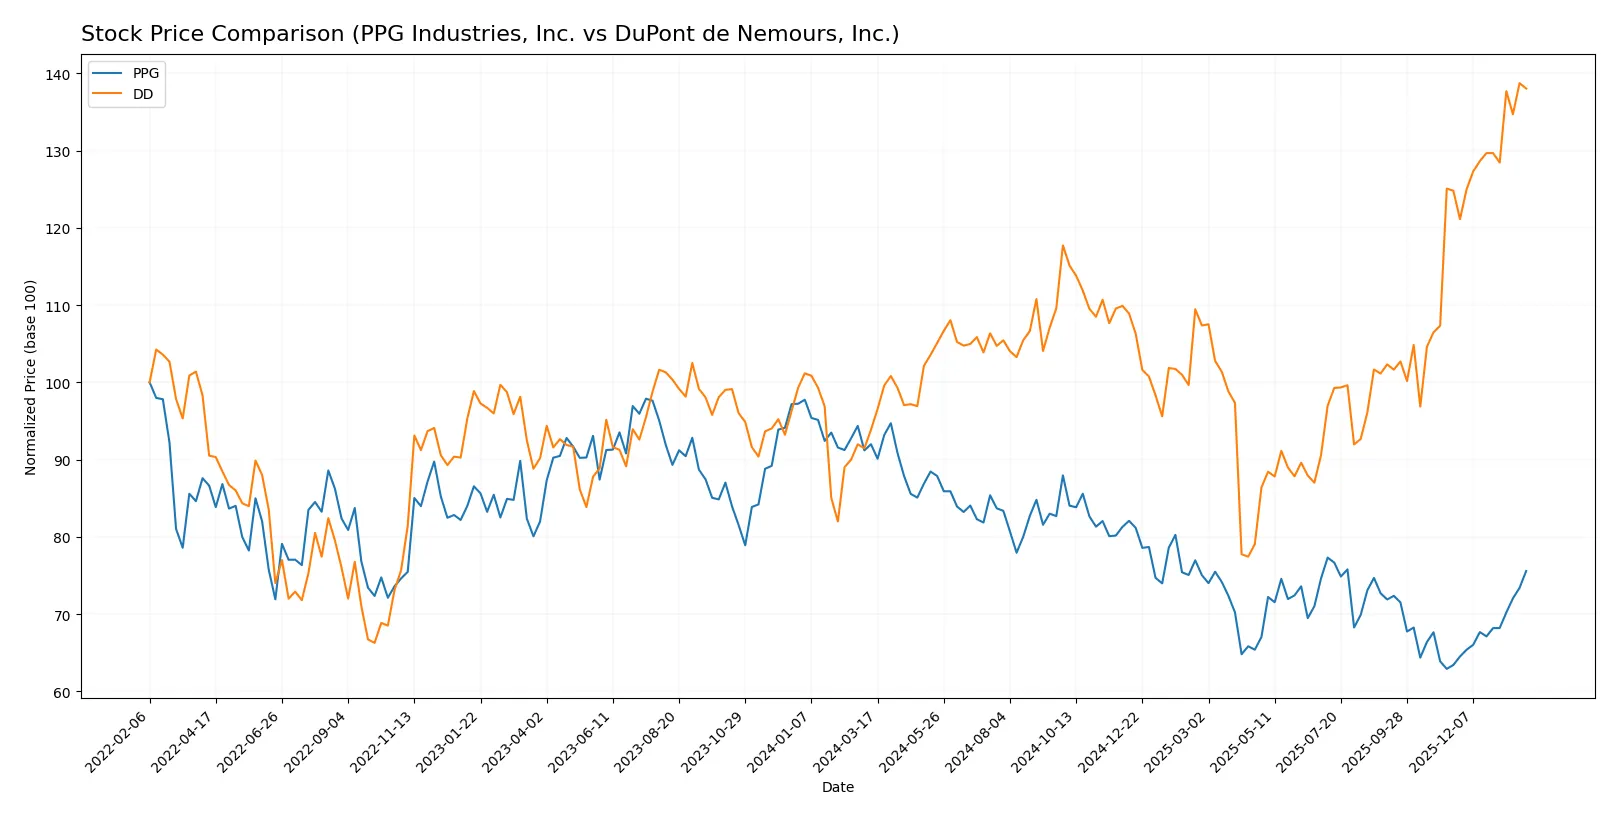
Trend Comparison
PPG Industries’ stock declined 17.84% over the past 12 months, showing a bearish trend with accelerating downward momentum and significant volatility (std dev 11.78). The price ranged between 144.9 and 96.25.
DuPont de Nemours gained 47.04% in the same period, exhibiting a bullish trend with accelerating upward momentum and lower volatility (std dev 3.96). The price moved from a low of 24.64 to a high of 44.14.
DuPont outperformed PPG by a wide margin, delivering strong market returns while PPG faced a pronounced downtrend, despite recent short-term recovery signs in both stocks.
Target Prices
Analysts present a mixed but clear target price consensus for PPG Industries and DuPont de Nemours.
| Company | Target Low | Target High | Consensus |
|---|---|---|---|
| PPG Industries, Inc. | 115 | 135 | 126 |
| DuPont de Nemours, Inc. | 44 | 107 | 55.5 |
PPG’s consensus target of 126 exceeds its current price of 115.63, signaling moderate upside potential. DuPont’s consensus target at 55.5 is above the current 43.92 price but shows a wider analyst valuation range, indicating higher uncertainty.

Don’t Let Luck Decide Your Entry Point
Optimize your entry points with our advanced ProRealTime indicators. You’ll get efficient buy signals with precise price targets for maximum performance. Start outperforming now!
How do institutions grade them?
PPG Industries, Inc. Grades
Here are the latest grades assigned to PPG Industries by major grading firms:
| Grading Company | Action | New Grade | Date |
|---|---|---|---|
| JP Morgan | Maintain | Overweight | 2026-01-29 |
| Goldman Sachs | Maintain | Buy | 2026-01-29 |
| Wells Fargo | Maintain | Overweight | 2026-01-29 |
| Citigroup | Maintain | Buy | 2026-01-29 |
| RBC Capital | Maintain | Sector Perform | 2026-01-29 |
| UBS | Maintain | Neutral | 2026-01-29 |
| Jefferies | Maintain | Hold | 2026-01-29 |
| Mizuho | Maintain | Outperform | 2026-01-28 |
DuPont de Nemours, Inc. Grades
The table below summarizes recent grades for DuPont from reputable institutions:
| Grading Company | Action | New Grade | Date |
|---|---|---|---|
| Citigroup | Maintain | Buy | 2026-01-21 |
| JP Morgan | Maintain | Overweight | 2026-01-16 |
| Keybanc | Maintain | Overweight | 2026-01-09 |
| UBS | Maintain | Buy | 2026-01-07 |
| Mizuho | Maintain | Outperform | 2025-12-18 |
| RBC Capital | Maintain | Outperform | 2025-11-18 |
| Wells Fargo | Maintain | Overweight | 2025-11-07 |
| UBS | Maintain | Buy | 2025-11-07 |
| Keybanc | Maintain | Overweight | 2025-11-07 |
| UBS | Maintain | Buy | 2025-11-05 |
Which company has the best grades?
Both companies receive predominantly positive grades, but DuPont shows a higher frequency of “Buy” and “Outperform” ratings from multiple firms. This consistent favorable assessment could influence investor confidence in DuPont’s growth prospects more strongly than PPG’s mixed “Hold” and “Neutral” evaluations.
Risks specific to each company
The following categories identify critical pressure points and systemic threats facing PPG Industries, Inc. and DuPont de Nemours, Inc. in the 2026 market environment:
1. Market & Competition
PPG Industries, Inc.
- Operates in specialty chemicals with strong coatings and materials segments; faces intense competition and pricing pressure.
DuPont de Nemours, Inc.
- Diverse materials and solutions portfolio across several segments; competes in high-technology and industrial markets with evolving customer needs.
2. Capital Structure & Debt
PPG Industries, Inc.
- High debt-to-assets ratio at 93.55%, signaling heavy leverage and financial risk despite favorable interest coverage.
DuPont de Nemours, Inc.
- Low debt-to-assets ratio of 19.57%, reflecting a more conservative capital structure and lower financial risk profile.
3. Stock Volatility
PPG Industries, Inc.
- Beta of 1.164 indicates moderate market sensitivity; trading range is relatively tight, suggesting controlled price swings.
DuPont de Nemours, Inc.
- Beta of 1.113 shows slightly lower volatility; wider trading range may indicate greater reaction to market events.
4. Regulatory & Legal
PPG Industries, Inc.
- Subject to environmental regulations impacting coatings and specialty chemicals; compliance costs may rise with stricter policies.
DuPont de Nemours, Inc.
- Faces regulatory scrutiny in advanced materials and chemical manufacturing, including safety and environmental standards globally.
5. Supply Chain & Operations
PPG Industries, Inc.
- Complex global supply chains for raw materials and coatings may face disruption risks amid geopolitical tensions.
DuPont de Nemours, Inc.
- Relies on advanced technology inputs and global sourcing; supply chain vulnerabilities heightened by semiconductor and materials demand volatility.
6. ESG & Climate Transition
PPG Industries, Inc.
- Increasing pressure to reduce carbon footprint in coatings production; ESG factors influence investor perceptions and regulatory adherence.
DuPont de Nemours, Inc.
- Active in water and protection solutions; ESG performance linked to sustainability of product lines and climate transition strategies.
7. Geopolitical Exposure
PPG Industries, Inc.
- Significant US-based operations with international exposure; geopolitical risks include trade policies and tariffs on chemicals.
DuPont de Nemours, Inc.
- Globally diversified footprint with sensitivity to trade disruptions, especially in Asia-Pacific and Europe markets.
Which company shows a better risk-adjusted profile?
PPG’s greatest risk is its excessive leverage, with a debt-to-assets ratio near 94%, raising solvency concerns despite operational strength. DuPont’s main vulnerability lies in weaker profitability and asset returns, signaling operational inefficiency. Despite DuPont’s lower leverage, its Altman Z-score in the distress zone contrasts sharply with PPG’s safe zone status. Therefore, PPG presents a better risk-adjusted profile, balancing operational resilience against financial risk. The stark difference in bankruptcy risk scores underscores my concern about DuPont’s financial health amidst market pressures.
Final Verdict: Which stock to choose?
PPG Industries stands out as a value creator with a durable competitive advantage, driven by a soaring ROIC well above its cost of capital. Its superpower lies in capital efficiency and solid operational returns. A point of vigilance remains its high debt-to-assets ratio, which could pressure financial flexibility. It fits well in portfolios seeking aggressive growth backed by operational strength.
DuPont de Nemours offers a strategic moat through its solid free cash flow generation and relatively low leverage, enhancing its safety profile compared to PPG. Its recurring cash flow and improving profitability trends provide a cushion against volatility. This makes it more suitable for investors focused on growth at a reasonable price (GARP), valuing stability alongside upside potential.
If you prioritize dynamic capital allocation and operational excellence, PPG Industries is the compelling choice due to its superior value creation and robust profitability. However, if you seek better financial stability and a more defensive growth posture, DuPont de Nemours offers better risk management and reliable cash flow. Both present analytical scenarios aligned with distinct investor profiles.
Disclaimer: Investment carries a risk of loss of initial capital. The past performance is not a reliable indicator of future results. Be sure to understand risks before making an investment decision.
Go Further
I encourage you to read the complete analyses of PPG Industries, Inc. and DuPont de Nemours, Inc. to enhance your investment decisions: