Home > Comparison > Basic Materials > DD vs LYB
The strategic rivalry between DuPont de Nemours, Inc. and LyondellBasell Industries N.V. shapes the specialty chemicals sector’s future. DuPont operates as a diversified technology-driven materials provider, focusing on advanced solutions across electronics, mobility, and water protection. In contrast, LyondellBasell emphasizes large-scale chemical production, refining, and polymer technologies. This analysis examines which operational model delivers superior risk-adjusted returns, guiding investors seeking balanced exposure within Basic Materials.
Table of contents
Companies Overview
DuPont de Nemours and LyondellBasell stand as two pillars in the specialty chemicals arena, influencing industrial innovation globally.
DuPont de Nemours, Inc.: Technology-Driven Specialty Materials Leader
DuPont de Nemours dominates the specialty chemicals sector through its technology-based materials and solutions across Electronics & Industrial, Mobility & Materials, and Water & Protection segments. Its revenue engine hinges on advanced semiconductor materials, engineering resins, and integrated safety products. In 2026, it prioritizes innovation in semiconductor fabrication and sustainable materials to maintain its competitive edge.
LyondellBasell Industries N.V.: Global Polyolefins and Chemicals Powerhouse
LyondellBasell operates as a leading producer of olefins, polyolefins, and advanced polymers, generating revenue from a diversified portfolio including polyethylene, polypropylene, refining, and catalysts. Its strategic focus in 2026 centers on expanding its polymer solutions and refining capabilities globally, leveraging scale and technology licensing to sustain growth and market reach.
Strategic Collision: Similarities & Divergences
Both companies thrive within specialty chemicals but diverge in focus: DuPont emphasizes high-tech, integrated materials solutions, while LyondellBasell prioritizes commodity and advanced polymers at scale. Their primary battleground lies in supplying materials to electronics and industrial sectors, but DuPont’s innovation-driven niche contrasts with LyondellBasell’s volume-driven model. This creates distinct investment profiles rooted in innovation versus operational scale.
Income Statement Comparison
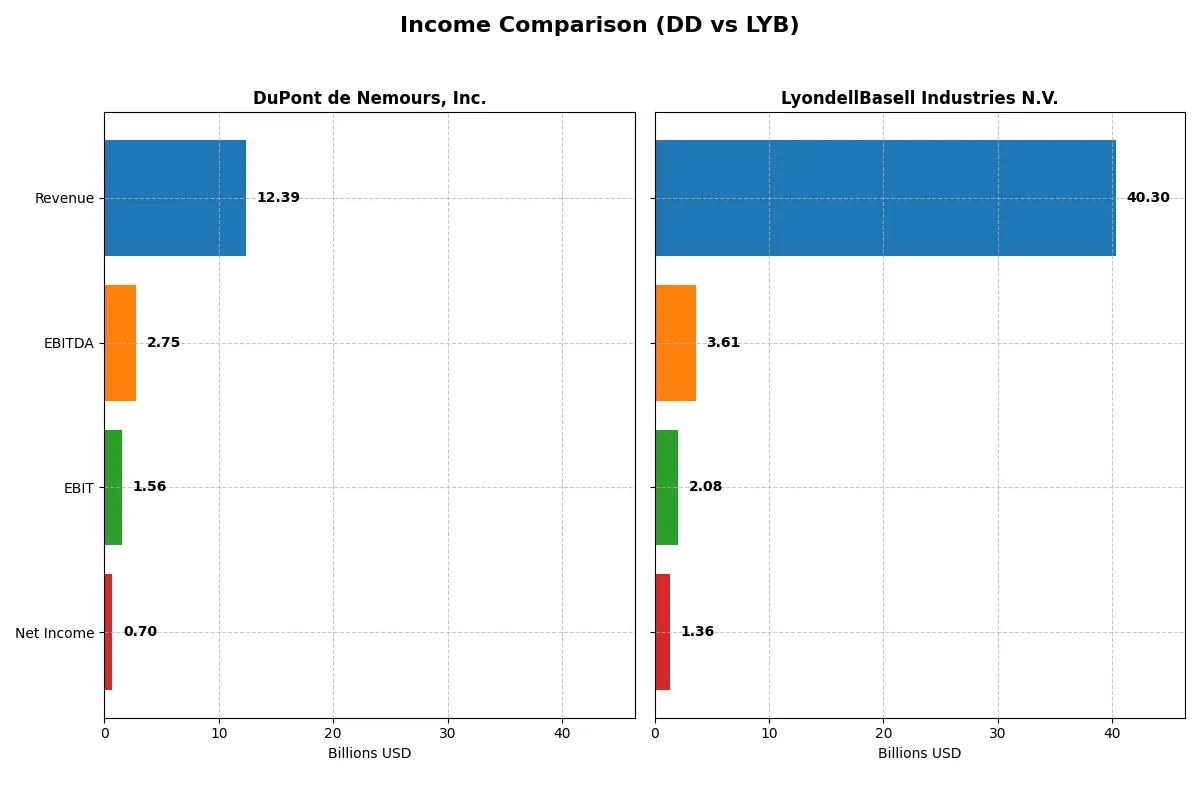
This data dissects the core profitability and scalability of both corporate engines to reveal who dominates the bottom line:
| Metric | DuPont de Nemours, Inc. (DD) | LyondellBasell Industries N.V. (LYB) |
|---|---|---|
| Revenue | 12.39B | 40.30B |
| Cost of Revenue | 8.47B | 35.74B |
| Operating Expenses | 2.08B | 2.75B |
| Gross Profit | 3.91B | 4.56B |
| EBITDA | 2.75B | 3.61B |
| EBIT | 1.56B | 2.08B |
| Interest Expense | 366M | 481M |
| Net Income | 703M | 1.35B |
| EPS | 1.68 | 4.16 |
| Fiscal Year | 2024 | 2024 |
Income Statement Analysis: The Bottom-Line Duel
This income statement comparison reveals which company drives profitability and margin efficiency more effectively in a competitive market.
DuPont de Nemours, Inc. Analysis
DuPont’s revenue declined slightly by 13.6% from 2020 to 2024 but net income grew 124%, reflecting strong bottom-line momentum. The company sustains healthy gross margins at 31.6% and net margins at 5.7%, indicating disciplined cost management. In 2024, DuPont boosted EBIT by 73%, showcasing a sharp rebound in operational efficiency.
LyondellBasell Industries N.V. Analysis
LyondellBasell expanded revenue by 45% over five years but suffered a 4% net income decline, signaling margin pressure. Gross margin stands at 11.3%, and net margin at 3.4%, both notably weaker than DuPont’s. In 2024, all key profitability metrics fell, including a 33% EBIT drop, reflecting deteriorating operational leverage.
Margin Strength vs. Revenue Growth
DuPont outperforms LyondellBasell on margin expansion and net income growth despite slower top-line gains. LyondellBasell’s revenue scale is impressive but offset by margin erosion and weaker earnings momentum. For investors prioritizing profitability and efficiency, DuPont’s profile offers a cleaner, more sustainable earnings trajectory.
Financial Ratios Comparison
These vital ratios act as a diagnostic tool to expose the underlying fiscal health, valuation premiums, and capital efficiency of the companies compared below:
| Ratios | DuPont de Nemours, Inc. (DD) | LyondellBasell Industries N.V. (LYB) |
|---|---|---|
| ROE | 3.0% | 10.9% |
| ROIC | 3.5% | 5.1% |
| P/E | 19.0 | 17.7 |
| P/B | 0.57 | 1.94 |
| Current Ratio | 1.33 | 1.83 |
| Quick Ratio | 0.88 | 1.13 |
| D/E | 0.31 | 1.04 |
| Debt-to-Assets | 19.6% | 36.2% |
| Interest Coverage | 5.0 | 3.8 |
| Asset Turnover | 0.34 | 1.13 |
| Fixed Asset Turnover | 2.15 | 2.44 |
| Payout ratio | 90.3% | 126.5% |
| Dividend yield | 4.75% | 7.13% |
| Fiscal Year | 2024 | 2024 |
Efficiency & Valuation Duel: The Vital Signs
Financial ratios act as the company’s DNA, revealing hidden risks and operational strengths that shape investor decisions and market positioning.
DuPont de Nemours, Inc.
DuPont shows weak profitability with a 3.01% ROE and modest 5.68% net margin, signaling operational challenges. Its P/E of 19.02 suggests a fairly valued stock, while a favorable 4.75% dividend yield supports steady shareholder returns. The company balances risk prudently with a low debt ratio and a neutral liquidity position.
LyondellBasell Industries N.V.
LyondellBasell’s latest ratios are largely unavailable, reflecting a data gap that complicates valuation and risk assessment. Historical figures show strong profitability with ROE above 10%, but zero recent dividend yield points to limited direct shareholder returns. Its valuation metrics historically indicated a cheaper stock compared to peers, albeit with operational uncertainties.
Prudence in Visibility: DuPont’s Steady Yield vs. LyondellBasell’s Data Void
DuPont offers clearer insights with moderate valuation and reliable dividends, balancing risk and reward cautiously. LyondellBasell’s missing current data heightens risk, limiting confidence. Investors favoring stability and visible income streams may find DuPont’s profile more suitable.
Which one offers the Superior Shareholder Reward?
I compare DuPont de Nemours (DD) and LyondellBasell Industries (LYB) on dividends and buybacks. DD yields ~4.7% with a payout near 90%, well covered by free cash flow (3B FCF, 1.5B dividend + capex coverage). LYB yields higher at 7.1%, but payout exceeds 126%, signaling risk. DD’s steady buybacks complement dividends sustainably. LYB’s buybacks are unreported, raising concerns. LYB’s aggressive payout with high leverage (debt/equity ~1.04) threatens long-term value. I favor DD for balanced, sustainable shareholder rewards in 2026.
Comparative Score Analysis: The Strategic Profile
The radar chart reveals the fundamental DNA and trade-offs of DuPont de Nemours, Inc. and LyondellBasell Industries N.V., highlighting their core financial strengths and vulnerabilities:
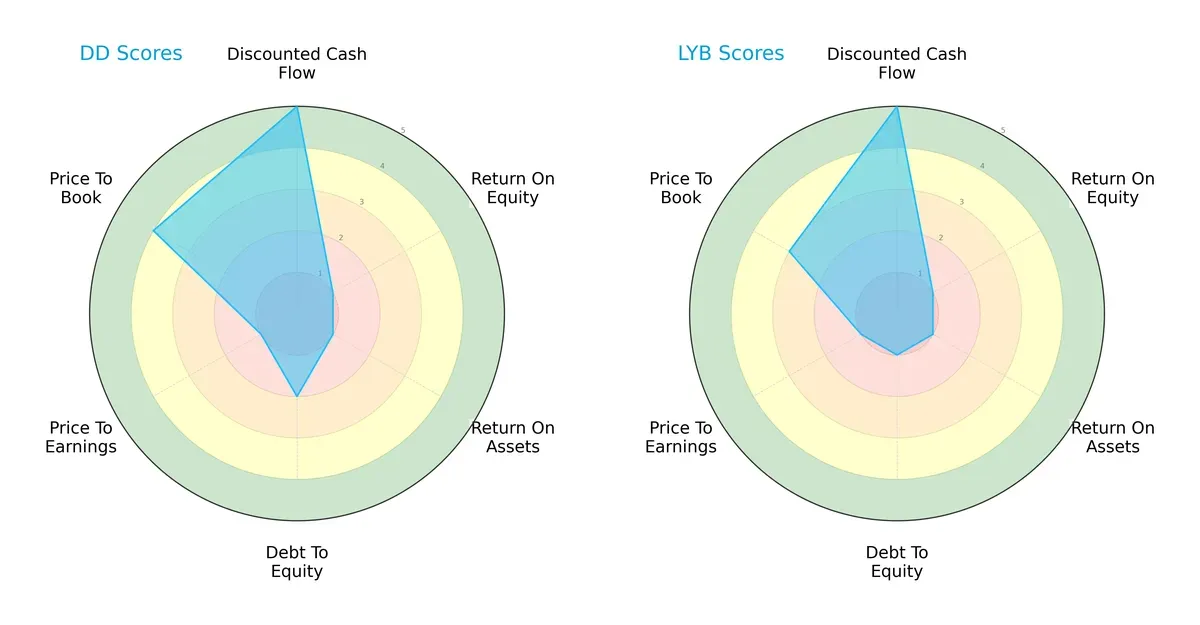
DuPont and LyondellBasell share identical DCF scores (5) and poor ROE (1) and ROA (1) scores, signaling weak profitability despite solid cash flow valuations. DuPont edges out on debt-to-equity (2 vs. 1) and price-to-book (4 vs. 3), reflecting a more balanced financial structure. LyondellBasell’s heavier leverage and lower valuation scores suggest reliance on cost advantages rather than capital efficiency. Overall, DuPont presents a modestly more stable profile, while LyondellBasell depends on specific valuation and leverage dynamics.
Bankruptcy Risk: Solvency Showdown
DuPont’s Altman Z-Score of 0.43 places it deep in the distress zone, signaling severe bankruptcy risk under current market conditions. LyondellBasell’s Z-Score is unavailable, preventing direct comparison but raising caution given sector volatility:

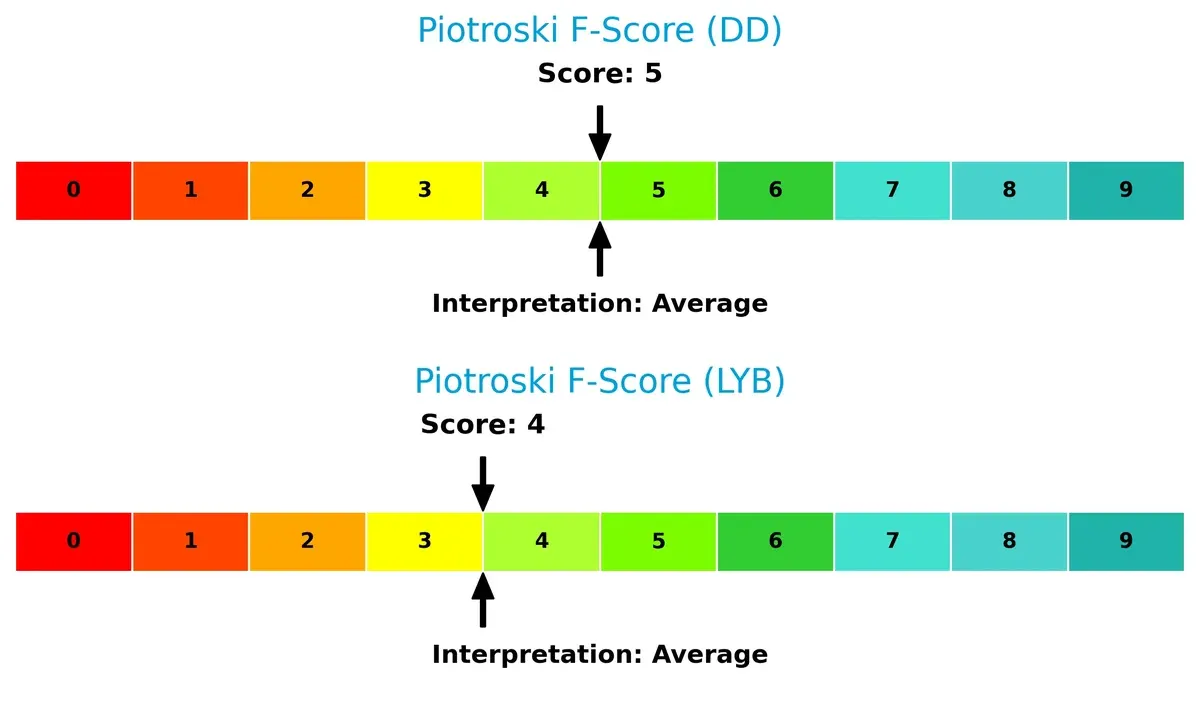
Financial Health: Quality of Operations
DuPont scores a 5 and LyondellBasell a 4 on the Piotroski F-Score, both landing in the average range. Neither company exhibits peak financial health, but DuPont shows marginally stronger internal metrics, while LyondellBasell’s slightly weaker score hints at potential red flags in operational efficiency:
How are the two companies positioned?
This section dissects the operational DNA of DuPont and LyondellBasell by comparing their revenue distribution by segment and internal dynamics of strengths and weaknesses. The objective is to confront their economic moats to identify which model offers the most resilient and sustainable competitive advantage today.
Revenue Segmentation: The Strategic Mix
This visual comparison dissects how DuPont de Nemours, Inc. and LyondellBasell Industries N.V. diversify their income streams and reveals where their primary sector bets lie:
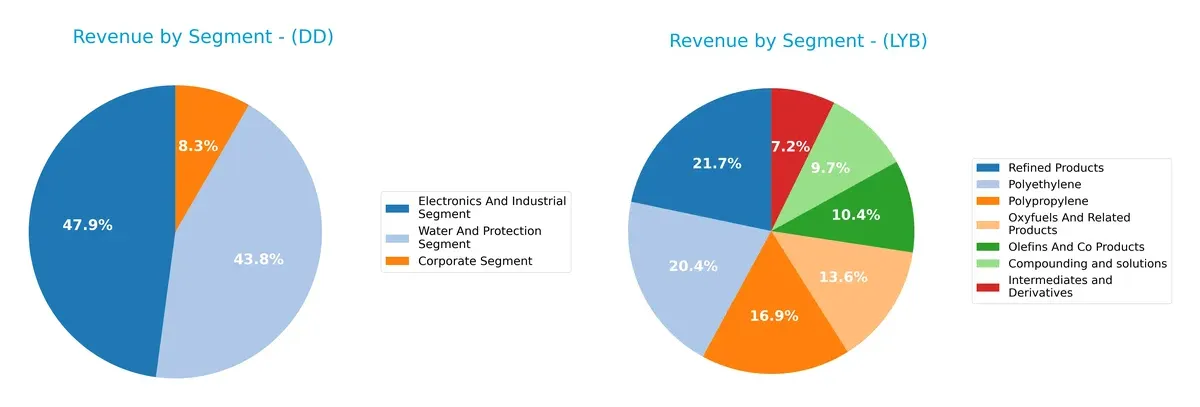
DuPont anchors its 2024 revenue around Electronics and Industrial ($5.93B) and Water and Protection ($5.42B), with a modest Corporate segment ($1.03B), showing a balanced three-segment mix that mitigates concentration risk. LyondellBasell pivots on Refined Products ($8.08B) and Polyethylene ($7.58B), but leans heavily on Olefins, Polypropylene, and Oxyfuels, reflecting a strong focus on chemical infrastructure dominance rather than broad diversification.
Strengths and Weaknesses Comparison
This table compares the Strengths and Weaknesses of DuPont de Nemours, Inc. (DD) and LyondellBasell Industries N.V. (LYB):
DD Strengths
- Diversified revenue across Electronics, Water, and Industrial segments
- Favorable debt-to-assets ratio at 19.57%
- Positive dividend yield of 4.75%
- Slightly favorable overall financial ratios
LYB Strengths
- Diversified product portfolio including Polyethylene, Polypropylene, and Refined Products
- Favorable debt-to-equity and debt-to-assets metrics
- Neutral interest coverage ratio supports debt servicing
DD Weaknesses
- Low return on equity (3.01%) and return on invested capital (3.54%) below WACC (7.78%)
- Neutral current and quick ratios suggest liquidity constraints
- Unfavorable asset turnover ratio (0.34) indicating inefficient asset use
LYB Weaknesses
- Zero or unavailable profitability ratios (net margin, ROE, ROIC) reflect poor earnings
- Unfavorable liquidity ratios (current and quick ratios at 0) indicate financial stress
- Unfavorable asset turnover and fixed asset turnover ratios suggest operational inefficiency
Overall, DD shows a more balanced financial structure with modest profitability and a reliable dividend, reflecting cautious capital allocation. LYB’s lack of profitability and liquidity metrics signal operational and financial challenges that could impact its strategic flexibility.
The Moat Duel: Analyzing Competitive Defensibility
A structural moat is the only true shield protecting long-term profits from competition’s relentless erosion, defining sustainable advantage in these chemical giants:
DuPont de Nemours, Inc.: Innovation-Driven Intangible Assets
DuPont’s moat stems from deep intangible assets and advanced materials technology, reflected in stable margins and a growing ROIC trend despite current value destruction. Its expanding semiconductor and water protection segments could reinforce this edge in 2026.
LyondellBasell Industries N.V.: Scale-Driven Cost Advantage
LyondellBasell relies on scale and diversified olefins/polyolefins production, but suffers declining ROIC and pressured margins, contrasting with DuPont’s innovation moat. Opportunities in refining and polymer technologies may offer limited moat deepening amid operational headwinds.
Innovation Intangibles vs. Scale Cost Advantage: Moat Resilience in 2026
DuPont’s intangible asset moat is deeper, supported by margin stability and improving profitability trends. LyondellBasell’s scale advantage faces erosion without ROIC growth. DuPont stands better equipped to defend market share against intensifying competition.
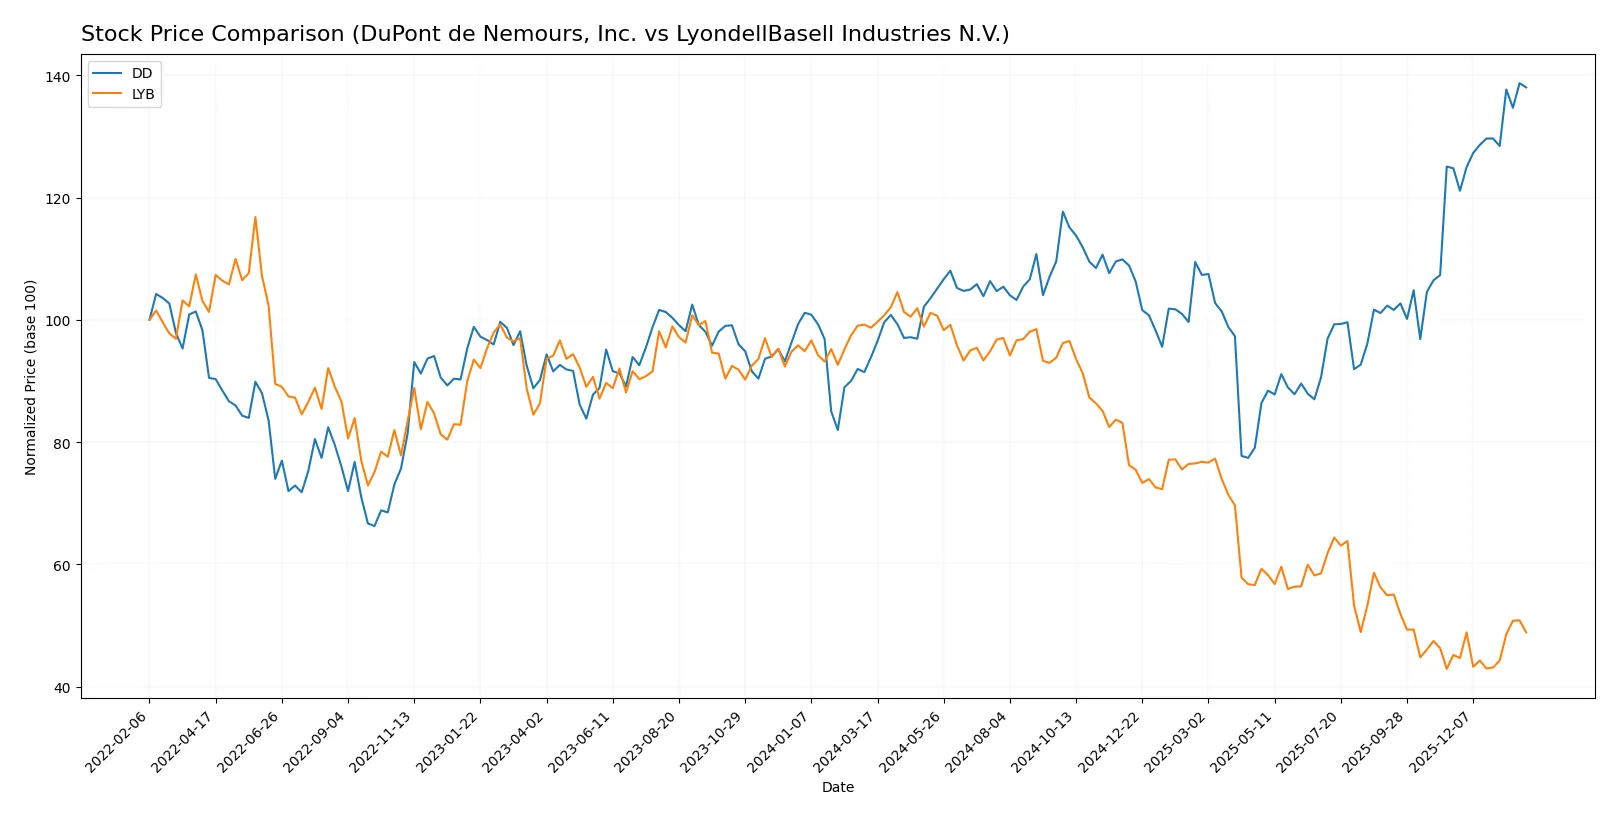
Which stock offers better returns?
The past year shows contrasting price movements between DuPont de Nemours, Inc. and LyondellBasell Industries N.V., with DuPont gaining sharply while LyondellBasell declined significantly.
Trend Comparison
DuPont de Nemours, Inc. posted a strong bullish trend with a 47.04% price increase over 12 months, showing acceleration and moderate volatility (3.96 std dev). The stock hit a high of 44.14 and a low of 24.64.
LyondellBasell Industries N.V. experienced a bearish trend, losing 50.48% over the same period with accelerating decline and high volatility (20.23 std dev). Its price peaked at 104.78 and bottomed at 43.02.
DuPont clearly outperformed LyondellBasell, delivering the highest market returns and steady upward momentum in the analyzed timeframe.
Target Prices
Analysts present a mixed but cautiously optimistic target consensus for these specialty chemical companies.
| Company | Target Low | Target High | Consensus |
|---|---|---|---|
| DuPont de Nemours, Inc. | 44 | 107 | 55.5 |
| LyondellBasell Industries N.V. | 36 | 51 | 45.75 |
DuPont’s consensus target sits slightly above its current price of 43.92, suggesting moderate upside potential. LyondellBasell’s target consensus near 45.75 also indicates limited but positive appreciation from its current 49, reflecting cautious market expectations.

Don’t Let Luck Decide Your Entry Point
Optimize your entry points with our advanced ProRealTime indicators. You’ll get efficient buy signals with precise price targets for maximum performance. Start outperforming now!
How do institutions grade them?
Here is a summary of the latest institutional grades for DuPont de Nemours, Inc. and LyondellBasell Industries N.V.:
DuPont de Nemours, Inc. Grades
The following table shows recent grades from major financial institutions for DuPont:
| Grading Company | Action | New Grade | Date |
|---|---|---|---|
| Citigroup | Maintain | Buy | 2026-01-21 |
| JP Morgan | Maintain | Overweight | 2026-01-16 |
| Keybanc | Maintain | Overweight | 2026-01-09 |
| UBS | Maintain | Buy | 2026-01-07 |
| Mizuho | Maintain | Outperform | 2025-12-18 |
| RBC Capital | Maintain | Outperform | 2025-11-18 |
| Wells Fargo | Maintain | Overweight | 2025-11-07 |
| UBS | Maintain | Buy | 2025-11-07 |
| Keybanc | Maintain | Overweight | 2025-11-07 |
| UBS | Maintain | Buy | 2025-11-05 |
LyondellBasell Industries N.V. Grades
The following table shows recent grades from major financial institutions for LyondellBasell:
| Grading Company | Action | New Grade | Date |
|---|---|---|---|
| RBC Capital | Maintain | Sector Perform | 2026-01-16 |
| Citigroup | Maintain | Neutral | 2026-01-15 |
| UBS | Maintain | Sell | 2025-12-23 |
| Wells Fargo | Downgrade | Equal Weight | 2025-12-19 |
| Citigroup | Maintain | Neutral | 2025-12-18 |
| BMO Capital | Downgrade | Underperform | 2025-12-15 |
| Mizuho | Maintain | Neutral | 2025-12-11 |
| Citigroup | Maintain | Neutral | 2025-11-19 |
| Evercore ISI Group | Maintain | In Line | 2025-11-11 |
| JP Morgan | Maintain | Neutral | 2025-11-03 |
Which company has the best grades?
DuPont clearly holds stronger grades, consistently rated Buy, Overweight, and Outperform by top firms. LyondellBasell mostly receives Neutral or lower ratings, including Sell and Underperform. This suggests greater institutional confidence in DuPont’s prospects, influencing investor sentiment and potential stock momentum.
Risks specific to each company
The following categories identify critical pressure points and systemic threats facing DuPont de Nemours, Inc. and LyondellBasell Industries N.V. in the 2026 market environment:
1. Market & Competition
DuPont de Nemours, Inc.
- Faces intense competition in specialty chemicals with moderate net margin (5.68%) and weak ROIC, signaling operational challenges.
LyondellBasell Industries N.V.
- Struggles with zero net margin and ROIC, indicating significant profitability pressure and competitive strain in commodity chemicals.
2. Capital Structure & Debt
DuPont de Nemours, Inc.
- Maintains conservative debt levels (D/E 0.31) and favorable debt-to-assets (19.57%), reducing financial risk.
LyondellBasell Industries N.V.
- Debt metrics unavailable or unfavorable, with very unfavorable debt-to-equity score, suggesting higher leverage risk.
3. Stock Volatility
DuPont de Nemours, Inc.
- Beta at 1.11 implies moderate volatility slightly above market average, requiring cautious positioning.
LyondellBasell Industries N.V.
- Lower beta at 0.74 indicates less price volatility, potentially providing a defensive characteristic.
4. Regulatory & Legal
DuPont de Nemours, Inc.
- Operates in multiple jurisdictions with exposure to stringent environmental and safety regulations impacting cost structure.
LyondellBasell Industries N.V.
- Global footprint exposes it to complex regulatory environments, especially in refining and chemical sectors, increasing compliance costs.
5. Supply Chain & Operations
DuPont de Nemours, Inc.
- Moderate asset turnover (0.34) reflects operational inefficiencies, risking supply chain responsiveness.
LyondellBasell Industries N.V.
- Unavailable or weak asset turnover data signals potential operational inefficiencies and supply chain vulnerabilities.
6. ESG & Climate Transition
DuPont de Nemours, Inc.
- Faces pressure to innovate in sustainable materials and reduce carbon footprint amid rising ESG investor scrutiny.
LyondellBasell Industries N.V.
- Refining and chemical production expose it to significant carbon transition risk and regulatory penalties.
7. Geopolitical Exposure
DuPont de Nemours, Inc.
- Global operations in volatile regions expose it to geopolitical risks affecting supply and demand dynamics.
LyondellBasell Industries N.V.
- Similar exposure, with additional risk from refining operations sensitive to oil price and trade policy fluctuations.
Which company shows a better risk-adjusted profile?
DuPont’s strongest risk is operational inefficiency, evidenced by low ROIC and asset turnover. LyondellBasell’s most critical risk is financial leverage, with unfavorable debt metrics heightening bankruptcy risk. DuPont’s moderate leverage and more diversified risk profile present a better risk-adjusted profile. Its Altman Z-score in distress zone is concerning but still preferable to LyondellBasell’s lack of available distress metrics combined with very unfavorable debt-to-equity scores. Recent data show DuPont’s stable dividend yield (4.75%) supporting investor confidence versus LyondellBasell’s zero dividend, underscoring DuPont’s comparatively lower financial strain.
Final Verdict: Which stock to choose?
DuPont de Nemours, Inc. stands out for its resilience in profitability growth despite a challenging capital efficiency landscape. Its superpower lies in steadily improving income quality and margin expansion, though its underwhelming ROIC versus WACC signals a point of vigilance for value creation. It fits well within an aggressive growth portfolio seeking turnaround potential.
LyondellBasell Industries benefits from a strategic moat in operational scale and asset turnover, offering more consistent cash flow conversion and a safer balance sheet relative to DuPont. While its valuation metrics suggest room for improvement, it appeals to portfolios focused on GARP—balancing growth prospects with reasonable value.
If you prioritize growth fueled by margin improvement and income quality, DuPont de Nemours is the compelling choice due to its accelerating profitability. However, if you seek better financial stability and operational efficiency as a foundation, LyondellBasell offers superior risk management despite recent earnings softness. Both demand careful monitoring of their respective capital allocation trajectories.
Disclaimer: Investment carries a risk of loss of initial capital. The past performance is not a reliable indicator of future results. Be sure to understand risks before making an investment decision.
Go Further
I encourage you to read the complete analyses of DuPont de Nemours, Inc. and LyondellBasell Industries N.V. to enhance your investment decisions: