Home > Comparison > Basic Materials > LIN vs DD
The strategic rivalry between Linde plc and DuPont de Nemours, Inc. shapes the future of the specialty chemicals sector. Linde operates as a capital-intensive industrial gas and engineering giant, while DuPont focuses on technology-based specialty materials and solutions. This head-to-head pits scale and infrastructure against innovation and diversification. This analysis aims to identify which corporate trajectory offers the superior risk-adjusted potential for a balanced, diversified portfolio in 2026.
Table of contents
Companies Overview
Linde plc and DuPont de Nemours, Inc. stand as pivotal forces in the specialty chemicals sector, shaping global industrial materials markets.
Linde plc: Industrial Gas Powerhouse
Linde plc dominates as a global industrial gas and engineering leader, generating revenue primarily through atmospheric and process gases like oxygen and hydrogen. Its strategic focus in 2026 centers on expanding turnkey plant construction and advancing gas solutions across healthcare, energy, and manufacturing sectors worldwide. This diversified industrial gas portfolio underpins its robust market position.
DuPont de Nemours, Inc.: Advanced Materials Innovator
DuPont de Nemours specializes in technology-based materials and solutions that serve electronics, mobility, and water protection markets. Its revenue streams derive from its Electronics & Industrial, Mobility & Materials, and Water & Protection segments. In 2026, DuPont prioritizes innovation in semiconductor materials and engineered safety products, aiming to capture growth in high-tech manufacturing and sustainability-focused industries.
Strategic Collision: Similarities & Divergences
Both companies operate within specialty chemicals but diverge in approach: Linde pursues a capital-intensive, integrated gas infrastructure model, while DuPont emphasizes materials innovation across diverse end-markets. Their prime battleground is industrial applications where materials and gases intersect, such as energy and manufacturing. Investors will find Linde offers scale and infrastructure strength, whereas DuPont presents a growth profile driven by cutting-edge material technologies.
Income Statement Comparison
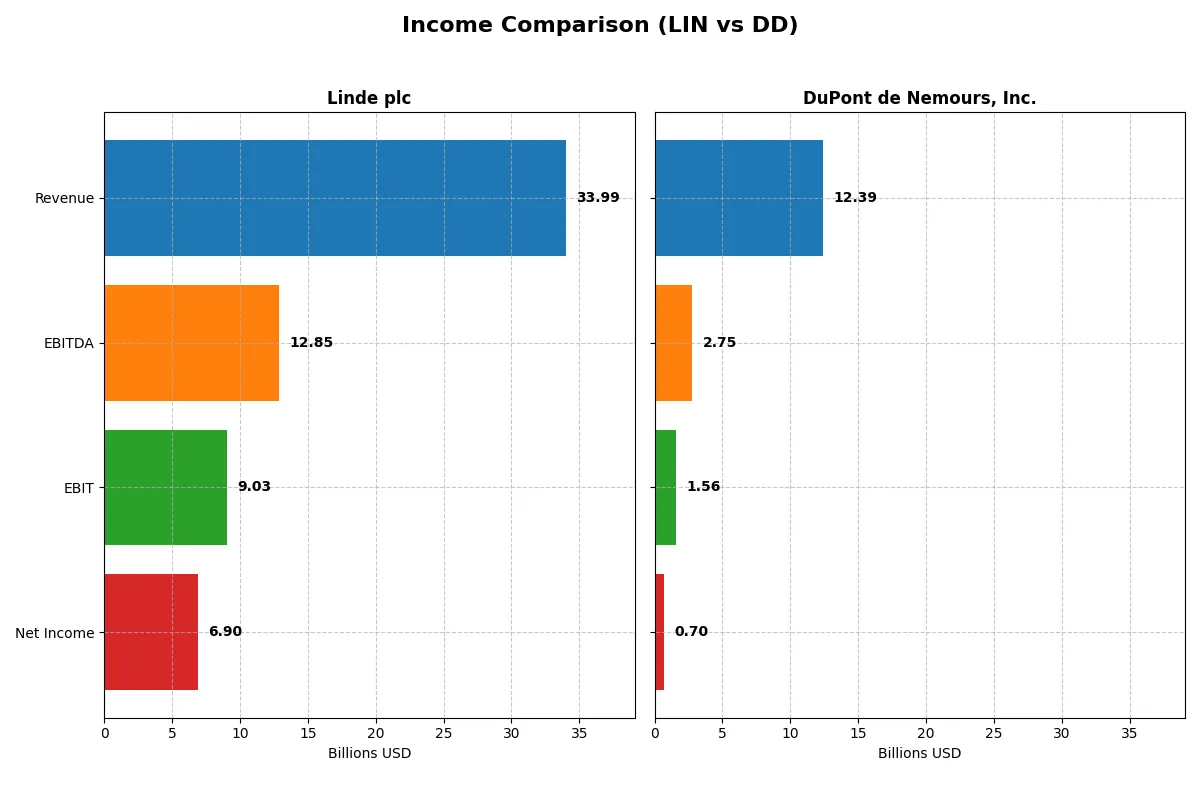
The following data dissects the core profitability and scalability of both corporate engines to reveal who dominates the bottom line:
| Metric | Linde plc (LIN) | DuPont de Nemours, Inc. (DD) |
|---|---|---|
| Revenue | 34B | 12.4B |
| Cost of Revenue | 19.3B | 8.5B |
| Operating Expenses | 5.8B | 2.1B |
| Gross Profit | 14.7B | 3.9B |
| EBITDA | 12.9B | 2.8B |
| EBIT | 9B | 1.6B |
| Interest Expense | 212M | 366M |
| Net Income | 6.9B | 703M |
| EPS | 14.67 | 1.68 |
| Fiscal Year | 2025 | 2024 |
Income Statement Analysis: The Bottom-Line Duel
This income statement comparison uncovers how each company’s operational efficiency drives their financial outcomes in a competitive market.
Linde plc Analysis
Linde’s revenue grew steadily from 30.8B in 2021 to 34B in 2025, with net income doubling from 3.8B to 6.9B. Gross margin improved to 43.3%, and net margin reached a strong 20.3%, reflecting disciplined cost management. In 2025, Linde sustained high profitability despite a slight EBIT dip, signaling solid momentum and operational control.
DuPont de Nemours, Inc. Analysis
DuPont’s revenue fluctuated, peaking near 14.3B in 2020 but declining to 12.4B by 2024. Net income showed volatility, slumping to -2.9B in 2020 but rebounding to 0.7B in 2024. Gross margin averaged 31.6%, with a lower net margin of 5.7%. The sharp EBIT growth of 73% in 2024 demonstrates a turning point toward improved efficiency.
Margin Strength vs. Recovery Momentum
Linde dominates with superior margins and stable revenue growth, reflecting a robust and efficient business model. DuPont’s volatile revenue and net income contrast with its recent operational rebound and aggressive EBIT improvement. For investors, Linde’s consistency and margin strength offer a safer income profile, while DuPont’s momentum may appeal to those seeking turnaround potential.
Financial Ratios Comparison
These vital ratios act as a diagnostic tool to expose the underlying fiscal health, valuation premiums, and capital efficiency of the companies compared:
| Ratios | Linde plc (LIN) | DuPont de Nemours, Inc. (DD) |
|---|---|---|
| ROE | 17.2% | 3.0% |
| ROIC | 9.2% | 3.5% |
| P/E | 30.5 | 19.0 |
| P/B | 5.26 | 0.57 |
| Current Ratio | 0.89 | 1.33 |
| Quick Ratio | 0.76 | 0.88 |
| D/E | 0.59 | 0.31 |
| Debt-to-Assets | 28.2% | 19.6% |
| Interest Coverage | 15.0 | 5.0 |
| Asset Turnover | 0.41 | 0.34 |
| Fixed Asset Turnover | 1.28 | 2.15 |
| Payout Ratio | 40.4% | 90.3% |
| Dividend Yield | 1.32% | 4.75% |
| Fiscal Year | 2024 | 2024 |
Efficiency & Valuation Duel: The Vital Signs
Financial ratios act as a company’s DNA, exposing hidden risks and signaling operational strength or weaknesses to investors.
Linde plc
Linde shows strong profitability with a 17.23% ROE and a robust 19.89% net margin, highlighting operational efficiency. However, its valuation appears stretched with a 30.53 P/E and a high 5.26 P/B ratio. The firm returns value via a moderate 1.32% dividend yield, balancing payout with reinvestment.
DuPont de Nemours, Inc.
DuPont posts weaker profitability, with a 3.01% ROE and a 5.68% net margin, reflecting operational challenges. Its valuation is more reasonable at a 19.02 P/E and a low 0.57 P/B, suggesting undervaluation. The company offers a generous 4.75% dividend yield, favoring shareholder returns over aggressive reinvestment.
Valuation Stretch versus Dividend Stability
Linde commands a premium valuation supported by solid profitability but shows liquidity concerns. DuPont offers a safer valuation and higher dividend yield but struggles with profitability. Investors seeking growth may prefer Linde’s profile, while income-focused investors may lean toward DuPont’s stable payouts.
Which one offers the Superior Shareholder Reward?
I see Linde plc (LIN) pays a modest 1.3% dividend yield with a sustainable 40% payout ratio, well-covered by free cash flow (FCF). LIN also executes steady buybacks, enhancing total returns. DuPont de Nemours (DD) offers a high 4.7% yield but sports an unsustainably high 90% payout ratio, risking dividend cuts. DD’s buybacks are less consistent and overshadowed by weaker margins and cash flow. Historically in chemicals, sustainable payouts backed by strong FCF and disciplined buybacks drive superior shareholder rewards. Therefore, I conclude LIN delivers a more attractive, durable total return profile in 2026 despite its lower yield.
Comparative Score Analysis: The Strategic Profile
The radar chart reveals the fundamental DNA and trade-offs of Linde plc and DuPont de Nemours, Inc., highlighting their core financial strengths and weaknesses:
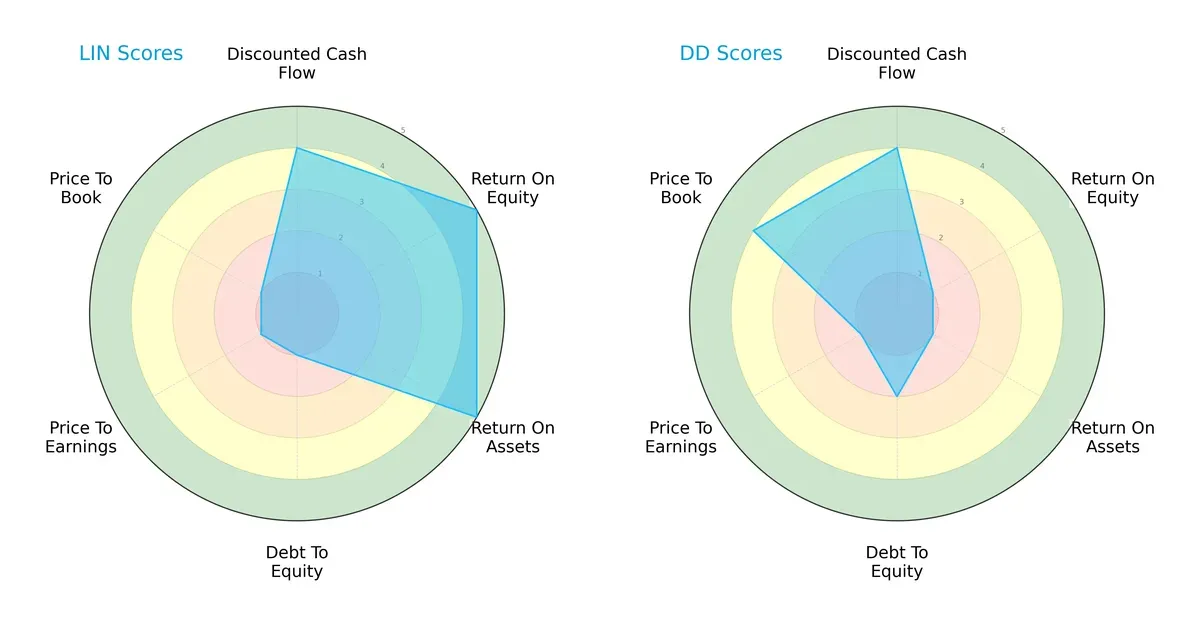
Linde plc shows a balanced profile with very favorable returns on equity (5) and assets (5) but suffers from weak debt (1) and valuation scores (PE/PB at 1). DuPont relies heavily on valuation strength (P/B at 4) but struggles with profitability metrics (ROE and ROA both at 1) and has a slightly better debt score (2). Linde’s edge is operational efficiency, while DuPont attempts value appeal despite weaker returns.
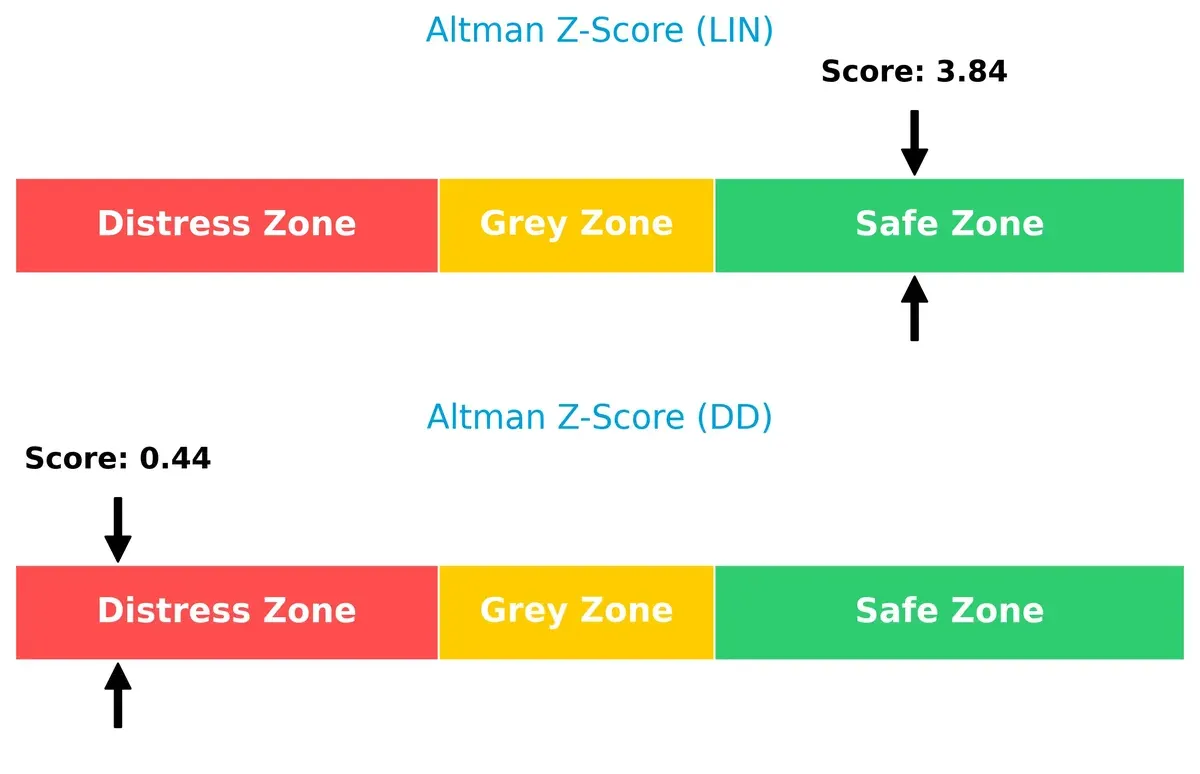
Bankruptcy Risk: Solvency Showdown
Linde’s Altman Z-Score of 3.84 places it firmly in the safe zone, signaling robust long-term survival prospects. DuPont’s 0.44 score lands it in the distress zone, raising red flags about potential bankruptcy risks:
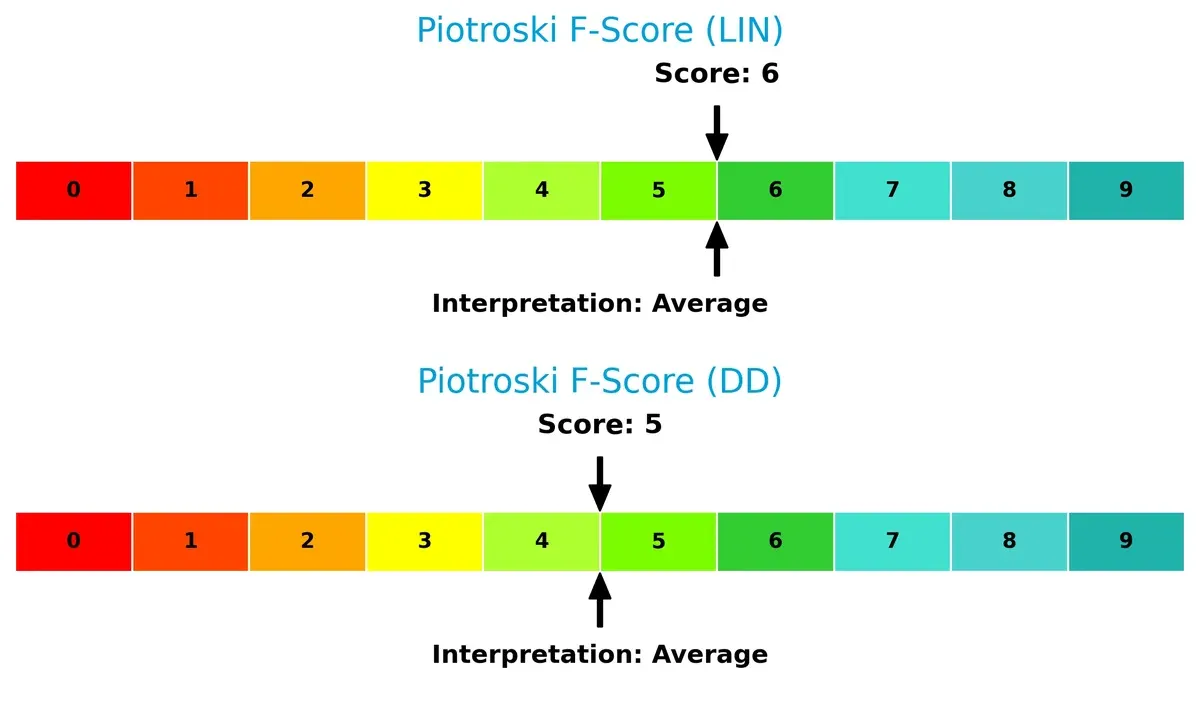
Financial Health: Quality of Operations
Both firms present average Piotroski F-Scores—Linde at 6 and DuPont at 5—indicating moderate financial health. Neither shows severe red flags, but Linde’s slightly higher score suggests better internal financial quality:
How are the two companies positioned?
This section dissects Linde and DuPont’s operational DNA by comparing their revenue distribution and internal strengths and weaknesses. The goal is to confront their economic moats to identify the most resilient, sustainable competitive advantage today.
Revenue Segmentation: The Strategic Mix
This visual comparison dissects how Linde plc and DuPont de Nemours diversify their income streams and where their primary sector bets lie:
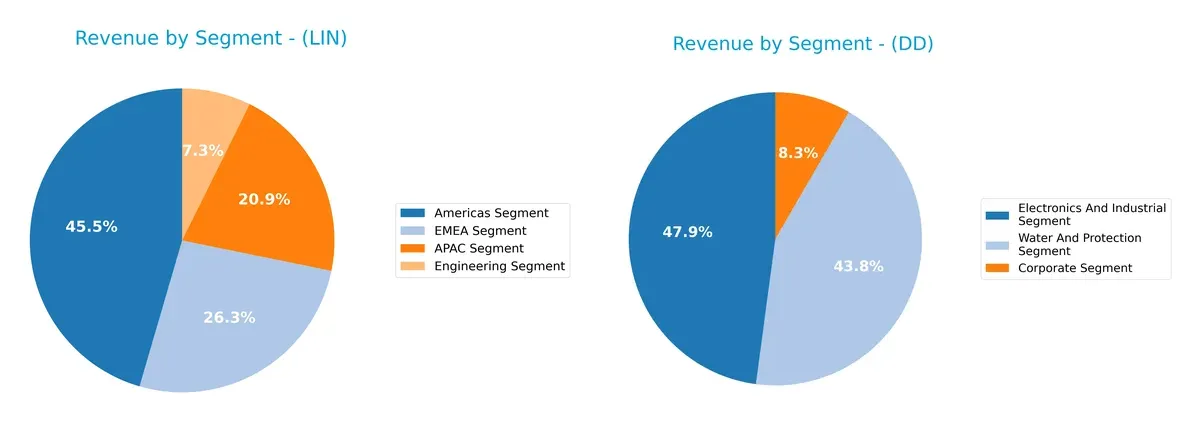
Linde leans heavily on the Americas Segment, generating $14.4B, while maintaining strong revenue from APAC ($6.6B) and EMEA ($8.4B). This balanced geographic spread reduces regional risk. DuPont’s revenue centers on Electronics And Industrial ($5.9B) and Water And Protection ($5.4B), showing a more focused industrial portfolio. Linde’s diversified global footprint contrasts with DuPont’s concentrated sector bets, implying Linde benefits from geographic resilience, while DuPont faces higher concentration risk but potentially stronger industrial moats.
Strengths and Weaknesses Comparison
This table compares the Strengths and Weaknesses of Linde plc and DuPont de Nemours, Inc.:
Linde plc Strengths
- Strong profitability with 19.89% net margin and 17.23% ROE
- Favorable WACC at 7.19% supporting capital efficiency
- Diverse global presence across Americas, EMEA, APAC
- Solid debt to assets ratio at 28.21% and high interest coverage
DuPont de Nemours Strengths
- Favorable debt to equity at 0.31 and debt to assets at 19.57%
- Attractive dividend yield at 4.75%
- Broad geographic reach with significant Asia Pacific and U.S. presence
- Reasonable valuation metrics with PB at 0.57
Linde plc Weaknesses
- Unfavorable liquidity ratios: current ratio 0.89, quick ratio 0.76
- High P/E and P/B ratios suggest expensive valuation
- Low asset turnover at 0.41 limits operational efficiency
- Neutral ROIC of 9.19% close to WACC, limiting value creation
DuPont de Nemours Weaknesses
- Low profitability with 5.68% net margin and 3.01% ROE
- ROIC below WACC at 3.54% signals weak capital returns
- Neutral to unfavorable asset turnover at 0.34
- Moderate interest coverage at 4.26 raises caution on debt servicing
Overall, Linde exhibits strong profitability and capital structure but faces liquidity and valuation challenges. DuPont shows financial prudence and dividend strength but struggles with profitability and capital efficiency. These factors shape their strategic focus areas in competitive markets.
The Moat Duel: Analyzing Competitive Defensibility
A structural moat is the only shield protecting long-term profits from relentless competition erosion. Let’s dissect the competitive defenses of these two chemical giants:
Linde plc: Engineering Scale and Intangible Assets Moat
Linde’s moat stems from its vast industrial gas infrastructure and proprietary process technologies. This manifests in high ROIC growth and stable 20%+ net margins. Expansion into hydrogen and carbon capture markets in 2026 could deepen its moat.
DuPont de Nemours, Inc.: Innovation-Driven Specialty Materials Moat
DuPont leverages advanced materials innovation and diversified end-markets, contrasting with Linde’s infrastructure moat. It exhibits improving profitability with a 12.6% EBIT margin surge and strong EPS growth. New electronics and water solutions could disrupt markets ahead.
Verdict: Infrastructure Scale vs. Innovation Agility
Linde holds a wider moat through its capital-intensive, hard-to-replicate infrastructure and growing profitability. DuPont’s innovation-driven moat is promising but narrower and less capital protected. Linde is better equipped to defend market share over the long haul.
Which stock offers better returns?
The past year shows contrasting price dynamics: Linde plc’s stock fell 4.27% with accelerating bearish momentum, while DuPont de Nemours surged 52.12%, sustaining strong bullish acceleration.
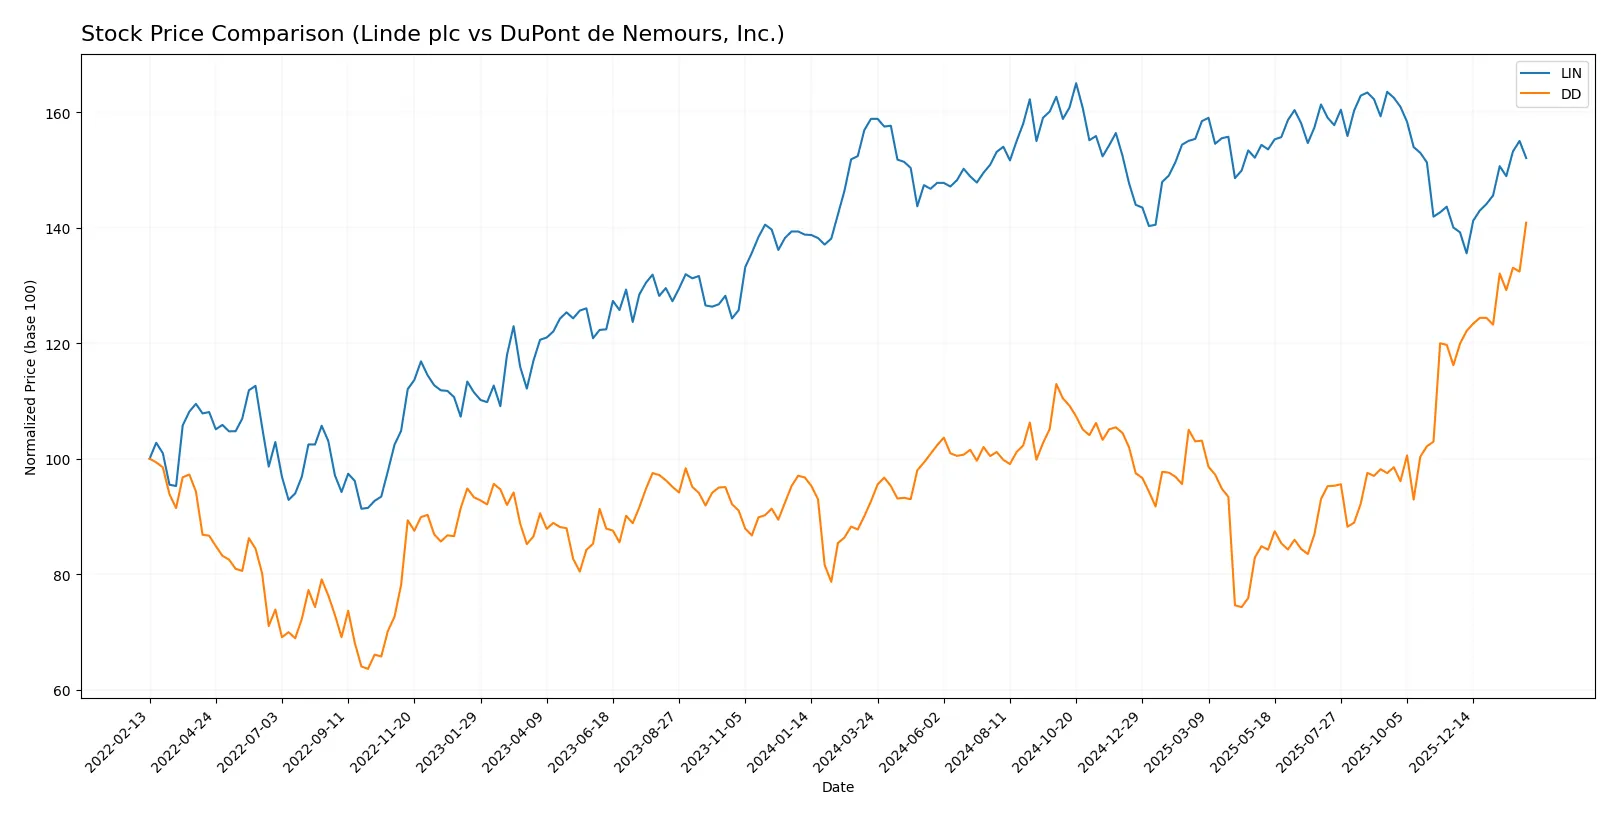
Trend Comparison
Linde plc’s stock declined 4.27% over the past 12 months, marking a bearish trend with accelerating downward momentum and a high volatility level (19.05 std deviation). The price ranged between 399.57 and 486.45.
DuPont de Nemours, Inc. gained 52.12% in the same period, displaying a bullish trend with accelerating gains and significantly lower volatility (4.17 std deviation). Prices fluctuated from 24.64 to 46.73.
DuPont de Nemours outperformed Linde plc with a strong bullish trend versus Linde’s bearish decline, delivering the highest market performance over the past year.
Target Prices
The current target price consensus reveals a bullish outlook for Linde plc, while DuPont de Nemours, Inc. shows a more cautious stance.
| Company | Target Low | Target High | Consensus |
|---|---|---|---|
| Linde plc | 490 | 550 | 516 |
| DuPont de Nemours | 44 | 107 | 55.5 |
Analysts expect Linde’s shares to appreciate from the current 448.24 to a consensus near 516, signaling confidence above market price. DuPont’s wide target range and consensus near 55.5 suggest uncertainty, with upside potential from the 46.73 current price.

Don’t Let Luck Decide Your Entry Point
Optimize your entry points with our advanced ProRealTime indicators. You’ll get efficient buy signals with precise price targets for maximum performance. Start outperforming now!
How do institutions grade them?
The following tables summarize recent institutional grades for Linde plc and DuPont de Nemours, Inc.:
Linde plc Grades
This table shows the latest grades assigned by reputable financial institutions:
| Grading Company | Action | New Grade | Date |
|---|---|---|---|
| Citigroup | Maintain | Buy | 2026-02-06 |
| UBS | Maintain | Buy | 2026-02-06 |
| JP Morgan | Downgrade | Neutral | 2026-02-06 |
| Citigroup | Maintain | Buy | 2026-01-21 |
| RBC Capital | Maintain | Outperform | 2025-12-12 |
| UBS | Upgrade | Buy | 2025-11-11 |
| RBC Capital | Maintain | Outperform | 2025-11-06 |
| JP Morgan | Maintain | Overweight | 2025-11-03 |
| Seaport Global | Upgrade | Buy | 2025-11-03 |
| Citigroup | Maintain | Buy | 2025-11-03 |
DuPont de Nemours, Inc. Grades
This table presents recent grades from leading grading firms:
| Grading Company | Action | New Grade | Date |
|---|---|---|---|
| Citigroup | Maintain | Buy | 2026-01-21 |
| JP Morgan | Maintain | Overweight | 2026-01-16 |
| Keybanc | Maintain | Overweight | 2026-01-09 |
| UBS | Maintain | Buy | 2026-01-07 |
| Mizuho | Maintain | Outperform | 2025-12-18 |
| RBC Capital | Maintain | Outperform | 2025-11-18 |
| Wells Fargo | Maintain | Overweight | 2025-11-07 |
| UBS | Maintain | Buy | 2025-11-07 |
| Keybanc | Maintain | Overweight | 2025-11-07 |
| UBS | Maintain | Buy | 2025-11-05 |
Which company has the best grades?
Both companies receive strong institutional support with mostly Buy, Outperform, and Overweight ratings. Linde shows some recent downgrades to Neutral but maintains several Buy and Outperform grades. DuPont consistently holds Overweight and Outperform ratings without downgrades. Investors may view DuPont as having steadier institutional confidence, which can influence market sentiment and valuation stability.
Risks specific to each company
The following categories identify the critical pressure points and systemic threats facing both firms in the 2026 market environment:
1. Market & Competition
Linde plc
- Operates globally with a strong industrial gas niche, facing intense competition but benefits from durable contracts and high switching costs.
DuPont de Nemours, Inc.
- Diversified specialty chemicals focus exposes it to fierce competition across segments, with pressure from innovation and pricing volatility.
2. Capital Structure & Debt
Linde plc
- Moderate leverage (D/E 0.59) with strong interest coverage (42.6x), but unfavorable liquidity ratios raise short-term risk concerns.
DuPont de Nemours, Inc.
- Lower leverage (D/E 0.31) and adequate liquidity provide financial flexibility, though interest coverage is weaker (4.26x), signaling tighter debt servicing capacity.
3. Stock Volatility
Linde plc
- Beta of 0.85 indicates below-market volatility, suggesting relative stability during market swings.
DuPont de Nemours, Inc.
- Beta of 1.16 shows higher sensitivity to market fluctuations, implying greater price volatility risk for investors.
4. Regulatory & Legal
Linde plc
- Operates in multiple jurisdictions with complex environmental regulations, increasing compliance costs and potential legal exposure.
DuPont de Nemours, Inc.
- Faces regulatory scrutiny especially in chemical safety and environmental impact, adding to operational risk and potential liabilities.
5. Supply Chain & Operations
Linde plc
- Global supply chain complexity and reliance on raw materials create vulnerability to disruptions and cost inflation.
DuPont de Nemours, Inc.
- Diverse operations across segments expose it to supply chain bottlenecks and operational inefficiencies impacting margins.
6. ESG & Climate Transition
Linde plc
- Strong focus on industrial gas solutions aligns with energy transition trends, offering a strategic ESG advantage.
DuPont de Nemours, Inc.
- ESG challenges persist due to chemical manufacturing’s carbon footprint and evolving regulatory expectations.
7. Geopolitical Exposure
Linde plc
- Significant exposure to Europe, Asia Pacific, and Americas subjects it to geopolitical tensions and trade policy shifts.
DuPont de Nemours, Inc.
- US-based but with global operations, faces risks from international trade disputes and regulatory divergence.
Which company shows a better risk-adjusted profile?
Linde’s largest risk lies in liquidity constraints despite strong earnings and debt coverage. DuPont struggles with profitability and financial distress signals, reflected in its Altman Z-score in the distress zone. Linde’s stable market position and lower volatility grant it a superior risk-adjusted profile. The recent Altman Z-score of 3.84 for Linde confirms financial resilience, while DuPont’s 0.44 signals urgent solvency concerns. Investors should weigh Linde’s short-term liquidity risks against DuPont’s deeper fundamental weaknesses.
Final Verdict: Which stock to choose?
Linde plc’s superpower lies in its capacity to generate strong profitability and steadily growing returns, signaling improving operational efficiency. However, its low liquidity ratios warrant caution as a potential stress point. It fits well within portfolios targeting steady, long-term growth with some tolerance for cyclical risk.
DuPont de Nemours offers a strategic moat through its diversified product portfolio and attractive dividend yield, providing a cushion of income and relative stability. Compared to Linde, it appears less growth-oriented but with a lower valuation and financial leverage, suiting investors who prefer balanced risk with income potential.
If you prioritize sustained profitability and improving operational metrics, Linde outshines as the compelling choice due to its growing returns and solid income statement. However, if you seek income with a more conservative risk profile, DuPont offers better stability and valuation appeal, despite its slower growth trajectory. Each represents an analytical scenario tailored to distinct investor strategies.
Disclaimer: Investment carries a risk of loss of initial capital. The past performance is not a reliable indicator of future results. Be sure to understand risks before making an investment decision.
Go Further
I encourage you to read the complete analyses of Linde plc and DuPont de Nemours, Inc. to enhance your investment decisions: