Home > Comparison > Basic Materials > ECL vs DD
The strategic rivalry between Ecolab Inc. and DuPont de Nemours, Inc. shapes the landscape of the specialty chemicals sector. Ecolab operates as a diversified provider of water, hygiene, and infection prevention solutions, while DuPont focuses on technology-driven materials for electronics, mobility, and water protection. This head-to-head contrasts a service-oriented model against a technology materials powerhouse. This analysis aims to identify which trajectory offers superior risk-adjusted returns for a diversified portfolio.
Table of contents
Companies Overview
Ecolab Inc. and DuPont de Nemours, Inc. stand as pivotal players in the specialty chemicals industry with distinct market footprints.
Ecolab Inc.: Leader in Water, Hygiene, and Infection Prevention Solutions
Ecolab Inc. dominates through its comprehensive service model spanning water treatment, hygiene, and infection prevention. Its revenues stem from diverse industrial and institutional segments, including manufacturing, food processing, and healthcare. In 2026, Ecolab emphasizes integrated solutions combining premium products with real-time data management to optimize water and energy use.
DuPont de Nemours, Inc.: Innovator in Technology-Based Materials
DuPont centers on advanced materials and specialty chemicals serving electronics, mobility, and water protection markets globally. Its core revenue derives from engineered materials for semiconductors, industrial applications, and safety systems. The firm’s recent strategy focuses on expanding high-performance materials for renewable energy and transportation sectors.
Strategic Collision: Similarities & Divergences
Both companies excel in specialty chemicals but diverge in approach: Ecolab offers service-driven, end-to-end solutions while DuPont pursues technology-enabled materials innovation. Their primary battleground is industrial and environmental applications where efficiency and sustainability are critical. Ecolab’s model suits steady institutional demand, while DuPont targets growth via high-tech sectors, creating distinct investment profiles.
Income Statement Comparison
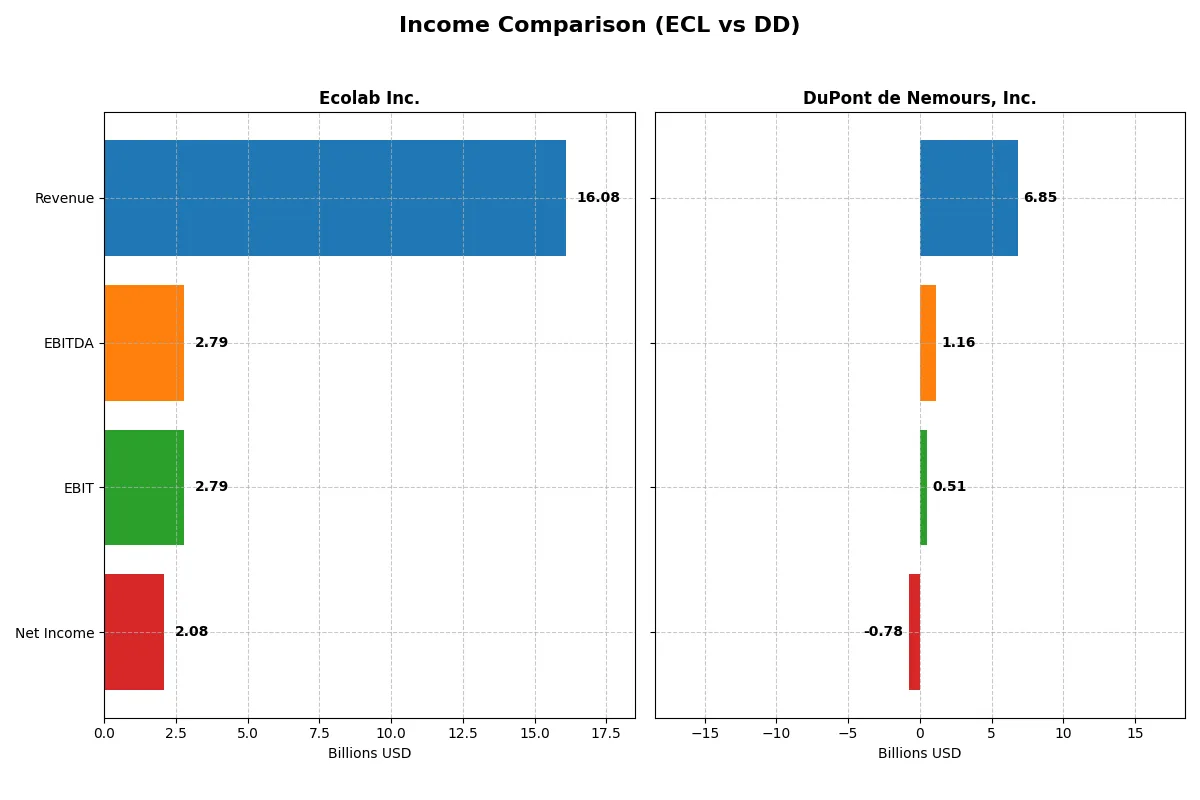
This data dissects the core profitability and scalability of both corporate engines to reveal who dominates the bottom line:
| Metric | Ecolab Inc. (ECL) | DuPont de Nemours, Inc. (DD) |
|---|---|---|
| Revenue | 16.1B | 6.8B |
| Cost of Revenue | 8.9B | 4.8B |
| Operating Expenses | 4.2B | 1.2B |
| Gross Profit | 7.2B | 2.1B |
| EBITDA | 2.8B | 1.2B |
| EBIT | 2.8B | 513M |
| Interest Expense | 241M | 313M |
| Net Income | 2.1B | -779M |
| EPS | 7.33 | -1.87 |
| Fiscal Year | 2025 | 2025 |
Income Statement Analysis: The Bottom-Line Duel
This income statement comparison reveals which company converts revenue into profit most efficiently and sustains financial health over time.
Ecolab Inc. Analysis
Ecolab’s revenue climbed steadily from 12.7B in 2021 to 16.1B in 2025, with net income nearly doubling from 1.13B to 2.08B. Its gross margin remains strong at 44.5%, supporting a solid net margin of 12.9%. Despite a slight dip in EBIT and EPS growth over the last year, the company shows robust long-term profit expansion and disciplined cost management.
DuPont de Nemours, Inc. Analysis
DuPont’s revenue fell sharply from 12.6B in 2021 to 6.8B in 2025, driven by a major net loss of 779M in 2025 following a volatile period. Gross margin at 30.3% is moderate, but net margin sank to -11.4%, reflecting operational challenges. The company struggles with declining profitability and a steep drop in earnings growth, signaling significant efficiency and momentum issues.
Margin Strength vs. Revenue Decline
Ecolab clearly outperforms DuPont with consistent revenue growth, healthy margins, and profit momentum. DuPont’s shrinking top line and negative net income highlight structural difficulties. For investors prioritizing stable earnings and margin resilience, Ecolab’s profile offers a superior fundamental foundation.
Financial Ratios Comparison
These vital ratios act as a diagnostic tool to expose the underlying fiscal health, valuation premiums, and capital efficiency of the companies compared below:
| Ratios | Ecolab Inc. (ECL) | DuPont de Nemours, Inc. (DD) |
|---|---|---|
| ROE | 21.2% | -5.6% |
| ROIC | 11.2% | 2.2% |
| P/E | 35.8 | -21.5 |
| P/B | 7.61 | 1.21 |
| Current Ratio | 1.08 | 2.42 |
| Quick Ratio | 0.81 | 1.91 |
| D/E | 0.90 | 0.23 |
| Debt-to-Assets | 35.8% | 14.8% |
| Interest Coverage | 11.4 | 2.75 |
| Asset Turnover | 0.65 | 0.32 |
| Fixed Asset Turnover | 3.19 | 1.98 |
| Payout Ratio | 36.6% | -76.6% |
| Dividend Yield | 1.02% | 3.56% |
| Fiscal Year | 2025 | 2025 |
Efficiency & Valuation Duel: The Vital Signs
Financial ratios serve as a company’s DNA, revealing hidden risks and operational excellence that numbers alone cannot convey.
Ecolab Inc.
Ecolab exhibits strong profitability with a 21.24% ROE and a 12.91% net margin, signaling operational efficiency. However, its valuation appears stretched, with a high P/E of 35.83 and a P/B of 7.61. The company balances this with a modest 1.02% dividend yield, reflecting a cautious shareholder return strategy amid reinvestment for growth.
DuPont de Nemours, Inc.
DuPont shows weak profitability, posting a -5.6% ROE and negative net margin of -11.37%, indicating operational challenges. Yet, its valuation metrics are attractive, with a low P/B of 1.21 and a negative P/E reflecting losses. DuPont offers a higher dividend yield of 3.56%, compensating shareholders despite operational headwinds.
Premium Valuation vs. Operational Safety
Ecolab delivers superior profitability but trades at a premium, exposing investors to valuation risk. DuPont’s lower valuation and higher dividend yield come with profitability concerns. Investors seeking operational strength may prefer Ecolab, while income-focused investors might consider DuPont’s dividend profile despite its risks.
Which one offers the Superior Shareholder Reward?
I compare Ecolab Inc. (ECL) and DuPont de Nemours, Inc. (DD) on dividends, payout ratios, and buybacks. ECL yields ~1.02% with a sustainable 36.6% payout, backed by solid free cash flow. DD’s yield is higher at ~3.56%, but with negative net income in 2025 and an unsustainable payout ratio. ECL’s consistent buybacks amplify returns, while DD’s modest share repurchases are overshadowed by earnings volatility. I conclude ECL offers a more reliable total return profile for 2026 investors seeking steady income and growth.
Comparative Score Analysis: The Strategic Profile
The radar chart reveals the fundamental DNA and trade-offs of Ecolab Inc. and DuPont de Nemours, Inc., highlighting their strategic strengths and weaknesses:
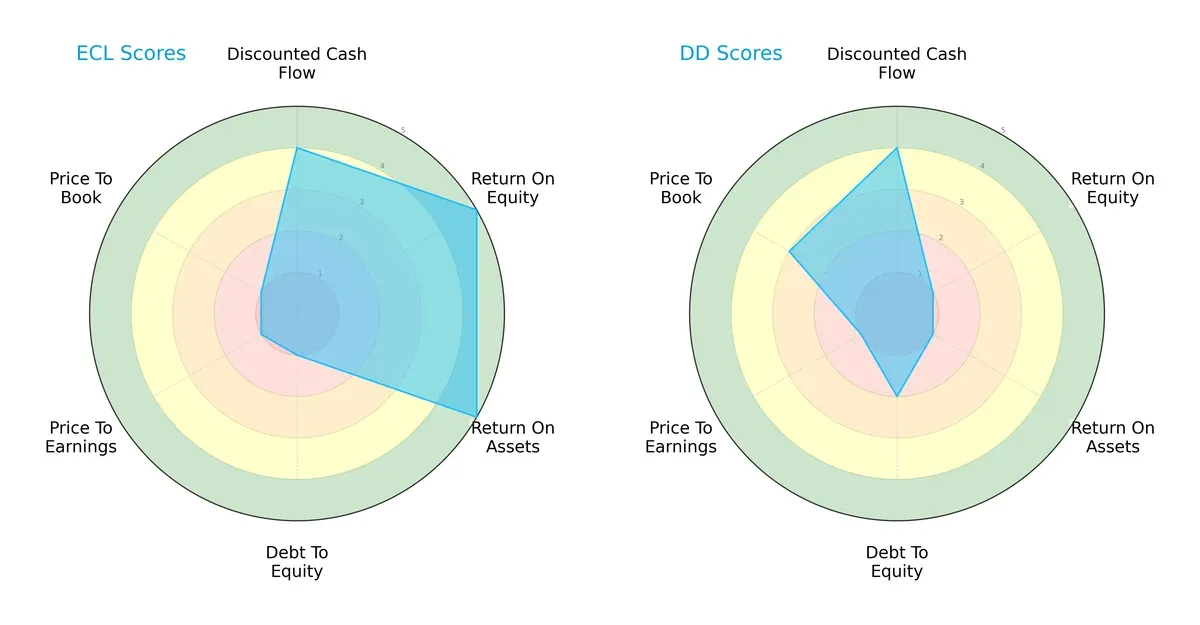
Ecolab shows a balanced profile with strong ROE (5) and ROA (5) scores, signaling efficient profit and asset use. However, it carries heavy financial risk with a very unfavorable debt-to-equity score (1) and valuation metrics (P/E and P/B at 1). DuPont relies on a specific edge in discounted cash flow (4) but suffers from weak profitability (ROE and ROA at 1) and moderate financial leverage risk (debt-to-equity at 2). Overall, Ecolab offers higher operational efficiency, while DuPont’s profile signals caution due to profitability and valuation weaknesses.
—
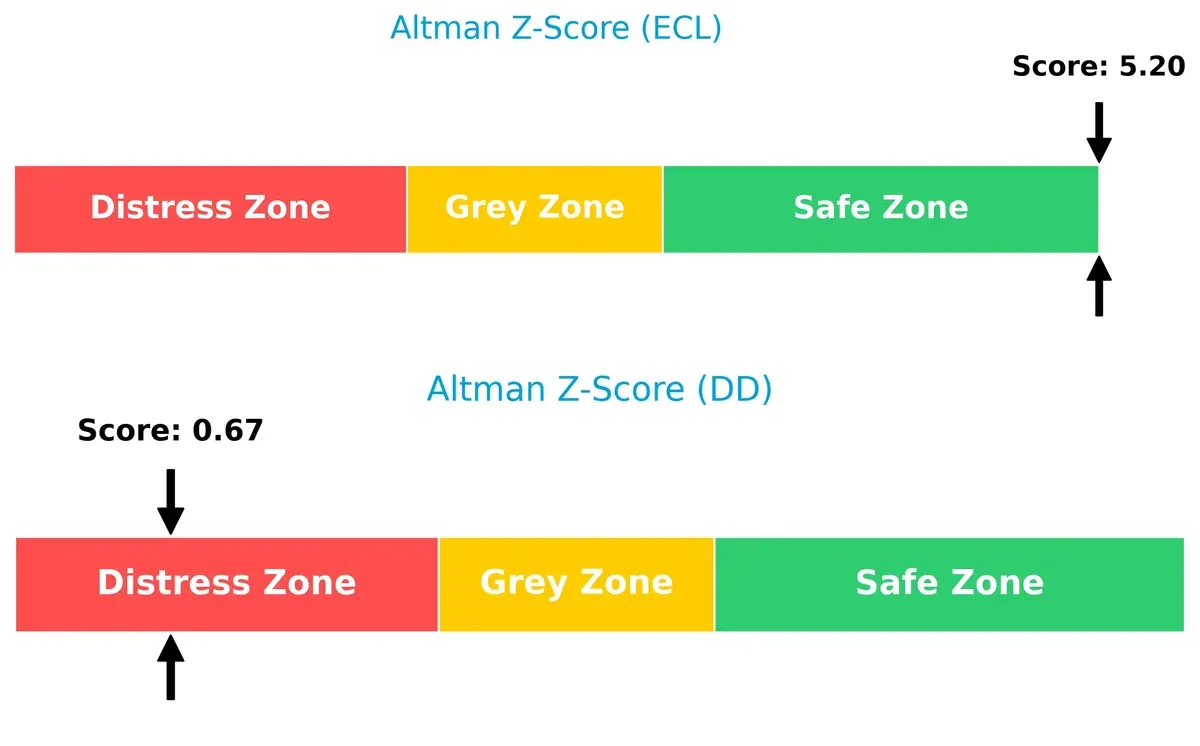
Bankruptcy Risk: Solvency Showdown
Ecolab’s Altman Z-Score of 5.2 places it firmly in the safe zone, indicating strong long-term survival prospects. DuPont’s score of 0.7 flags high bankruptcy risk in the current cycle:
—
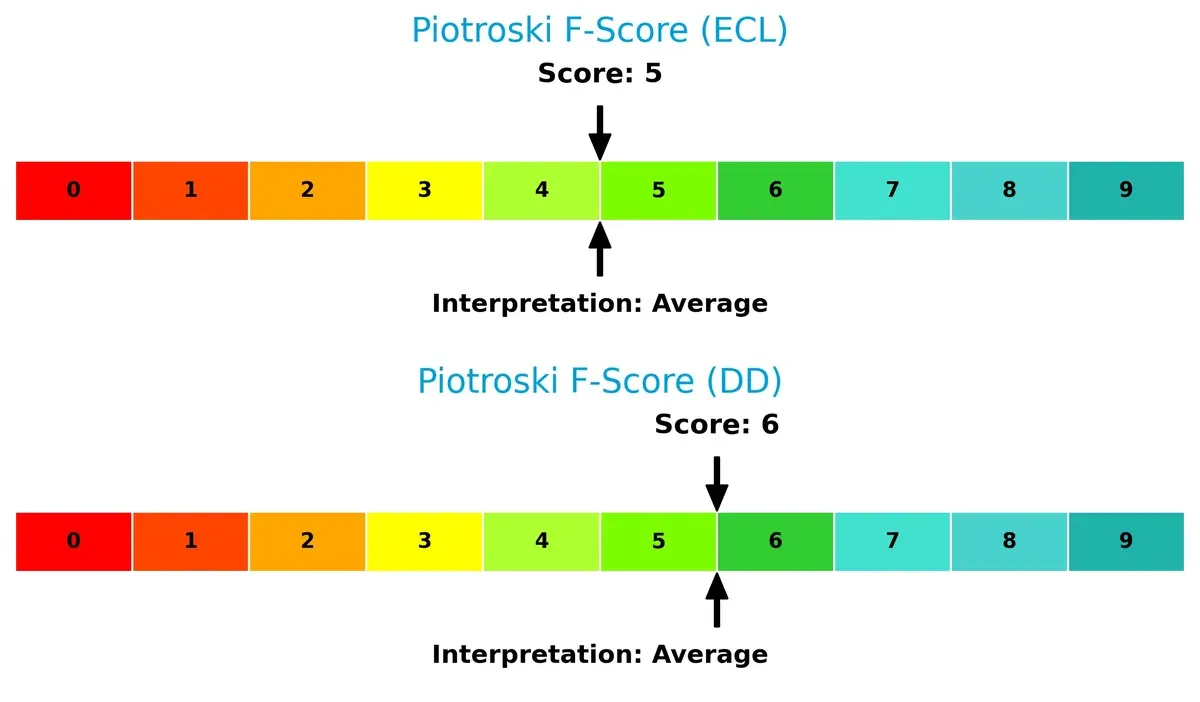
Financial Health: Quality of Operations
Both companies show average Piotroski F-Scores: Ecolab scores 5, DuPont 6. Neither achieves peak financial health, but DuPont’s slightly higher score suggests marginally better internal metrics without clear red flags:
How are the two companies positioned?
This section dissects the operational DNA of Ecolab and DuPont by comparing their revenue distribution and internal dynamics. The goal is to confront their economic moats to reveal which model delivers the most resilient competitive advantage today.
Revenue Segmentation: The Strategic Mix
This comparison dissects how Ecolab Inc. and DuPont de Nemours, Inc. diversify their income streams and where their primary sector bets lie:
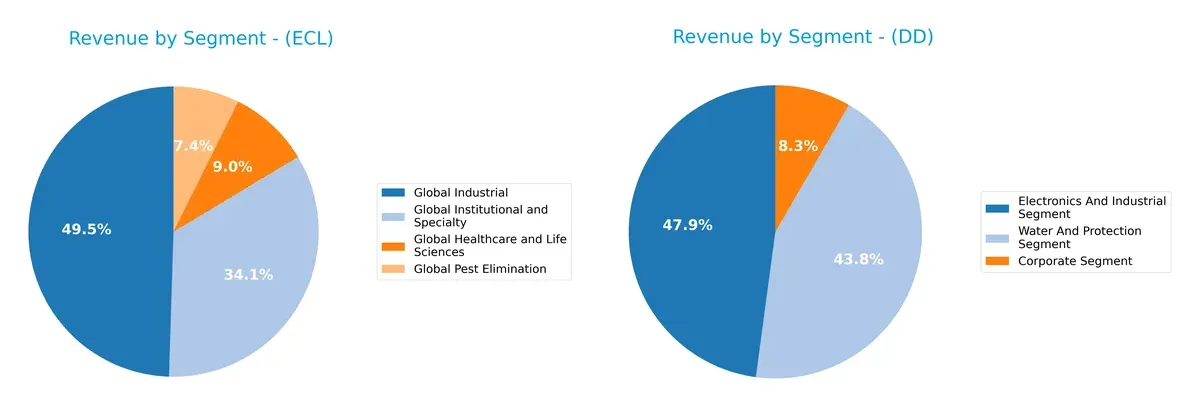
Ecolab anchors its revenue in Global Industrial ($7.9B) and Global Institutional and Specialty ($5.4B), showing a moderately diversified portfolio. DuPont pivots between Electronics and Industrial ($5.9B) and Water and Protection ($5.4B), with a smaller Corporate segment ($1B). Ecolab’s concentration in industrial services suggests ecosystem lock-in, while DuPont balances infrastructure and protection, reducing single-segment risk but exposing itself to cyclical demand shifts.
Strengths and Weaknesses Comparison
This table compares the Strengths and Weaknesses of Ecolab Inc. and DuPont de Nemours, Inc.:
Ecolab Strengths
- Diversified product segments including Industrial, Healthcare, and Pest Elimination
- Favorable profitability ratios: net margin 12.91%, ROE 21.24%, ROIC 11.23%
- Strong fixed asset turnover at 3.19
- Global presence with significant US and Europe revenues
DuPont Strengths
- Favorable valuation metrics: PE and PB ratios
- Strong liquidity with current ratio 2.42 and quick ratio 1.91
- Low leverage: debt-to-assets 14.8%, D/E 0.23
- Higher dividend yield at 3.56%
- Diversified business segments in Electronics, Water, and Corporate
Ecolab Weaknesses
- Unfavorable valuation multiples: PE 35.83, PB 7.61
- Neutral liquidity ratios: current ratio 1.08, quick ratio 0.81
- Moderate debt level: debt-to-assets 35.77%
- Asset turnover somewhat low at 0.65
DuPont Weaknesses
- Negative profitability metrics: net margin -11.37%, ROE -5.6%, ROIC 2.18%
- Weak interest coverage at 1.64
- Low asset turnover at 0.32
- Limited geographic revenue outside Asia Pacific and U.S. & Canada
Ecolab demonstrates robust profitability and asset efficiency but faces valuation and liquidity caution. DuPont shows strong balance sheet health and valuation appeal but struggles with profitability and operational efficiency. These contrasts shape their strategic priorities around growth and financial stability.
The Moat Duel: Analyzing Competitive Defensibility
A structural moat is the only true defense preserving long-term profits against relentless competitive pressures:
Ecolab Inc.: Intangible Assets and Service Integration
Ecolab leverages strong intangible assets and integrated service solutions, reflected in its high ROIC exceeding WACC by 3.4%. Its expanding global hygiene platform deepens this moat in 2026.
DuPont de Nemours, Inc.: Technology-Driven Cost Advantage
DuPont relies on technology innovation for cost advantage but suffers from declining ROIC and negative margin trends. Its shrinking footprint challenges moat sustainability despite niche industrial applications.
Economic Profitability vs. Innovation Efficiency
Ecolab holds a wider, deeper moat with rising ROIC and stable margins. DuPont’s deteriorating profitability and shrinking returns leave it poorly positioned to defend market share.
Which stock offers better returns?
The past year shows stark contrasts in price momentum and trading volumes between Ecolab Inc. and DuPont de Nemours, Inc., highlighting significant bullish trends with accelerating gains.
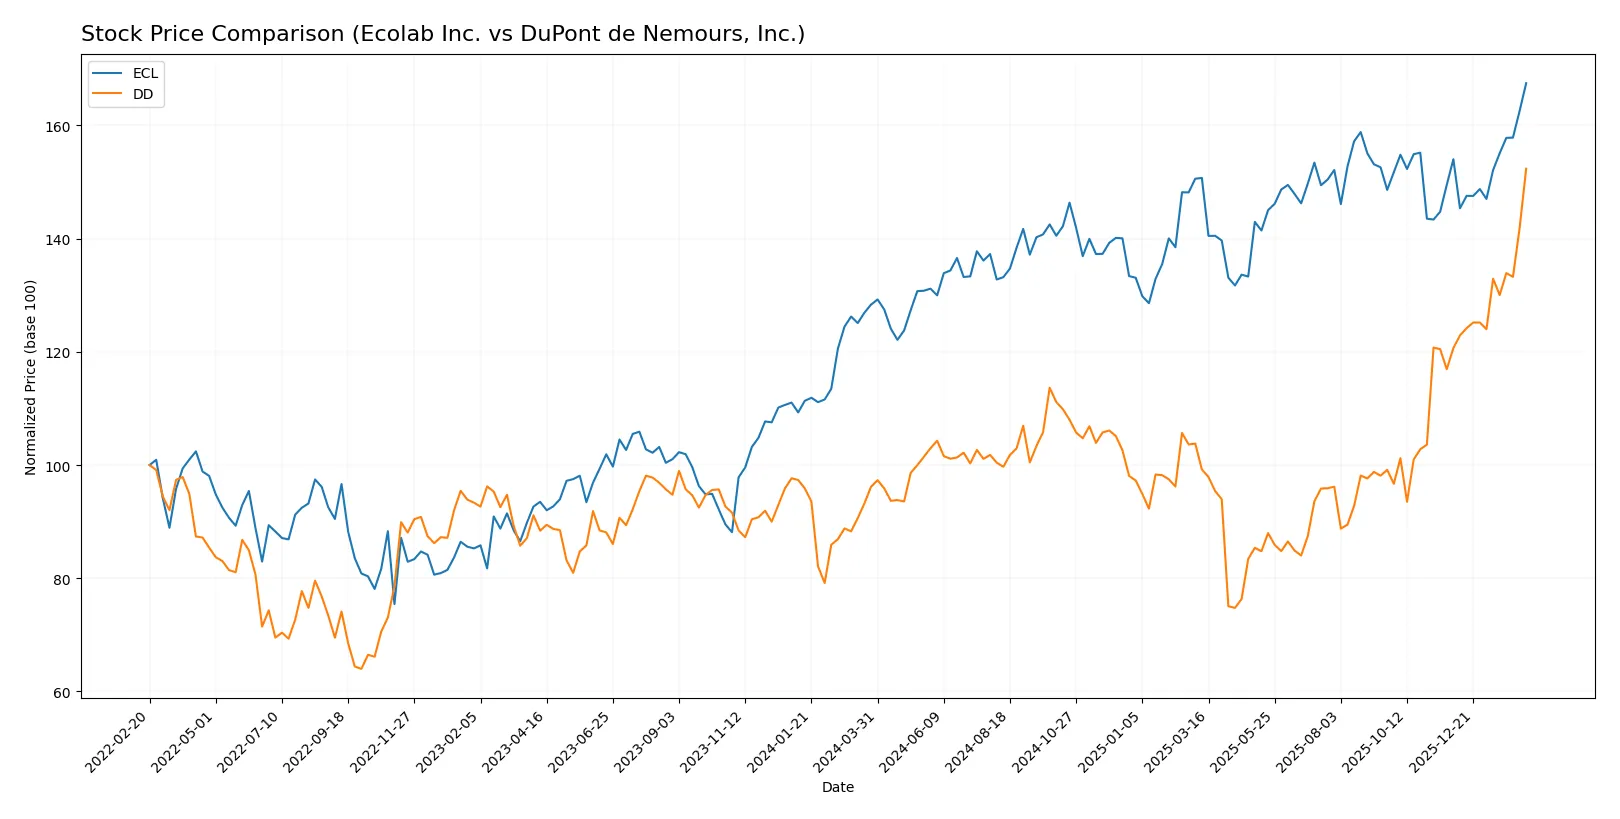
Trend Comparison
Ecolab Inc. posted a 30.49% price increase over 12 months, marking a bullish trend with accelerating momentum and high volatility (16.82% std deviation). The stock peaked at 299.17 and bottomed at 218.16.
DuPont de Nemours, Inc. delivered a stronger 58.47% price gain over the same period, also bullish with acceleration but lower volatility (4.48% std deviation). Its price ranged between 24.64 and 50.22.
Comparing trends, DuPont outperformed Ecolab with a higher overall return and steadier price movement, signaling superior market performance over the past year.
Target Prices
Analysts present a mixed but cautiously optimistic view for Ecolab Inc. and DuPont de Nemours, Inc.
| Company | Target Low | Target High | Consensus |
|---|---|---|---|
| Ecolab Inc. | 300 | 345 | 325.1 |
| DuPont de Nemours | 46 | 161 | 73.88 |
Ecolab’s target consensus sits about 8.6% above its current price of 299.17, signaling moderate upside potential. DuPont’s wide target range reflects significant analyst uncertainty, with consensus price 47% above the current 50.22, indicating potential volatility ahead.

Don’t Let Luck Decide Your Entry Point
Optimize your entry points with our advanced ProRealTime indicators. You’ll get efficient buy signals with precise price targets for maximum performance. Start outperforming now!
How do institutions grade them?
Ecolab Inc. Grades
The following table summarizes recent institutional grades for Ecolab Inc.:
| Grading Company | Action | New Grade | Date |
|---|---|---|---|
| BNP Paribas | Maintain | Outperform | 2026-02-12 |
| Exane BNP Paribas | Maintain | Outperform | 2026-02-12 |
| JP Morgan | Maintain | Neutral | 2026-02-11 |
| RBC Capital | Maintain | Outperform | 2026-02-11 |
| Citigroup | Maintain | Buy | 2026-02-11 |
| Stifel | Maintain | Buy | 2026-02-11 |
| Jefferies | Maintain | Buy | 2026-02-11 |
| Wells Fargo | Maintain | Equal Weight | 2026-02-11 |
| UBS | Maintain | Neutral | 2026-02-11 |
| Citigroup | Maintain | Buy | 2026-01-21 |
DuPont de Nemours, Inc. Grades
The following table summarizes recent institutional grades for DuPont de Nemours, Inc.:
| Grading Company | Action | New Grade | Date |
|---|---|---|---|
| BMO Capital | Maintain | Outperform | 2026-02-12 |
| Jefferies | Maintain | Buy | 2026-02-11 |
| UBS | Maintain | Buy | 2026-02-11 |
| Wells Fargo | Maintain | Overweight | 2026-02-11 |
| Citigroup | Maintain | Buy | 2026-02-11 |
| Keybanc | Maintain | Overweight | 2026-02-11 |
| Citigroup | Maintain | Buy | 2026-01-21 |
| JP Morgan | Maintain | Overweight | 2026-01-16 |
| Keybanc | Maintain | Overweight | 2026-01-09 |
| UBS | Maintain | Buy | 2026-01-07 |
Which company has the best grades?
Both companies receive predominantly positive grades. Ecolab shows a mix of Outperform and Buy ratings, with some Neutral and Equal Weight. DuPont leans more consistently toward Buy and Overweight ratings. Investors may interpret DuPont’s slightly more bullish consensus as a stronger near-term endorsement.
Risks specific to each company
The following categories identify the critical pressure points and systemic threats facing both firms in the 2026 market environment:
1. Market & Competition
Ecolab Inc.
- Operates globally in water and hygiene solutions, facing competition from specialized chemical firms and innovation shifts.
DuPont de Nemours, Inc.
- Competes in technology-based materials across diverse segments, challenged by rapid innovation and cyclical demand in industrial markets.
2. Capital Structure & Debt
Ecolab Inc.
- Moderate leverage (D/E 0.9) with strong interest coverage (11.57x) signals manageable debt risk.
DuPont de Nemours, Inc.
- Low leverage (D/E 0.23) but weak interest coverage (1.64x) raises concerns about debt servicing under stress.
3. Stock Volatility
Ecolab Inc.
- Beta near 1 (0.99) indicates average market volatility, offering relative stability.
DuPont de Nemours, Inc.
- Higher beta (1.16) suggests more sensitivity to market swings and greater price volatility risk.
4. Regulatory & Legal
Ecolab Inc.
- Exposure to stringent hygiene and environmental regulations in multiple industries.
DuPont de Nemours, Inc.
- Faces complex compliance in chemicals and materials, including environmental liabilities and product safety standards.
5. Supply Chain & Operations
Ecolab Inc.
- Diverse supply chain supporting multiple industries but vulnerable to raw material cost fluctuations.
DuPont de Nemours, Inc.
- Reliant on advanced materials manufacturing, supply chain disruptions could impact production and margins significantly.
6. ESG & Climate Transition
Ecolab Inc.
- Positioned to benefit from water efficiency and hygiene innovation amid rising ESG demands.
DuPont de Nemours, Inc.
- Faces pressure to innovate in sustainable materials; transition costs could affect near-term profitability.
7. Geopolitical Exposure
Ecolab Inc.
- Global operations expose it to trade tensions and regional instability risks.
DuPont de Nemours, Inc.
- Broad geographic footprint with particular sensitivity to U.S.-China trade dynamics and supply chain shifts.
Which company shows a better risk-adjusted profile?
Ecolab’s primary risk lies in market competition and valuation premiums, but its strong financial health and interest coverage mitigate distress risks. DuPont struggles with profitability and debt servicing, reflected in its distress zone Altman Z-score and negative margins. Ecolab’s balance of moderate leverage, strong cash flow, and operational diversity offers a superior risk-adjusted profile in 2026’s volatile environment.
Final Verdict: Which stock to choose?
Ecolab Inc. (ECL) stands out as a cash-generating powerhouse with a durable competitive edge, evidenced by its growing ROIC comfortably above WACC. Its main point of vigilance lies in valuation metrics that appear stretched relative to peers. ECL suits portfolios seeking steady, long-term value creation within an aggressive growth framework.
DuPont de Nemours, Inc. (DD) offers a strategic moat grounded in asset-light operations and a strong liquidity buffer, reflected by a healthy current ratio and low leverage. It presents a more conservative risk profile than Ecolab but struggles with declining profitability and value destruction. DD may fit investors favoring GARP strategies who tolerate volatility for potential turnaround opportunities.
If you prioritize sustainable value creation and proven capital efficiency, Ecolab outshines with its consistent profitability and robust economic moat. However, if you seek a speculative play with a defensive balance sheet and possible rebound potential, DuPont offers better stability but commands careful risk assessment given its erosion of returns.
Disclaimer: Investment carries a risk of loss of initial capital. The past performance is not a reliable indicator of future results. Be sure to understand risks before making an investment decision.
Go Further
I encourage you to read the complete analyses of Ecolab Inc. and DuPont de Nemours, Inc. to enhance your investment decisions: