Home > Comparison > Utilities > DUK vs XEL
The strategic rivalry between Duke Energy Corporation and Xcel Energy Inc. shapes the future of the regulated electric utilities sector. Duke operates as a capital-intensive giant with broad geographic reach and diverse energy sources, while Xcel emphasizes a leaner model focused on renewable integration and natural gas. This head-to-head reflects a contest between scale and modernization. This analysis will identify which company offers superior risk-adjusted returns for a balanced utility portfolio.
Table of contents
Companies Overview
Duke Energy and Xcel Energy both play pivotal roles in the U.S. regulated electric utility market.
Duke Energy Corporation: A Powerhouse in Diverse Energy Generation
Duke Energy dominates the Southeast and Midwest with a diverse energy portfolio including coal, nuclear, natural gas, and renewables. Its core revenue stream is the generation, transmission, and distribution of electricity to 8.2M customers. In 2026, Duke prioritizes expanding its commercial renewables segment, operating 23 wind and 178 solar facilities, reflecting a strategic shift toward cleaner energy sources.
Xcel Energy Inc.: A Renewable-Focused Utility Leader
Xcel Energy commands a strong presence in eight states, serving 3.7M electricity and 2.1M natural gas customers. Its revenue engine combines regulated electric and natural gas utilities with renewable energy development. In 2026, Xcel sharpens its strategic focus on integrating renewable generation and natural gas infrastructure, emphasizing sustainability while maintaining broad energy service offerings.
Strategic Collision: Similarities & Divergences
Both companies embrace regulated electric utilities with growing renewable portfolios but differ in scale and regional focus. Duke’s footprint spans a larger customer base and a wider mix of generation assets, while Xcel emphasizes a balanced approach between renewables and natural gas in a more concentrated geography. Their battle for market share centers on renewable expansion and grid modernization. Each offers distinct risk and growth profiles shaped by scale and regional dynamics.
Income Statement Comparison
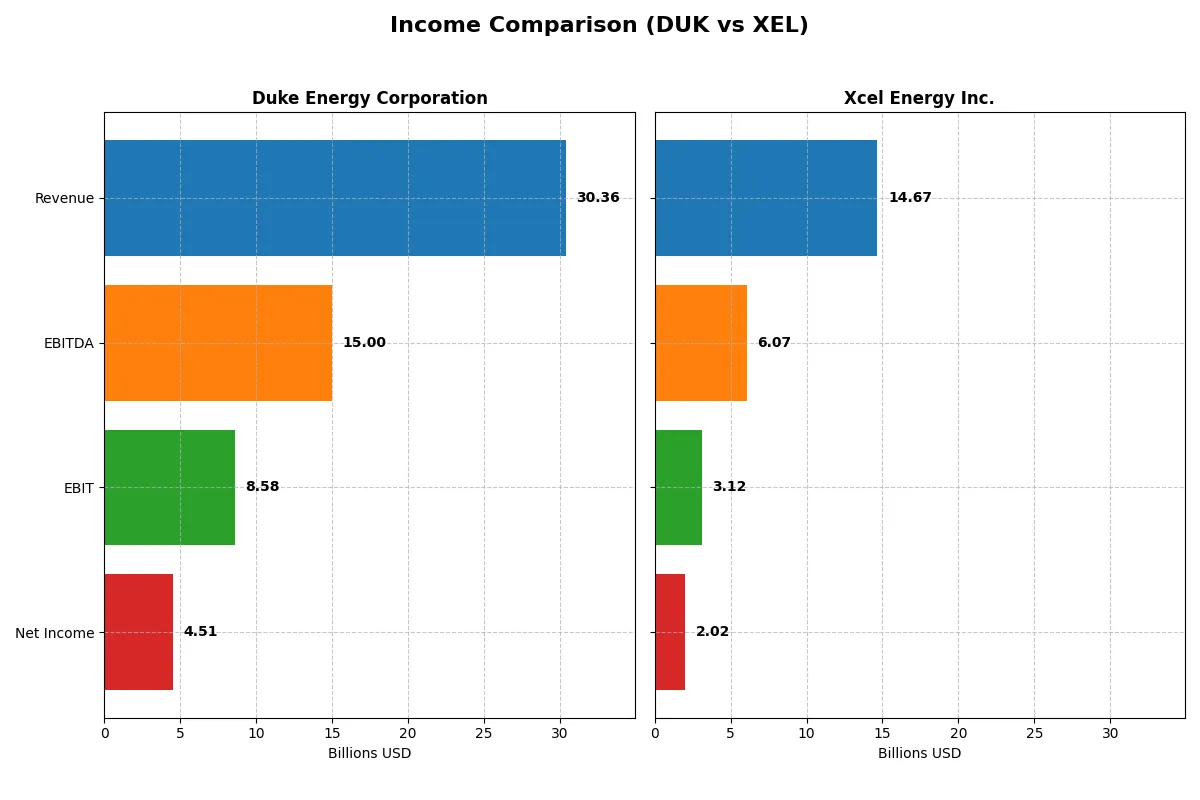
This data dissects the core profitability and scalability of both corporate engines to reveal who dominates the bottom line:
| Metric | Duke Energy Corporation (DUK) | Xcel Energy Inc. (XEL) |
|---|---|---|
| Revenue | 30.4B | 13.4B |
| Cost of Revenue | 15.2B | 7.3B |
| Operating Expenses | 7.3B | 3.8B |
| Gross Profit | 15.2B | 6.1B |
| EBITDA | 15.0B | 5.6B |
| EBIT | 8.6B | 2.7B |
| Interest Expense | 3.4B | 1.2B |
| Net Income | 4.5B | 1.9B |
| EPS | 5.71 | 3.44 |
| Fiscal Year | 2024 | 2024 |
Income Statement Analysis: The Bottom-Line Duel
This income statement comparison reveals the true efficiency and profitability of Duke Energy Corporation and Xcel Energy Inc.’s business models.
Duke Energy Corporation Analysis
Duke Energy’s revenue grew steadily from 23.4B in 2020 to 30.4B in 2024, with net income surging from 1.4B to 4.5B over the same period. Its gross margin holds strong at 50%, demonstrating operational control. The 2024 net margin of 14.9% signals solid profitability, supported by a 10% EBIT growth, reflecting efficient cost management despite rising interest expenses.
Xcel Energy Inc. Analysis
Xcel Energy’s revenue increased modestly from 13.4B in 2021 to 14.7B in 2025, while net income climbed from 1.6B to 2.0B. Gross margin stands at 24.3%, significantly lower than Duke’s, but EBIT margin at 21.2% confirms respectable operational efficiency. However, a 42% drop in gross profit growth in 2025 dampens momentum, alongside a slight contraction in net margin and EPS growth.
Margin Strength vs. Growth Resilience
Duke Energy demonstrates superior margin power and robust net income growth, nearly tripling earnings since 2020. Xcel Energy offers steady revenue expansion but shows signs of margin pressure and weaker profit momentum. For investors prioritizing profitability and margin stability, Duke’s profile clearly outshines Xcel’s growth resilience.
Financial Ratios Comparison
These vital ratios act as a diagnostic tool to expose the underlying fiscal health, valuation premiums, and capital efficiency of the companies compared below:
| Ratios | Duke Energy Corporation (DUK) | Xcel Energy Inc. (XEL) |
|---|---|---|
| ROE | 9.0% | 9.9% |
| ROIC | 4.0% | 3.6% |
| P/E | 18.4 | 19.6 |
| P/B | 1.66 | 1.95 |
| Current Ratio | 0.67 | 0.67 |
| Quick Ratio | 0.44 | 0.57 |
| D/E | 1.70 | 1.55 |
| Debt-to-Assets | 45.7% | 43.1% |
| Interest Coverage | 2.34 | 2.02 |
| Asset Turnover | 0.16 | 0.19 |
| Fixed Asset Turnover | 0.24 | 0.23 |
| Payout ratio | 71.2% | 60.7% |
| Dividend yield | 3.86% | 3.09% |
| Fiscal Year | 2024 | 2024 |
Efficiency & Valuation Duel: The Vital Signs
Ratios act as the company’s DNA, revealing hidden risks, operational strengths, and valuation nuances investors must decode for informed decisions.
Duke Energy Corporation
Duke Energy posts a moderate ROE of 9.0% with a net margin of 14.86%, signaling decent profitability but below sector leaders. Its P/E of 18.44 is fairly valued, reflecting stable market expectations. The company rewards shareholders with a solid 3.86% dividend yield, balancing income with moderate reinvestment in operations.
Xcel Energy Inc.
Xcel Energy shows a null ROE and ROIC for 2025, indicating possible reporting gaps or underperformance. Its net margin stands at 13.76%, slightly below Duke’s. The P/E ratio at 21.48 suggests a stretched valuation relative to earnings. Xcel maintains a comparable dividend yield near 3.83%, focusing on steady shareholder returns despite operational uncertainties.
Dividend Stability vs. Earnings Efficiency
Duke Energy offers a better blend of profitability and shareholder income, reflected in its efficient margins and consistent dividend yield. Xcel’s lack of key return metrics and higher P/E ratio signal greater risk with less clarity on operational efficiency. Income-focused investors may prefer Duke’s profile, while growth seekers face ambiguity with Xcel.
Which one offers the Superior Shareholder Reward?
I observe that Duke Energy (DUK) offers a higher dividend yield near 3.86% with a payout ratio around 71%, signaling generous distribution but marginal free cash flow cover (0.0039 FCF/OpCF ratio). Its buyback program is less prominent. Xcel Energy (XEL) yields about 3.2% with a lower payout ratio near 62%, indicating more retained earnings for growth or debt reduction. Both have elevated debt levels but Duke’s dividend seems less sustainable given weaker free cash flow. I see Xcel’s balanced dividend with moderate payout and consistent buybacks, supporting a more sustainable total return. For 2026, I favor Xcel Energy for superior long-term shareholder reward due to prudent capital allocation and sustainable distributions.
Comparative Score Analysis: The Strategic Profile
The radar chart reveals the fundamental DNA and trade-offs of Duke Energy Corporation and Xcel Energy Inc., highlighting their distinct financial strengths and weaknesses:
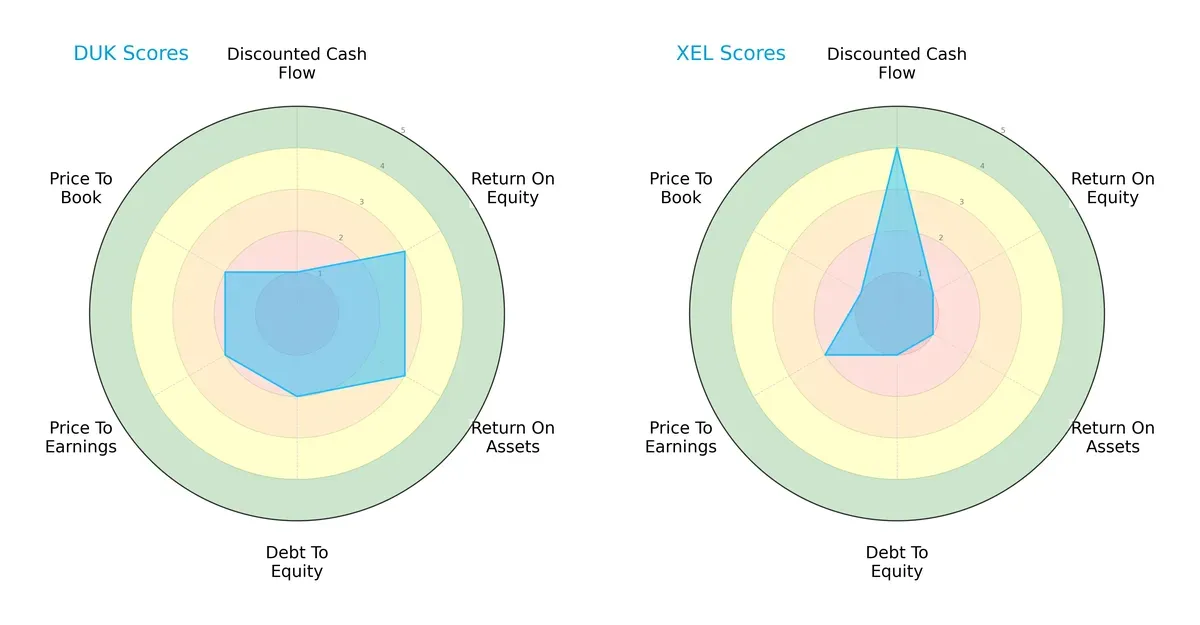
Duke Energy shows balanced moderate scores in profitability (ROE 3, ROA 3) and leverage (Debt/Equity 2), but weak cash flow valuation (DCF 1). Xcel Energy excels in discounted cash flow (DCF 4), signaling good future cash generation, but suffers from very weak profitability (ROE 1, ROA 1) and high leverage risk (Debt/Equity 1). Duke’s profile appears more stable and diversified, while Xcel relies heavily on discounted cash flow strength.
Bankruptcy Risk: Solvency Showdown
Duke’s Altman Z-Score of 0.72 places it in the distress zone, signaling elevated bankruptcy risk in this cycle. Xcel’s score is unavailable, preventing a full solvency comparison:

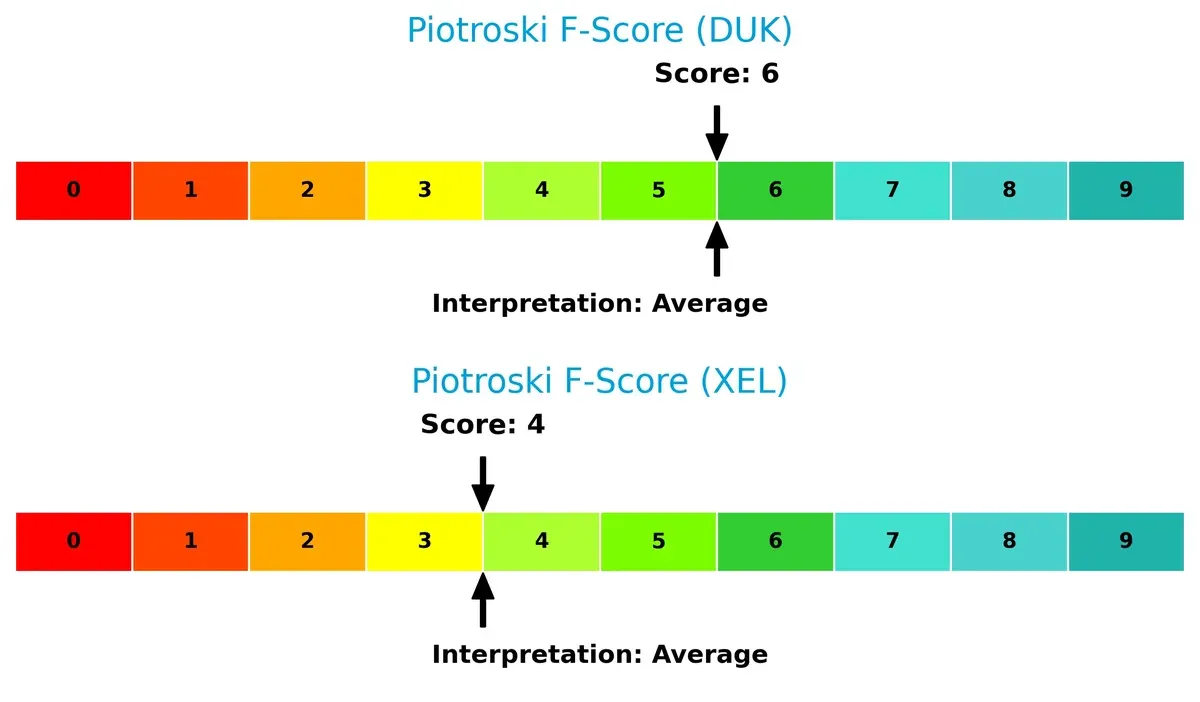
Financial Health: Quality of Operations
Duke scores a 6 on the Piotroski F-Score, indicating average financial health with no immediate red flags. Xcel’s score of 4 reveals a weaker internal metrics profile, suggesting operational challenges compared to Duke:
How are the two companies positioned?
This section dissects the operational DNA of Duke Energy and Xcel Energy by comparing their revenue distribution and internal dynamics, including strengths and weaknesses. Our goal is to confront their economic moats to determine which model offers the most resilient, sustainable competitive advantage today.
Revenue Segmentation: The Strategic Mix
The following visual comparison dissects how Duke Energy Corporation and Xcel Energy Inc. diversify their income streams and where their primary sector bets lie:
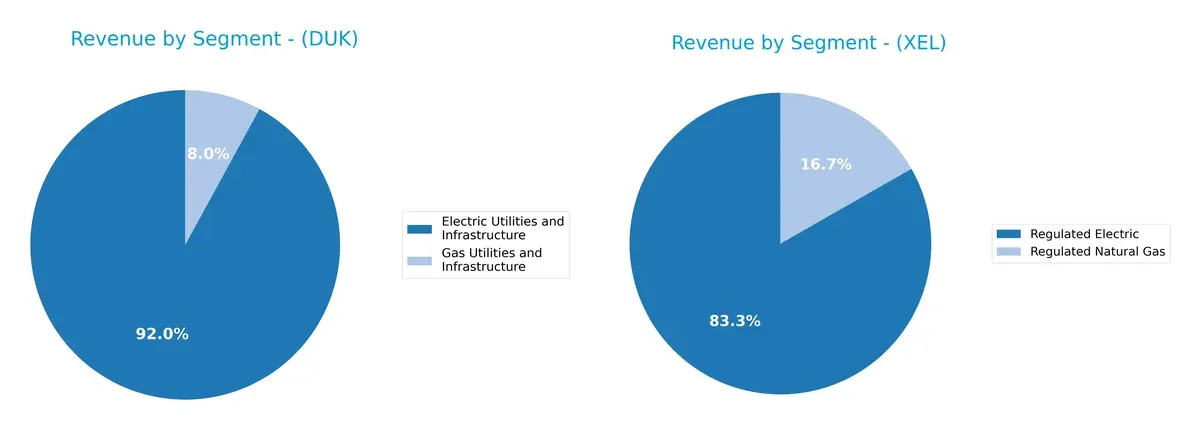
Duke Energy leans heavily on Electric Utilities and Infrastructure, generating around $26.8B in 2024, with Gas Utilities trailing at $2.3B. Xcel Energy shows a similar pattern but with a somewhat larger natural gas segment at $4.5B and electric at $22.3B. Duke’s concentration anchors its infrastructure dominance, while Xcel’s more balanced split reduces single-segment risk and emphasizes regulated energy diversity.
Strengths and Weaknesses Comparison
This table compares the strengths and weaknesses of Duke Energy Corporation and Xcel Energy Inc.:
Duke Energy Corporation Strengths
- Strong electric utilities revenue at $26.8B
- Diversified gas utilities segment
- Favorable net margin of 14.86%
- Favorable weighted average cost of capital at 4.89%
- Stable dividend yield near 3.86%
Xcel Energy Inc. Strengths
- Favorable net margin at 13.76%
- Favorable debt-to-equity and debt-to-assets ratios
- Diversified electric and natural gas regulated segments
- Favorable dividend yield of 3.83%
Duke Energy Corporation Weaknesses
- Unfavorable return on equity at 9.0% and ROIC at 4.02%
- Low current and quick ratios indicate liquidity risk
- High debt-to-equity ratio of 1.7
- Low asset and fixed asset turnover ratios
- Neutral interest coverage ratio of 2.53
Xcel Energy Inc. Weaknesses
- Zero reported ROE and ROIC reflect profitability concerns
- Unavailable WACC data limits cost of capital insight
- Zero current and quick ratios indicate liquidity risk
- Unfavorable asset and fixed asset turnover ratios
- Neutral interest coverage ratio at 2.32
Overall, both companies show solid profitability and dividend yields but face challenges in liquidity and asset efficiency. Duke’s leverage and liquidity metrics warrant caution, while Xcel lacks some key financial data, complicating a full assessment.
The Moat Duel: Analyzing Competitive Defensibility
A structural moat is the only true defense against long-term profit erosion from competition. Let’s dissect the moats of Duke Energy and Xcel Energy:
Duke Energy Corporation: Infrastructure Dominance with Growing Profitability
Duke’s moat stems mainly from its regulated electric utility infrastructure and scale. This manifests in stable margins and a 34.6% ROIC growth trend, despite currently shedding value versus WACC. New renewable projects could deepen its moat in 2026.
Xcel Energy Inc.: Customer Base and Diversification Under Pressure
Xcel relies on its diversified energy mix and customer reach, but ROIC is in decline, signaling weakening capital efficiency. Unlike Duke, its financial strength shows cracks. Expansion in renewables offers upside but also execution risks.
Moat Battle: Infrastructure Scale vs. Diversification Resilience
Duke’s growing ROIC trend and stable margins indicate a deeper moat than Xcel’s declining capital returns. I see Duke better equipped to defend market share amid industry shifts.
Which stock offers better returns?
The past year shows strong price gains for both stocks, with Duke Energy and Xcel Energy experiencing bullish trends but recent slight pullbacks in trading dynamics.
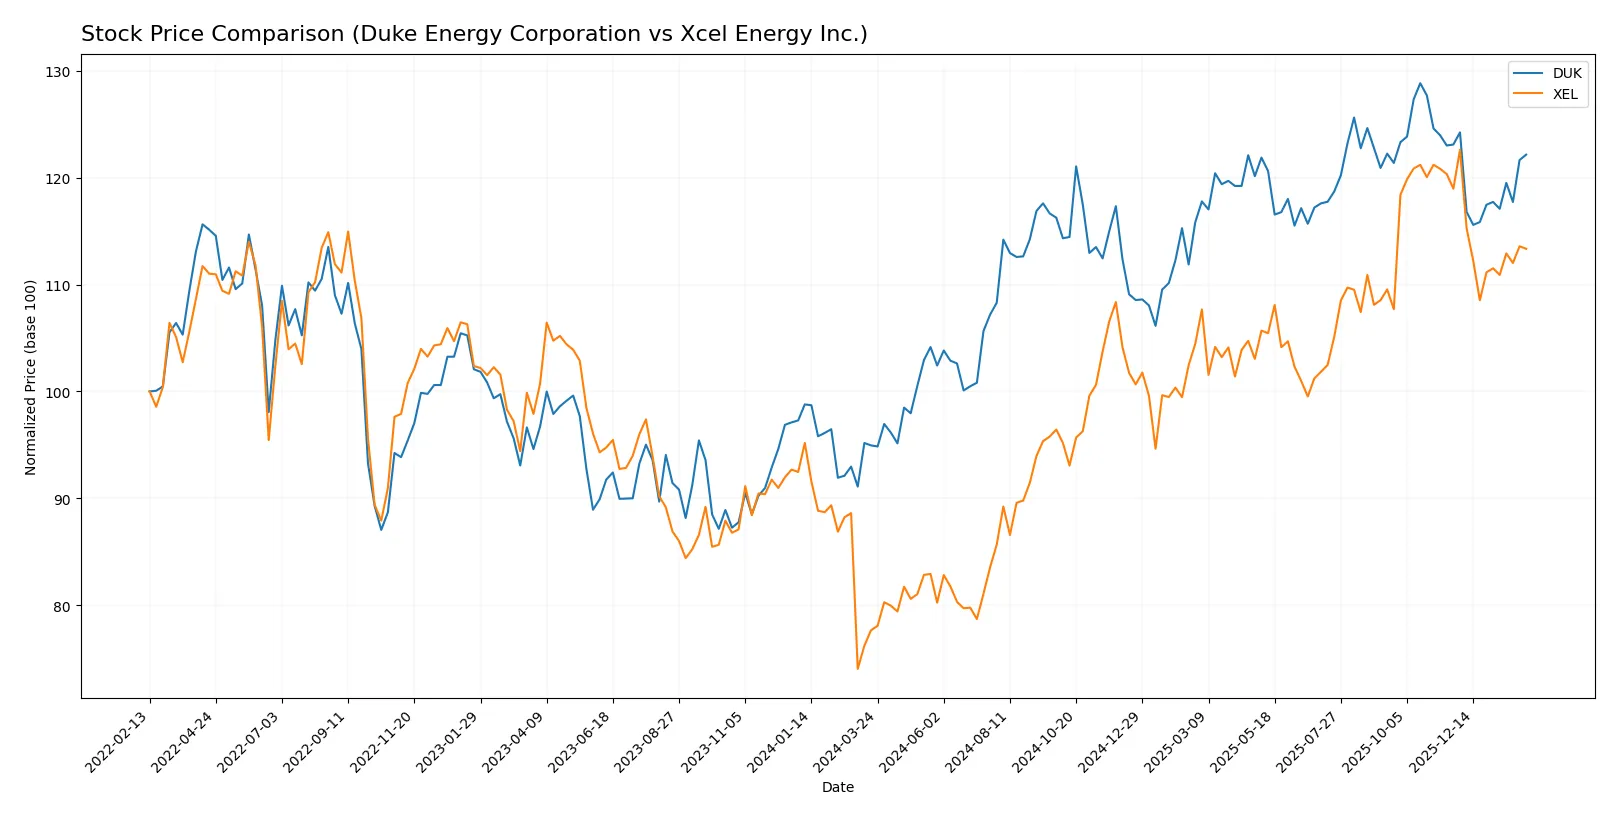
Trend Comparison
Duke Energy’s stock gained 28.67% over the past 12 months, marking a bullish trend with decelerating momentum. Its price ranged between 94.61 and 128.53, reflecting moderate volatility (8.21% std deviation).
Xcel Energy’s stock rose 45.99% over the same period, also bullish with decelerating momentum. The price moved from 51.99 to 82.11, showing similar volatility at 8.24%. Recent declines were sharper than Duke’s.
Xcel Energy outperformed Duke Energy in market returns despite both showing decelerating bullish trends and recent price softening.
Target Prices
Analysts show a bullish consensus for Duke Energy Corporation and Xcel Energy Inc., expecting moderate upside from current prices.
| Company | Target Low | Target High | Consensus |
|---|---|---|---|
| Duke Energy Corporation | 115 | 143 | 133.45 |
| Xcel Energy Inc. | 81 | 95 | 88 |
Duke Energy’s consensus target at 133.45 suggests a 9.5% upside from its current 121.86 price. Xcel Energy’s 88 target implies a stronger 16% potential gain from 75.9.

Don’t Let Luck Decide Your Entry Point
Optimize your entry points with our advanced ProRealTime indicators. You’ll get efficient buy signals with precise price targets for maximum performance. Start outperforming now!
How do institutions grade them?
Duke Energy Corporation Grades
The table below lists recent grades from reputable institutions for Duke Energy Corporation.
| Grading Company | Action | New Grade | Date |
|---|---|---|---|
| Wells Fargo | Maintain | Equal Weight | 2026-01-20 |
| Barclays | Maintain | Overweight | 2026-01-15 |
| UBS | Maintain | Neutral | 2025-12-17 |
| JP Morgan | Maintain | Neutral | 2025-12-11 |
| Mizuho | Maintain | Outperform | 2025-10-27 |
| Morgan Stanley | Maintain | Equal Weight | 2025-10-22 |
| Barclays | Maintain | Overweight | 2025-10-14 |
| UBS | Maintain | Neutral | 2025-10-10 |
| BMO Capital | Maintain | Outperform | 2025-10-10 |
| Scotiabank | Upgrade | Sector Outperform | 2025-10-03 |
Xcel Energy Inc. Grades
The table below lists recent grades from reputable institutions for Xcel Energy Inc.
| Grading Company | Action | New Grade | Date |
|---|---|---|---|
| Barclays | Maintain | Overweight | 2026-01-15 |
| UBS | Maintain | Neutral | 2025-12-17 |
| Keybanc | Maintain | Overweight | 2025-12-12 |
| JP Morgan | Maintain | Overweight | 2025-12-11 |
| Barclays | Maintain | Overweight | 2025-11-05 |
| Citigroup | Maintain | Buy | 2025-11-03 |
| UBS | Maintain | Neutral | 2025-10-31 |
| Mizuho | Maintain | Outperform | 2025-10-27 |
| Jefferies | Maintain | Buy | 2025-10-16 |
| Keybanc | Maintain | Overweight | 2025-10-15 |
Which company has the best grades?
Xcel Energy consistently receives higher ratings such as Buy and Overweight from multiple firms, while Duke Energy’s grades cluster around Neutral and Equal Weight with fewer Outperform ratings. This suggests stronger institutional conviction in Xcel Energy’s near-term prospects, potentially influencing investor confidence more favorably.
Risks specific to each company
The following categories identify critical pressure points and systemic threats confronting Duke Energy Corporation and Xcel Energy Inc. in the 2026 market environment:
1. Market & Competition
Duke Energy Corporation
- Operates in a large, diverse service territory with 8.2M customers; faces regional competition and an evolving renewable energy market.
Xcel Energy Inc.
- Serves 3.7M electricity customers across eight states; competes in increasingly deregulated markets with growing renewable investments.
2. Capital Structure & Debt
Duke Energy Corporation
- High debt-to-equity ratio at 1.7 signals elevated leverage risk; interest coverage moderate at 2.53x.
Xcel Energy Inc.
- Debt metrics unavailable or reported favorably; interest coverage slightly lower at 2.32x, indicating manageable but present debt risk.
3. Stock Volatility
Duke Energy Corporation
- Beta of 0.51 indicates lower market volatility; shares trade within a $110.5–130 range, showing relative stability.
Xcel Energy Inc.
- Slightly less volatile with beta of 0.476; price range $65.2–83.0 suggests moderate price fluctuations.
4. Regulatory & Legal
Duke Energy Corporation
- Subject to stringent state and federal regulations in multiple jurisdictions; nuclear and coal assets add regulatory complexity.
Xcel Energy Inc.
- Faces regulatory risks across diverse states; nuclear and renewable mix requires compliance with evolving environmental policies.
5. Supply Chain & Operations
Duke Energy Corporation
- Large asset base with coal, gas, nuclear, and renewables; operational complexity may expose it to supply disruptions.
Xcel Energy Inc.
- Reliance on coal, nuclear, natural gas, and renewables; supply chain disruptions could impact fuel procurement and grid reliability.
6. ESG & Climate Transition
Duke Energy Corporation
- Transitioning with 3,554 MW renewable capacity; legacy coal assets may slow ESG momentum and attract investor scrutiny.
Xcel Energy Inc.
- Focused on renewable growth and natural gas; ESG transition remains challenging but shows progress with cleaner energy sources.
7. Geopolitical Exposure
Duke Energy Corporation
- Operates solely in the U.S. Southeast and Midwest, limiting direct geopolitical risks but vulnerable to domestic policy shifts.
Xcel Energy Inc.
- U.S.-focused operations spanning northern and central states; geopolitical risks mainly relate to national energy policies and trade.
Which company shows a better risk-adjusted profile?
Duke Energy’s most pressing risk is its high leverage and weak liquidity ratios, signaling financial stress despite stable market positioning. Xcel’s key vulnerability lies in incomplete debt transparency and weaker profitability metrics. Overall, Xcel displays a slightly better risk-adjusted profile due to lower reported leverage and a more favorable debt outlook. Recent data highlight Duke’s Altman Z-Score in the distress zone, underscoring urgent financial risks that investors must monitor closely.
Final Verdict: Which stock to choose?
Duke Energy’s superpower lies in its improving profitability amid challenging capital efficiency. Its growing ROIC trend signals operational progress, yet heavy leverage and weak liquidity remain points of vigilance. It suits investors with a tolerance for cyclical risks seeking steady income and moderate growth—leaning toward an Income & Value blend.
Xcel Energy benefits from a solid utility moat grounded in stable cash flows and a cleaner balance sheet. Although its ROIC trend appears to be declining, it offers relatively better financial stability than Duke. This profile aligns with investors prioritizing lower risk and steady dividends, fitting a GARP (Growth at a Reasonable Price) approach.
If you prioritize income with a tilt toward operational improvement, Duke Energy outshines due to its rising profitability despite balance sheet concerns. However, if you seek better financial stability and cleaner leverage metrics, Xcel Energy offers superior risk management with a dependable dividend. Each presents an analytical scenario depending on your appetite for risk versus growth.
Disclaimer: Investment carries a risk of loss of initial capital. The past performance is not a reliable indicator of future results. Be sure to understand risks before making an investment decision.
Go Further
I encourage you to read the complete analyses of Duke Energy Corporation and Xcel Energy Inc. to enhance your investment decisions: