In the evolving landscape of regulated electric utilities, Duke Energy Corporation (DUK) and WEC Energy Group, Inc. (WEC) stand out as prominent players with significant market presence. Both companies operate in the U.S. energy sector, focusing on electricity and natural gas distribution while investing in renewable energy innovation. This comparison explores their operational strengths and strategic directions to help you identify which company aligns best with your investment goals. Let’s uncover which utility offers the most compelling opportunity for your portfolio.
Table of contents
Companies Overview
I will begin the comparison between Duke Energy Corporation and WEC Energy Group, Inc. by providing an overview of these two companies and their main differences.
Duke Energy Corporation Overview
Duke Energy Corporation operates as an energy company in the United States, serving approximately 8.2M customers across six states in the Southeast and Midwest. Its operations include electric utilities and infrastructure, gas utilities and infrastructure, and commercial renewables. Duke owns about 50,259 MW of generation capacity and maintains a diverse energy mix including coal, hydroelectric, natural gas, oil, renewables, and nuclear fuel.
WEC Energy Group, Inc. Overview
WEC Energy Group, Inc. provides regulated natural gas, electricity, and renewable energy services in the U.S. It operates through six segments covering Wisconsin, Illinois, and other states, with extensive electricity and natural gas infrastructure. WEC generates power from coal, natural gas, oil, hydroelectric, wind, solar, and biomass, serving a broad customer base with both utility and non-utility energy infrastructure.
Key similarities and differences
Both Duke and WEC operate in the regulated electric utility sector with diversified energy generation portfolios including renewables. Duke has a larger market cap and customer base, focusing heavily on electric and gas utilities plus commercial renewables, while WEC emphasizes natural gas alongside electricity and has a larger infrastructure footprint in distribution lines and substations. Employee counts and scale of operations also differ significantly.
Income Statement Comparison
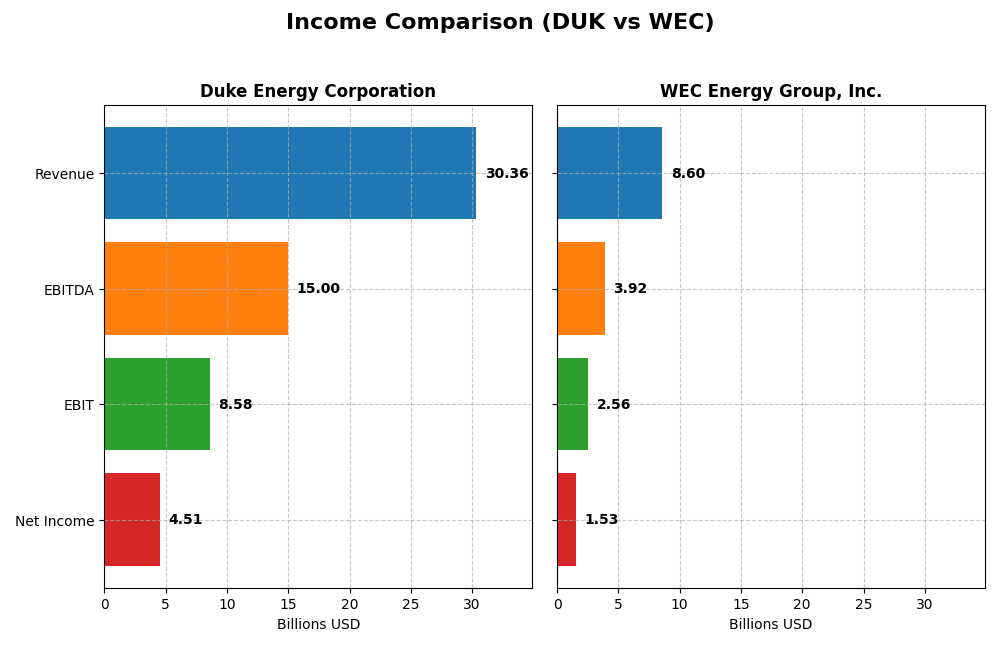
The table below compares the key income statement metrics for Duke Energy Corporation and WEC Energy Group, Inc. for the fiscal year 2024, providing a snapshot of their financial performance.
| Metric | Duke Energy Corporation | WEC Energy Group, Inc. |
|---|---|---|
| Market Cap | 90.8B | 33.5B |
| Revenue | 30.4B | 8.6B |
| EBITDA | 15.0B | 3.9B |
| EBIT | 8.6B | 2.6B |
| Net Income | 4.5B | 1.5B |
| EPS | 5.71 | 4.81 |
| Fiscal Year | 2024 | 2024 |
Income Statement Interpretations
Duke Energy Corporation
Duke Energy has shown steady revenue growth, reaching $30.36B in 2024, with net income significantly rising to $4.51B. Margins have generally improved, with a gross margin of 50.06% and net margin at 14.86%, both favorable. The latest year saw a revenue growth of 4.46% and a solid 10.24% increase in EBIT, indicating strengthened profitability despite slightly higher operating expenses.
WEC Energy Group, Inc.
WEC’s revenue declined by 3.3% in 2024 to $8.60B, though net income still increased to $1.53B. Margins remain strong, with a gross margin of 44.02% and net margin of 17.77%, both favorable. EBIT grew 13.18% last year, and net margin expanded by 18.58%, suggesting improved operational efficiency despite the revenue dip, supported by controlled expenses.
Which one has the stronger fundamentals?
Both companies display favorable income statement fundamentals, with Duke showing stronger revenue and net income growth over the period, but slightly higher interest expenses. WEC exhibits higher net margins and better recent margin improvements, despite a revenue decline. Overall, Duke’s robust growth contrasts with WEC’s margin efficiency, reflecting distinct strengths in their financial profiles.
Financial Ratios Comparison
The table below presents a side-by-side comparison of key financial ratios for Duke Energy Corporation (DUK) and WEC Energy Group, Inc. (WEC) based on their latest available fiscal year data (2024).
| Ratios | Duke Energy Corporation (DUK) | WEC Energy Group, Inc. (WEC) |
|---|---|---|
| ROE | 8.997% | 12.301% |
| ROIC | 4.017% | 4.142% |
| P/E | 18.44 | 19.46 |
| P/B | 1.66 | 2.39 |
| Current Ratio | 0.67 | 0.60 |
| Quick Ratio | 0.44 | 0.43 |
| D/E (Debt-to-Equity) | 1.70 | 1.64 |
| Debt-to-Assets | 45.7% | 42.9% |
| Interest Coverage | 2.34 | 2.64 |
| Asset Turnover | 0.163 | 0.182 |
| Fixed Asset Turnover | 0.244 | 0.248 |
| Payout ratio | 71.2% | 69.1% |
| Dividend yield | 3.86% | 3.55% |
Interpretation of the Ratios
Duke Energy Corporation
Duke Energy shows mixed financial ratios with a favorable net margin of 14.86% and dividend yield at 3.86%, indicating decent profitability and shareholder returns. However, its return on equity (9%) and return on invested capital (4.02%) are unfavorable, alongside weak liquidity ratios like a current ratio of 0.67. The dividend is supported but caution is warranted given high leverage and low asset turnover.
WEC Energy Group, Inc.
WEC Energy displays a stronger net margin of 17.77% and return on equity at 12.3%, with a solid dividend yield of 3.55%, reflecting consistent profitability and shareholder value. Liquidity ratios remain weak, with a current ratio of 0.6, and return on invested capital is slightly unfavorable at 4.14%. The firm maintains moderate leverage but asset turnover remains low, suggesting efficiency concerns.
Which one has the best ratios?
Both companies have a similar proportion of favorable ratios (21.43%) and are judged slightly unfavorable overall. Duke Energy struggles more with returns and liquidity, while WEC Energy exhibits better profitability and return on equity but still faces liquidity and efficiency challenges. Neither clearly outperforms the other across all key financial metrics.
Strategic Positioning
This section compares the strategic positioning of Duke Energy Corporation and WEC Energy Group, Inc. across Market position, Key segments, and Exposure to technological disruption:
Duke Energy Corporation
- Large market cap of 90.8B with diversified presence in Southeast and Midwest regions under regulated electric utilities.
- Key segments include Electric Utilities and Infrastructure (26.8B revenue), Gas Utilities, and Commercial Renewables (solar, wind, battery storage).
- Exposure includes coal, hydroelectric, natural gas, oil, renewables, and nuclear, with growing renewable assets and energy storage.
WEC Energy Group, Inc.
- Smaller market cap of 33.5B focused on Wisconsin and Illinois with regulated electric and natural gas utilities.
- Operates through regional segments Wisconsin, Illinois, Other States, plus Non-Utility Energy Infrastructure.
- Uses coal, natural gas, oil, hydroelectric, wind, solar, biomass, and electric transmission services.
Duke Energy Corporation vs WEC Energy Group, Inc. Positioning
Duke Energy shows a more diversified geographic and business segment strategy with significant investment in renewables. WEC Energy Group has a regional focus with a mix of regulated utilities and non-utility infrastructure, reflecting a more concentrated approach. Both face regulatory and market pressures typical of utilities.
Which has the best competitive advantage?
Both companies are currently shedding value with ROIC below WACC but show improving profitability trends. Their economic moats are slightly unfavorable, indicating limited sustainable competitive advantages based on recent financial efficiency.
Stock Comparison
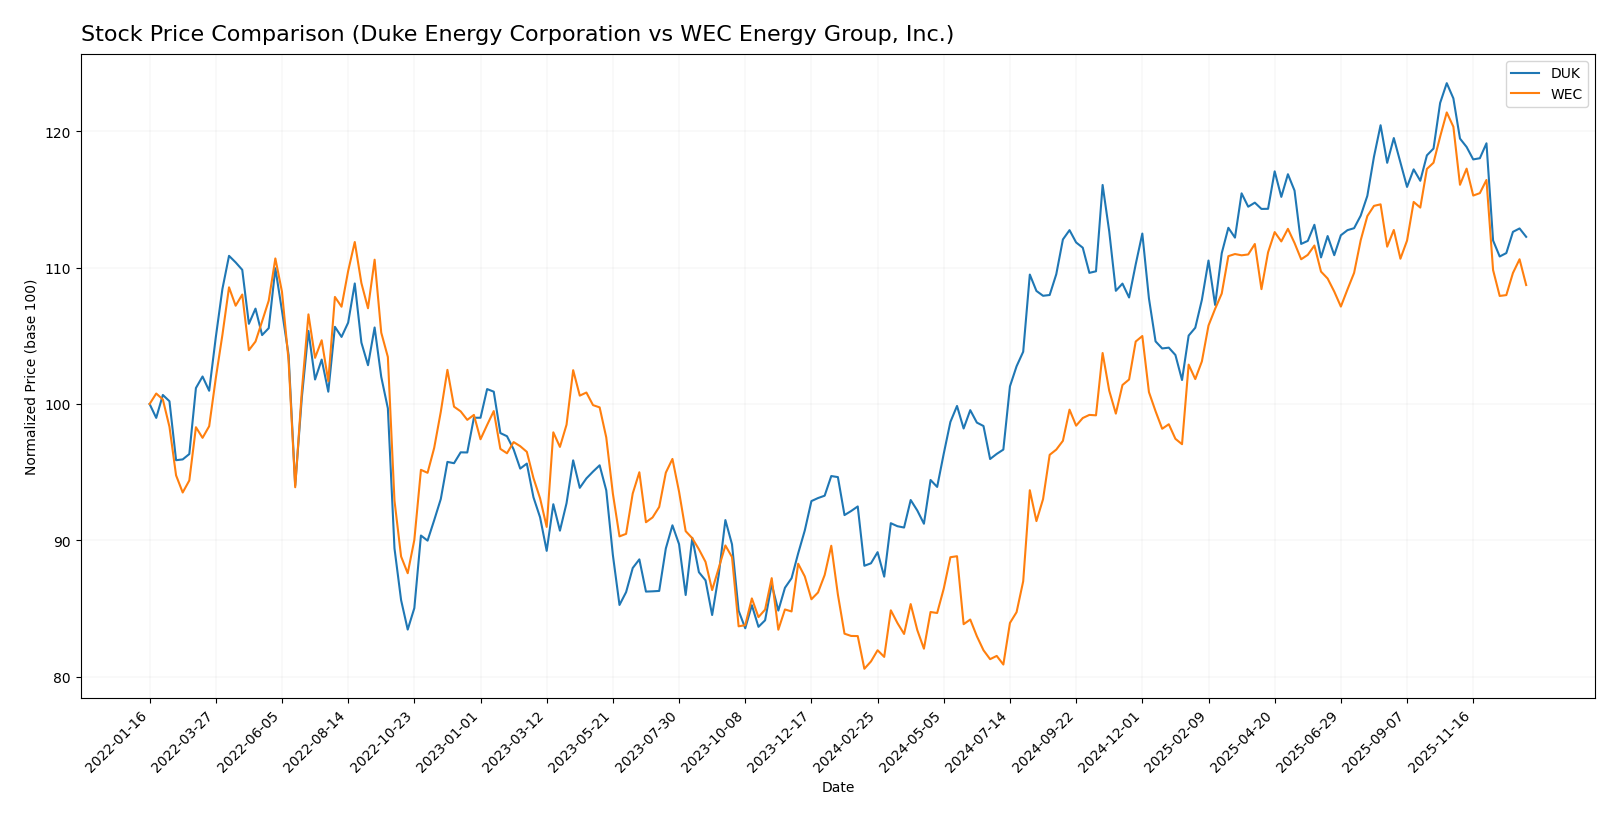
The past year reveals notable bullish trends for both Duke Energy Corporation and WEC Energy Group, Inc., with significant price appreciations followed by recent short-term declines amid shifting buyer-seller dynamics.
Trend Analysis
Duke Energy Corporation’s stock showed a bullish trend with a 27.12% price increase over the past 12 months, though recent months indicate a deceleration and a short-term price drop of 8.3%. Volatility measured by a 9.13 std deviation remains moderate.
WEC Energy Group, Inc. posted a stronger bullish trend, rising 34.05% over the same period, but also experienced recent deceleration with a 9.65% decline. Its volatility is higher at 11.44 std deviation, reflecting more price swings.
Comparing both, WEC has delivered the highest market performance over the year with a 34.05% gain versus Duke’s 27.12%, despite both facing recent downward pressures in the last quarter.
Target Prices
The target price consensus for Duke Energy Corporation and WEC Energy Group, Inc. reflects moderate upside potential based on analyst estimates.
| Company | Target High | Target Low | Consensus |
|---|---|---|---|
| Duke Energy Corporation | 150 | 126 | 135.91 |
| WEC Energy Group, Inc. | 136 | 105 | 122.67 |
Analysts expect Duke Energy’s stock to appreciate from its current price of $116.8 to a consensus of $135.91, indicating a positive outlook. WEC Energy’s target consensus of $122.67 also suggests upside from its current price near $104.65.
Analyst Opinions Comparison
This section compares analysts’ ratings and grades for Duke Energy Corporation and WEC Energy Group, Inc.:
Rating Comparison
DUK Rating
- Rating: C+ with a very favorable status
- Discounted Cash Flow Score: 1, very unfavorable
- ROE Score: 3, moderate
- ROA Score: 3, moderate
- Debt To Equity Score: 2, moderate
- Overall Score: 2, moderate
WEC Rating
- Rating: B- with a very favorable status
- Discounted Cash Flow Score: 1, very unfavorable
- ROE Score: 4, favorable
- ROA Score: 4, favorable
- Debt To Equity Score: 2, moderate
- Overall Score: 3, moderate
Which one is the best rated?
Based strictly on the data, WEC holds a higher overall rating (B-) compared to DUK’s C+. WEC also scores better in ROE and ROA, while both have equal debt to equity and discounted cash flow scores. Overall, WEC is rated better.
Scores Comparison
The following table presents a comparison of the Altman Z-Score and Piotroski Score for Duke Energy Corporation and WEC Energy Group, Inc.:
Duke Energy Corporation Scores
- Altman Z-Score: 0.71, indicating financial distress zone with high bankruptcy risk.
- Piotroski Score: 6, showing average financial strength and moderate investment quality.
WEC Energy Group, Inc. Scores
- Altman Z-Score: 1.14, also in distress zone but slightly higher than DUK.
- Piotroski Score: 6, reflecting average financial health identical to DUK.
Which company has the best scores?
Based on the provided data, both companies share the same Piotroski Score of 6, indicating average financial health. WEC has a marginally higher Altman Z-Score (1.14 vs. 0.71), but both remain in the distress zone, suggesting elevated bankruptcy risk for each.
Grades Comparison
Here is the comparison of recent grades assigned to Duke Energy Corporation and WEC Energy Group, Inc.:
Duke Energy Corporation Grades
The following table shows recent grades from major financial institutions for Duke Energy Corporation:
| Grading Company | Action | New Grade | Date |
|---|---|---|---|
| UBS | Maintain | Neutral | 2025-12-17 |
| JP Morgan | Maintain | Neutral | 2025-12-11 |
| Mizuho | Maintain | Outperform | 2025-10-27 |
| Morgan Stanley | Maintain | Equal Weight | 2025-10-22 |
| Barclays | Maintain | Overweight | 2025-10-14 |
| UBS | Maintain | Neutral | 2025-10-10 |
| BMO Capital | Maintain | Outperform | 2025-10-10 |
| Scotiabank | Upgrade | Sector Outperform | 2025-10-03 |
| Jefferies | Downgrade | Hold | 2025-09-26 |
| Morgan Stanley | Maintain | Equal Weight | 2025-09-25 |
Duke Energy’s grades show a generally stable outlook with a mix of Neutral, Outperform, and Overweight ratings, with only one recent downgrade to Hold.
WEC Energy Group, Inc. Grades
The following table presents recent grades from reputable financial firms for WEC Energy Group, Inc.:
| Grading Company | Action | New Grade | Date |
|---|---|---|---|
| B of A Securities | Maintain | Neutral | 2025-12-31 |
| UBS | Maintain | Neutral | 2025-12-17 |
| Barclays | Maintain | Underweight | 2025-12-16 |
| Keybanc | Maintain | Overweight | 2025-12-12 |
| JP Morgan | Maintain | Neutral | 2025-12-11 |
| Scotiabank | Maintain | Sector Outperform | 2025-10-31 |
| BMO Capital | Maintain | Market Perform | 2025-10-21 |
| Barclays | Maintain | Equal Weight | 2025-10-21 |
| Keybanc | Maintain | Overweight | 2025-10-15 |
| UBS | Maintain | Neutral | 2025-10-10 |
WEC’s ratings display more variability, with notable ratings ranging from Underweight to Overweight, but the consensus remains generally neutral to positive.
Which company has the best grades?
Both companies have a consensus rating of “Hold,” but Duke Energy has more consistent Outperform and Overweight ratings, indicating a slightly stronger analyst confidence. This may suggest a more stable outlook for Duke Energy, which investors might consider when evaluating risk and potential returns.
Strengths and Weaknesses
Below is a comparison table of key strengths and weaknesses for Duke Energy Corporation (DUK) and WEC Energy Group, Inc. (WEC) based on their latest financial and operational data.
| Criterion | Duke Energy Corporation (DUK) | WEC Energy Group, Inc. (WEC) |
|---|---|---|
| Diversification | Primarily focused on Electric Utilities and Infrastructure with growing Gas Utilities; limited renewables exposure | More regionally diversified across Illinois, Wisconsin, and other states; includes Non-Utility Energy Infrastructure segment |
| Profitability | Net margin favorable at 14.86%, but ROIC (4.02%) below WACC (4.8%), indicating value destruction | Higher net margin at 17.77%, but ROIC (4.14%) also below WACC (5.3%), indicating value destruction |
| Innovation | Moderate innovation with Commercial Renewables segment (~$500M revenue) but limited growth impact | Limited visible innovation; focus on energy infrastructure rather than emerging technologies |
| Global presence | Primarily U.S.-focused, no significant international operations | U.S.-focused, mainly Midwest markets; no global presence |
| Market Share | Large scale in electric utilities with $26.8B revenue in Electric Utilities | Strong regional market share in Wisconsin and Illinois, with over $6.3B revenue in Wisconsin |
In summary, both companies show slightly unfavorable economic moats due to ROIC below WACC, though both have improving profitability trends. Duke Energy offers more diversification within utilities including renewables, while WEC benefits from strong regional dominance and higher net margins. Careful monitoring of profitability improvements and debt levels remains essential for investment decisions.
Risk Analysis
Below is a comparative table of key risks for Duke Energy Corporation (DUK) and WEC Energy Group, Inc. (WEC) based on the most recent data from 2024:
| Metric | Duke Energy Corporation (DUK) | WEC Energy Group, Inc. (WEC) |
|---|---|---|
| Market Risk | Beta 0.49 – Low volatility, but exposure to regulated utility market shifts | Beta 0.573 – Slightly higher volatility, with similar sector exposure |
| Debt Level | Debt-to-Equity 1.7 (Unfavorable), Debt-to-Assets 45.74% (Neutral) | Debt-to-Equity 1.64 (Unfavorable), Debt-to-Assets 42.92% (Neutral) |
| Regulatory Risk | High – Operates in multiple states with evolving energy policies | High – Extensive regional regulation, with natural gas and electric sectors |
| Operational Risk | Moderate – Diverse generation sources including coal, nuclear, renewables | Moderate – Mix of generation types and large infrastructure network |
| Environmental Risk | Elevated – Coal and nuclear operations pose environmental compliance challenges | Elevated – Coal, natural gas, and biomass operations with emissions concerns |
| Geopolitical Risk | Low – US-based operations with limited international exposure | Low – US-based with regional concentration |
The most impactful risks for both companies remain regulatory and environmental due to the energy transition pressures and emissions regulations. High debt levels and moderate operational complexity add financial and execution risks. Both firms show financial distress signals with Altman Z-Scores in the distress zone, underscoring the importance of cautious risk management.
Which Stock to Choose?
Duke Energy Corporation (DUK) shows a favorable income statement with 14.86% net margin and strong growth over 2020-2024. However, financial ratios reveal more unfavorable aspects, including a 9.0% ROE and 1.7 debt-to-equity, with a slightly unfavorable global ratio opinion. The company’s ROIC remains below WACC, indicating value destruction despite a growing ROIC trend, and the overall rating is moderate with a C+ score.
WEC Energy Group, Inc. (WEC) also presents a favorable income statement, with a higher net margin of 17.77% and steady profitability growth. Its financial ratios are slightly better than DUK’s, with a 12.3% ROE and moderate debt levels, but also a slightly unfavorable global ratio opinion. WEC’s ROIC is below WACC, indicating value destruction, but with growing profitability. The company holds a better rating at B- and an average Piotroski score of 6.
For investors, WEC might appear more attractive for those prioritizing profitability and financial stability, while DUK could be seen as a choice for those focused on income growth despite financial challenges. Both companies show value destruction but improving profitability, suggesting risk-tolerant investors might weigh these aspects differently depending on their strategy.
Disclaimer: Investment carries a risk of loss of initial capital. The past performance is not a reliable indicator of future results. Be sure to understand risks before making an investment decision.
Go Further
I encourage you to read the complete analyses of Duke Energy Corporation and WEC Energy Group, Inc. to enhance your investment decisions: