The Southern Company (SO) and Duke Energy Corporation (DUK) are two leading players in the regulated electric utility sector, each serving millions of customers across the U.S. They overlap notably in energy generation and distribution, while both aggressively pursuing innovation in renewable energy and infrastructure modernization. This comparison will help investors understand which company presents the most compelling opportunity for their portfolio in today’s evolving energy landscape. Let’s explore which stands out as the better investment choice.
Table of contents
Companies Overview
I will begin the comparison between The Southern Company and Duke Energy Corporation by providing an overview of these two companies and their main differences.
The Southern Company Overview
The Southern Company operates in the regulated electric industry, focusing on generation, transmission, and distribution of electricity. It serves approximately 8.7 million electric and gas customers across several states, including Illinois, Georgia, Virginia, and Tennessee. The company also invests in renewable energy projects, natural gas pipelines, and offers digital wireless communications and fiber optics services, positioning itself as a diversified energy provider.
Duke Energy Corporation Overview
Duke Energy Corporation is a major energy company serving around 8.2 million customers in the Southeast and Midwest U.S. It operates through electric and gas utilities and commercial renewables segments, generating power from coal, natural gas, nuclear, hydroelectric, and renewables. With significant renewable assets including wind, solar, and battery storage, Duke emphasizes a broad energy mix across six states, supporting both regulated utilities and nonregulated renewable projects.
Key similarities and differences
Both companies operate primarily in the regulated electric utilities sector and serve millions of customers in multiple states. Each invests heavily in renewable energy and natural gas infrastructure. However, The Southern Company has a larger customer base and a wider geographical spread for gas distribution, while Duke Energy places greater emphasis on commercial renewables with extensive wind and solar facilities. Their generation portfolios differ slightly in fuel mix and scale of operations.
Income Statement Comparison
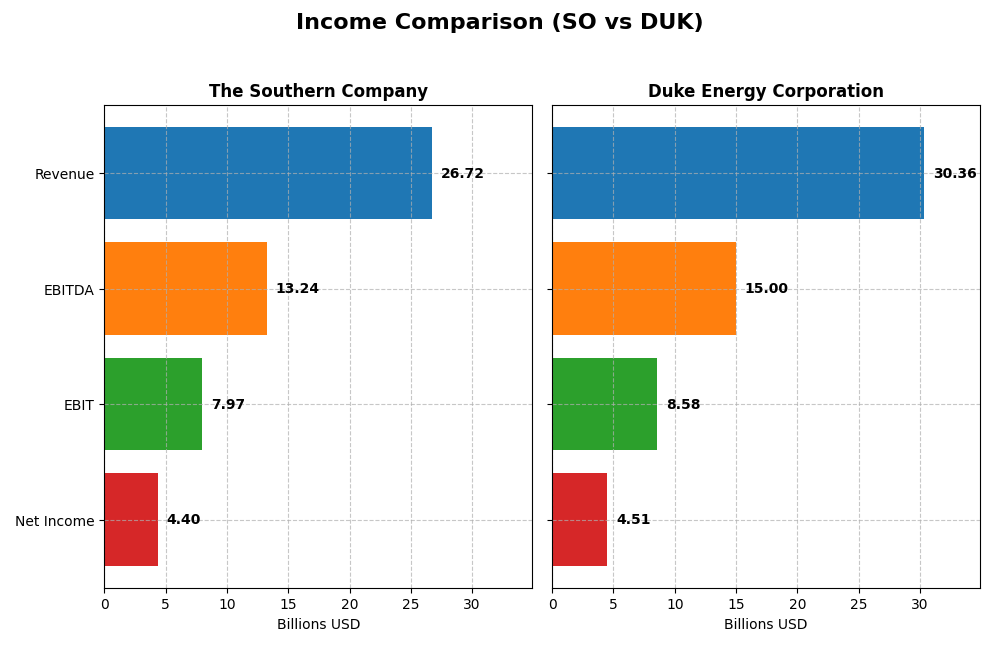
This table compares key income statement metrics for The Southern Company and Duke Energy Corporation for the fiscal year 2024, providing a snapshot of their financial performance.
| Metric | The Southern Company (SO) | Duke Energy Corporation (DUK) |
|---|---|---|
| Market Cap | 95.7B | 90.8B |
| Revenue | 26.7B | 30.4B |
| EBITDA | 13.2B | 15.0B |
| EBIT | 7.97B | 8.58B |
| Net Income | 4.40B | 4.51B |
| EPS | 4.02 | 5.71 |
| Fiscal Year | 2024 | 2024 |
Income Statement Interpretations
The Southern Company
Over the 2020-2024 period, The Southern Company showed a steady increase in revenue from $20.4B to $26.7B and net income growth from $3.1B to $4.4B. Margins remained generally stable, with a favorable gross margin near 50% and net margin at 16.5%. The 2024 year reflected moderate revenue growth of 5.8% and solid improvements in EBIT and EPS, indicating positive operational momentum.
Duke Energy Corporation
Duke Energy’s revenue rose from $23.4B in 2020 to $30.4B in 2024, with net income surging from $1.3B to $4.5B, driven partly by large improvements over the overall period. Margins were stable with a gross margin around 50% and net margin nearing 15%. The latest year showed moderate revenue growth of 4.5%, alongside favorable EBIT and EPS growth, though net margin growth was minimal, signaling cautious margin expansion.
Which one has the stronger fundamentals?
Both companies present favorable income statement fundamentals, with stable margins near 50% gross and double-digit net margins. The Southern Company shows consistent growth and margin stability, while Duke Energy exhibits significantly higher net income growth over the entire period but with slightly lower net margin. Each has similar favorable operational metrics, but Duke’s more pronounced net income increase contrasts with Southern’s steadier margin profile.
Financial Ratios Comparison
The table below presents the key financial ratios for The Southern Company and Duke Energy Corporation for the fiscal year 2024, providing a snapshot of their recent financial performance and stability.
| Ratios | The Southern Company (SO) | Duke Energy Corporation (DUK) |
|---|---|---|
| ROE | 13.25% | 8.99% |
| ROIC | 4.25% | 4.02% |
| P/E | 20.50 | 18.44 |
| P/B | 2.72 | 1.66 |
| Current Ratio | 0.67 | 0.67 |
| Quick Ratio | 0.46 | 0.44 |
| D/E (Debt to Equity) | 2.00 | 1.70 |
| Debt-to-Assets | 45.65% | 45.74% |
| Interest Coverage | 2.58 | 2.34 |
| Asset Turnover | 0.18 | 0.16 |
| Fixed Asset Turnover | 0.25 | 0.24 |
| Payout Ratio | 67.12% | 71.24% |
| Dividend Yield | 3.27% | 3.86% |
Interpretation of the Ratios
The Southern Company
The Southern Company shows a mixed ratio profile with favorable net margin (16.47%) and dividend yield (3.27%), but several unfavorable indicators including return on invested capital (4.25%), current and quick ratios (0.67 and 0.46), and asset turnover (0.18). Its return on equity is neutral at 13.25%. The company maintains a steady dividend, supported by manageable payout risks given its cash flow coverage.
Duke Energy Corporation
Duke Energy exhibits a similar pattern with a favorable net margin (14.86%) and dividend yield (3.86%), but faces challenges in return on equity (9.0%), return on invested capital (4.02%), and liquidity ratios (current and quick ratios near 0.67 and 0.44). Debt-to-equity stands unfavorable at 1.7. Duke also sustains dividend payments, balanced against cautious free cash flow and payout considerations.
Which one has the best ratios?
Both companies present slightly unfavorable overall ratio profiles driven by liquidity and efficiency concerns. The Southern Company has a marginally stronger return on equity and dividend yield, while Duke Energy shows a lower price-to-book ratio and a slightly higher dividend yield. The decision depends on which specific ratios investors prioritize, as neither firm clearly outperforms across all metrics.
Strategic Positioning
This section compares the strategic positioning of The Southern Company and Duke Energy Corporation in terms of Market position, Key segments, and Exposure to technological disruption:
The Southern Company
- Leading in regulated electric utilities with 8.7M customers; faces typical industry competition.
- Diverse segments including gas distribution, marketing, pipelines, wholesale electricity, and renewables.
- Operates multiple renewable energy assets and natural gas infrastructure; integrating digital wireless and fiber optics.
Duke Energy Corporation
- Strong regional presence with 8.2M customers across 6 states; operates in competitive regulated markets.
- Focused on electric and gas utilities plus commercial renewables; significant generation capacity of 50,259 MW.
- Active in renewables with wind, solar, battery storage, and fuel cells; broad exposure to clean energy technologies.
The Southern Company vs Duke Energy Corporation Positioning
The Southern Company’s diversified operations span gas and electricity including digital services, offering broad revenue sources. Duke Energy has a concentrated focus on electric and gas utilities along with commercial renewables, emphasizing large-scale generation and clean energy investments.
Which has the best competitive advantage?
Both companies exhibit slightly unfavorable MOAT evaluations due to ROIC below WACC but show improving profitability trends. Neither currently demonstrates a strong competitive advantage based on value creation metrics.
Stock Comparison
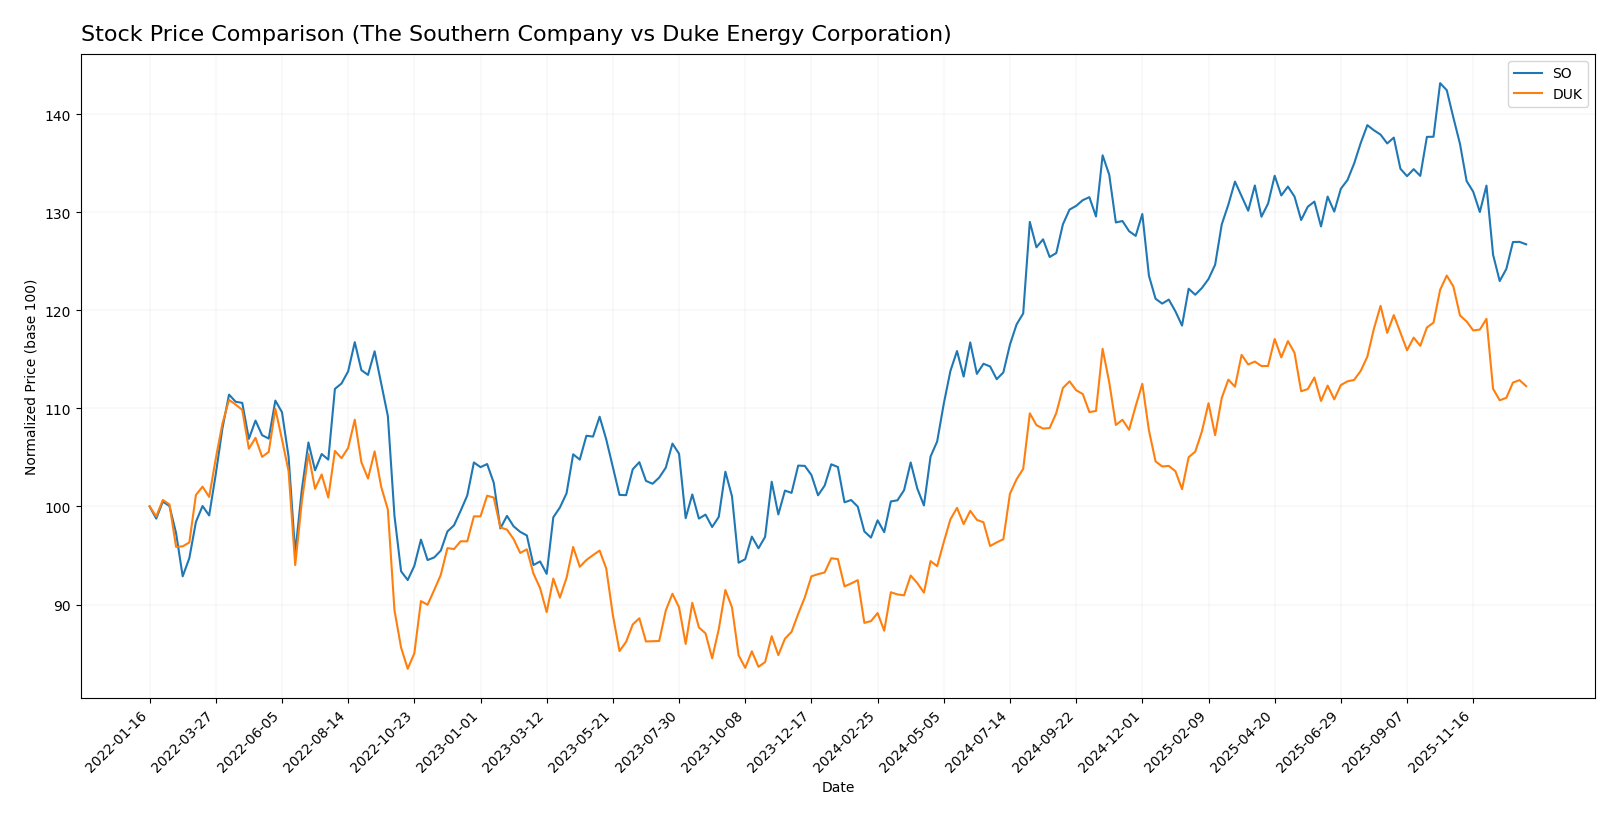
The stock prices of The Southern Company and Duke Energy Corporation have exhibited notable bullish trends over the past 12 months, with both showing decelerating growth and recent downward price movements.
Trend Analysis
The Southern Company’s stock increased by 30.88% over the past year, indicating a bullish trend with decelerating momentum. The price ranged between 66.48 and 98.29, with recent months showing a 9.25% decline.
Duke Energy Corporation’s stock rose by 27.12% over the same period, also reflecting a bullish trend with deceleration. Prices fluctuated from 90.86 to 128.53, with a recent decrease of 8.3% observed.
Comparing the two, The Southern Company delivered the higher market performance with a 30.88% gain versus Duke Energy’s 27.12%, despite both facing recent declines.
Target Prices
The consensus target prices for The Southern Company and Duke Energy Corporation indicate moderate upside potential.
| Company | Target High | Target Low | Consensus |
|---|---|---|---|
| The Southern Company | 103 | 76 | 93.1 |
| Duke Energy Corporation | 150 | 126 | 135.91 |
Analysts expect The Southern Company’s stock to rise modestly from its current price of $87.01 toward the consensus of $93.1. Duke Energy shows stronger upside potential versus its current price of $116.8, with a consensus target near $136.
Analyst Opinions Comparison
This section compares analysts’ ratings and grades for The Southern Company and Duke Energy Corporation:
Rating Comparison
The Southern Company Rating
- Rating: B- rating indicates a very favorable assessment.
- Discounted Cash Flow Score: Moderate score of 3 reflects balanced future cash flow projections.
- ROE Score: Favorable score of 4 shows efficient profit generation from equity.
- ROA Score: Moderate score of 3 reflects average asset utilization.
- Debt To Equity Score: Very unfavorable score of 1 indicates higher financial risk.
- Overall Score: Moderate score of 3 represents a balanced overall financial standing.
Duke Energy Corporation Rating
- Rating: C+ rating also indicates a very favorable assessment.
- Discounted Cash Flow Score: Very unfavorable score of 1 suggests concerns about valuation.
- ROE Score: Moderate score of 3 indicates average efficiency in profit generation.
- ROA Score: Moderate score of 3 reflects average asset utilization.
- Debt To Equity Score: Moderate score of 2 suggests better balance sheet strength.
- Overall Score: Moderate score of 2 shows slightly weaker overall financial standing.
Which one is the best rated?
Based strictly on the provided data, The Southern Company holds a better overall rating (B- vs. C+) and higher scores in discounted cash flow and return on equity, despite weaker debt-to-equity. Duke scores lower overall but has a more favorable debt-to-equity score.
Scores Comparison
Here is a comparison of the Altman Z-Score and Piotroski Score for the two companies:
SO Scores
- Altman Z-Score: 0.98, indicating financial distress risk.
- Piotroski Score: 6, representing average financial strength.
DUK Scores
- Altman Z-Score: 0.71, also indicating financial distress risk.
- Piotroski Score: 6, representing average financial strength.
Which company has the best scores?
Both SO and DUK have Altman Z-Scores placing them in the distress zone, indicating financial risk. Their Piotroski Scores are equal at 6, reflecting average financial health. Neither company shows a clear advantage in scores based on the provided data.
Grades Comparison
Here is a comparison of the recent grades assigned to The Southern Company and Duke Energy Corporation by reputable grading firms:
The Southern Company Grades
The following table summarizes The Southern Company’s recent grades from established financial institutions:
| Grading Company | Action | New Grade | Date |
|---|---|---|---|
| UBS | Maintain | Neutral | 2025-12-17 |
| JP Morgan | Maintain | Neutral | 2025-12-15 |
| Jefferies | Maintain | Neutral | 2025-12-15 |
| RBC Capital | Maintain | Sector Perform | 2025-12-12 |
| Keybanc | Maintain | Underweight | 2025-12-12 |
| Mizuho | Maintain | Neutral | 2025-12-11 |
| Barclays | Maintain | Equal Weight | 2025-11-20 |
| Jefferies | Downgrade | Neutral | 2025-11-05 |
| Ladenburg Thalmann | Downgrade | Neutral | 2025-10-17 |
| Keybanc | Maintain | Underweight | 2025-10-15 |
Overall, The Southern Company’s grades predominantly reflect a cautious stance, with multiple neutral and underweight ratings and recent downgrades from buy to neutral.
Duke Energy Corporation Grades
The following table details Duke Energy Corporation’s latest grades by recognized grading companies:
| Grading Company | Action | New Grade | Date |
|---|---|---|---|
| UBS | Maintain | Neutral | 2025-12-17 |
| JP Morgan | Maintain | Neutral | 2025-12-11 |
| Mizuho | Maintain | Outperform | 2025-10-27 |
| Morgan Stanley | Maintain | Equal Weight | 2025-10-22 |
| Barclays | Maintain | Overweight | 2025-10-14 |
| UBS | Maintain | Neutral | 2025-10-10 |
| BMO Capital | Maintain | Outperform | 2025-10-10 |
| Scotiabank | Upgrade | Sector Outperform | 2025-10-03 |
| Jefferies | Downgrade | Hold | 2025-09-26 |
| Morgan Stanley | Maintain | Equal Weight | 2025-09-25 |
Duke Energy’s ratings show a generally more positive outlook, with several outperform and overweight grades and only one recent downgrade from buy to hold.
Which company has the best grades?
Duke Energy Corporation has received comparatively stronger grades with multiple outperform and overweight ratings, whereas The Southern Company’s grades lean more toward neutral and underweight. This difference may influence investors’ perception of growth potential and risk profiles for each stock.
Strengths and Weaknesses
Below is a comparison of The Southern Company (SO) and Duke Energy Corporation (DUK) based on key financial and operational criteria.
| Criterion | The Southern Company (SO) | Duke Energy Corporation (DUK) |
|---|---|---|
| Diversification | Moderate diversification with strong gas and electric utilities segments, Southern Company Gas generating $4.46B in 2024 | Focused on electric and gas utilities with larger electric utilities segment at $26.8B in 2024 |
| Profitability | Net margin 16.47% (favorable), ROIC 4.25% (unfavorable), ROE 13.25% (neutral) | Net margin 14.86% (favorable), ROIC 4.02% (unfavorable), ROE 9.0% (unfavorable) |
| Innovation | Growing ROIC trend (+12.97%), but overall value destruction (ROIC < WACC) | Stronger ROIC growth (+34.61%) but still value destroying (ROIC < WACC) |
| Global presence | Mainly U.S. focused with gas and electric operations | Primarily U.S. focused with electric and gas utilities infrastructure |
| Market Share | Significant presence in Southeast U.S. gas and electric markets | Leading presence in electric utilities with infrastructure dominance |
Key takeaways: Both companies face challenges in value creation, with ROIC below WACC indicating value destruction despite improving profitability trends. Southern Company shows slightly better profitability ratios, while Duke Energy has stronger ROIC growth but weaker returns on equity. Investors should weigh operational scale against financial efficiency and risk.
Risk Analysis
Below is a summary table comparing key risk factors for The Southern Company (SO) and Duke Energy Corporation (DUK) as of 2024.
| Metric | The Southern Company (SO) | Duke Energy Corporation (DUK) |
|---|---|---|
| Market Risk | Low beta (0.447) suggests lower volatility | Low beta (0.49) indicates moderate market risk |
| Debt Level | High debt-to-equity ratio (2.0, unfavorable) | High debt-to-equity ratio (1.7, unfavorable) |
| Regulatory Risk | Moderate, operates in regulated electric sector | Moderate, regulated but with diversified renewables |
| Operational Risk | Complex asset base with fossil, nuclear, renewables | Diverse generation mix including renewables, some operational complexity |
| Environmental Risk | Exposure due to fossil fuel plants; active in renewables | Similar exposure; strong renewables portfolio mitigates risk |
| Geopolitical Risk | Primarily US-based operations, limited direct geopolitical exposure | US-centric with no significant geopolitical risk |
The most significant risks for both companies are their high debt levels and operational complexity amid energy transition pressures. Both firms are in the distress zone for bankruptcy risk (Altman Z-Scores below 1.8), signaling caution. Environmental and regulatory challenges remain impactful but are partly offset by investments in renewables.
Which Stock to Choose?
The Southern Company (SO) shows favorable income growth with a 31.16% revenue increase over five years and solid profitability metrics including a 16.47% net margin. However, financial ratios reveal a slightly unfavorable global evaluation with a high debt-to-equity ratio (2.0) and weak liquidity, despite a very favorable rating of B-. The company’s economic moat appears slightly unfavorable as ROIC is below WACC, though ROIC is growing.
Duke Energy Corporation (DUK) also posts favorable income growth, notably a 227.52% net income rise over five years, and a 14.86% net margin. Its financial ratios are slightly more unfavorable globally, primarily due to higher debt levels and weaker returns on equity. Duke’s rating stands at C+ but is still very favorable overall. Like SO, its moat rating is slightly unfavorable with ROIC below WACC, albeit with a positive trend.
For investors prioritizing growth and improving profitability, SO’s solid income growth and slightly better rating might appear more attractive, while those focused on substantial net income expansion and dividend yield could view DUK’s stronger growth in earnings and consistent profitability as favorable. Both companies display financial leverage and liquidity challenges, implying a cautious approach based on individual risk tolerance and investment strategy.
Disclaimer: Investment carries a risk of loss of initial capital. The past performance is not a reliable indicator of future results. Be sure to understand risks before making an investment decision.
Go Further
I encourage you to read the complete analyses of The Southern Company and Duke Energy Corporation to enhance your investment decisions: