Duke Energy Corporation (DUK) and Public Service Enterprise Group Incorporated (PEG) are two leading players in the regulated electric utility sector in the United States. Both companies serve large customer bases with electricity and gas distribution, while actively investing in renewable energy innovations. Their overlapping markets and commitment to sustainable growth make this comparison essential. In this article, I will help you identify which company offers the most compelling investment opportunity for your portfolio.
Table of contents
Companies Overview
I will begin the comparison between Duke Energy Corporation and Public Service Enterprise Group by providing an overview of these two companies and their main differences.
Duke Energy Corporation Overview
Duke Energy Corporation operates as a major energy company in the United States, serving approximately 8.2M customers across six states in the Southeast and Midwest. Its operations span electric utilities, gas utilities, and commercial renewables, with a generation capacity of about 50,259 MW. The company focuses on a diversified energy mix including coal, natural gas, nuclear, hydroelectric, and renewable sources, aiming to provide reliable energy infrastructure.
Public Service Enterprise Group Overview
Public Service Enterprise Group (PSEG) serves primarily the Northeastern and Mid-Atlantic US regions through its PSE&G and PSEG Power segments. It provides electric and gas transmission and distribution to residential, commercial, and industrial customers, while investing in solar projects and energy efficiency programs. PSEG operates extensive infrastructure including 25,000 circuit miles of electric transmission and 18,000 miles of gas mains, supporting a regional customer base with integrated utility services.
Key similarities and differences
Both Duke Energy and PSEG operate within the regulated electric utilities sector, focusing on electricity and gas distribution with investments in renewable energy. Duke Energy’s footprint is broader geographically, covering multiple states in the Southeast and Midwest, while PSEG concentrates in the Northeast and Mid-Atlantic. Duke’s business includes a significant commercial renewables segment and larger generation capacity, whereas PSEG emphasizes extensive transmission and distribution infrastructure along with energy efficiency initiatives.
Income Statement Comparison
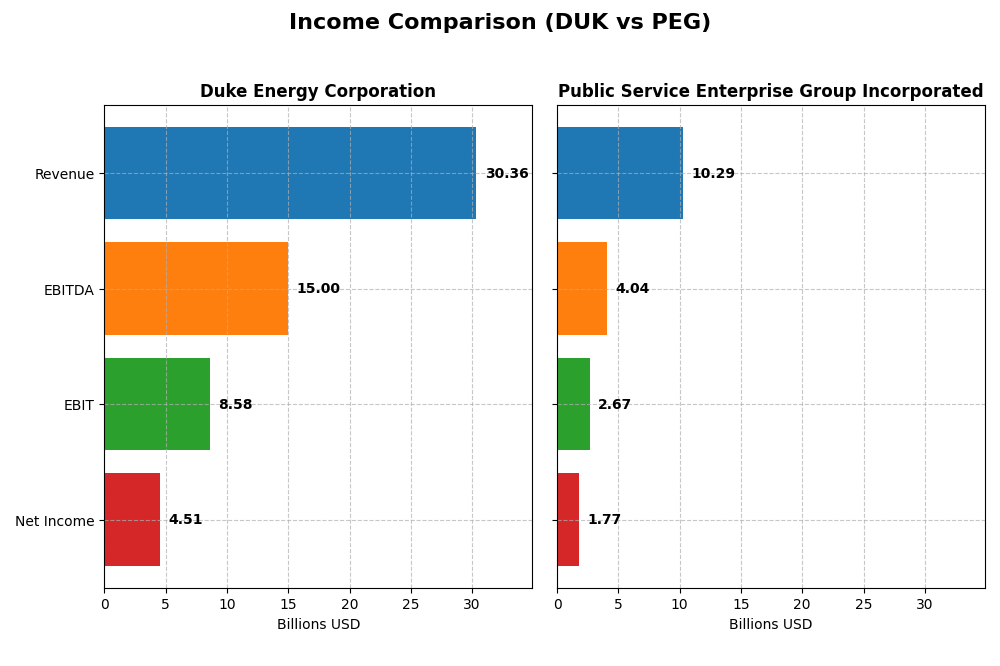
The table below provides a side-by-side comparison of the most recent fiscal year income statement figures for Duke Energy Corporation and Public Service Enterprise Group Incorporated.
| Metric | Duke Energy Corporation | Public Service Enterprise Group Incorporated |
|---|---|---|
| Market Cap | 90.8B | 39.3B |
| Revenue | 30.4B | 10.3B |
| EBITDA | 15.0B | 4.0B |
| EBIT | 8.6B | 2.7B |
| Net Income | 4.5B | 1.8B |
| EPS | 5.71 | 3.56 |
| Fiscal Year | 2024 | 2024 |
Income Statement Interpretations
Duke Energy Corporation
Duke Energy’s revenue and net income showed consistent growth from 2020 to 2024, with total revenue rising from $23.4B to $30.4B and net income increasing from $1.38B to $4.51B. Margins improved notably, with gross margin at 50.06% and net margin at 14.86% in 2024. The latest year saw moderate revenue growth of 4.46%, supported by a 10.24% rise in EBIT, reflecting solid operational efficiency.
Public Service Enterprise Group Incorporated
Public Service Enterprise Group experienced mixed results from 2020 to 2024, with revenue fluctuating but declining 8.43% in the last year to $10.3B. Net income dropped from $1.91B in 2020 to $1.77B in 2024. Despite a favorable net margin of 17.22%, recent year performance weakened, with significant declines in gross profit (-26.64%) and EBIT (-29.27%), indicating operational challenges.
Which one has the stronger fundamentals?
Duke Energy exhibits stronger fundamentals with favorable growth across revenue, net income, and margins over the period. Its 2024 performance shows resilience and margin expansion, despite slightly higher interest expenses. In contrast, Public Service Enterprise Group faces unfavorable income trends recently, with declining profitability and shrinking earnings, signaling weaker income statement health overall.
Financial Ratios Comparison
The table below presents a side-by-side comparison of key financial ratios for Duke Energy Corporation (DUK) and Public Service Enterprise Group Incorporated (PEG) for their most recent fiscal year, 2024.
| Ratios | Duke Energy Corporation (DUK) | Public Service Enterprise Group Incorporated (PEG) |
|---|---|---|
| ROE | 9.0% | 11.0% |
| ROIC | 4.0% | 4.4% |
| P/E | 18.4 | 23.7 |
| P/B | 1.66 | 2.61 |
| Current Ratio | 0.67 | 0.65 |
| Quick Ratio | 0.44 | 0.48 |
| D/E (Debt-to-Equity) | 1.70 | 1.42 |
| Debt-to-Assets | 45.7% | 41.9% |
| Interest Coverage | 2.34 | 2.80 |
| Asset Turnover | 0.16 | 0.19 |
| Fixed Asset Turnover | 0.24 | 0.26 |
| Payout ratio | 71.2% | 67.5% |
| Dividend yield | 3.86% | 2.84% |
Interpretation of the Ratios
Duke Energy Corporation
Duke Energy shows mixed financial ratios with strengths in net margin (14.86%, favorable) and dividend yield (3.86%, favorable), but weaknesses in return on equity (9.0%, unfavorable) and current ratio (0.67, unfavorable). The company maintains a consistent dividend payout supported by a solid yield, though free cash flow coverage is limited, posing potential risks for sustainability.
Public Service Enterprise Group Incorporated
Public Service Enterprise Group reports favorable net margin (17.22%) and dividend yield (2.84%), with neutral to slightly unfavorable metrics in return on equity (11.0%, neutral) and debt ratios. Dividend payments are steady, reflecting a balanced approach, but free cash flow yields are negative, indicating possible challenges in cash generation for dividends or buybacks.
Which one has the best ratios?
Both companies exhibit a slightly unfavorable overall ratio profile with 21.43% favorable ratios each. Duke Energy’s stronger dividend yield contrasts with Public Service Enterprise Group’s better net margin and slightly lower leverage. Neither stands out decisively; their ratio strengths and weaknesses reflect typical utility sector trade-offs.
Strategic Positioning
This section compares the strategic positioning of Duke Energy Corporation and Public Service Enterprise Group Incorporated, covering Market position, Key segments, and Exposure to technological disruption:
Duke Energy Corporation
- Large market cap near 91B, operates mainly in Southeast and Midwest, faces regulated electric industry pressure
- Diversified segments: Electric Utilities, Gas Utilities, Commercial Renewables with 3.5GW renewable capacity
- Exposure via renewables and energy storage projects, with multiple wind, solar, and battery facilities
Public Service Enterprise Group Incorporated
- Smaller market cap about 39B, focused on Northeastern and Mid-Atlantic US, also in regulated electric sector
- Two segments: PSE&G (electricity and gas distribution) and PSEG Power, with investments in solar and efficiency programs
- Some exposure through solar generation projects and energy efficiency investments within PSE&G segment
Duke Energy Corporation vs Public Service Enterprise Group Incorporated Positioning
Duke Energy pursues a diversified approach with electric, gas, and renewable segments serving multiple states, while Public Service Enterprise Group concentrates on electric and gas distribution plus power generation in a smaller geographic footprint. Diversification offers broader business drivers; concentration may simplify operations but limits scale.
Which has the best competitive advantage?
Both companies show slightly unfavorable MOAT statuses, shedding value despite growing ROIC trends. Duke Energy’s larger scale and renewable investments contrast with PSEG’s regional focus; neither demonstrates a clear sustainable competitive advantage based on current ROIC versus WACC data.
Stock Comparison
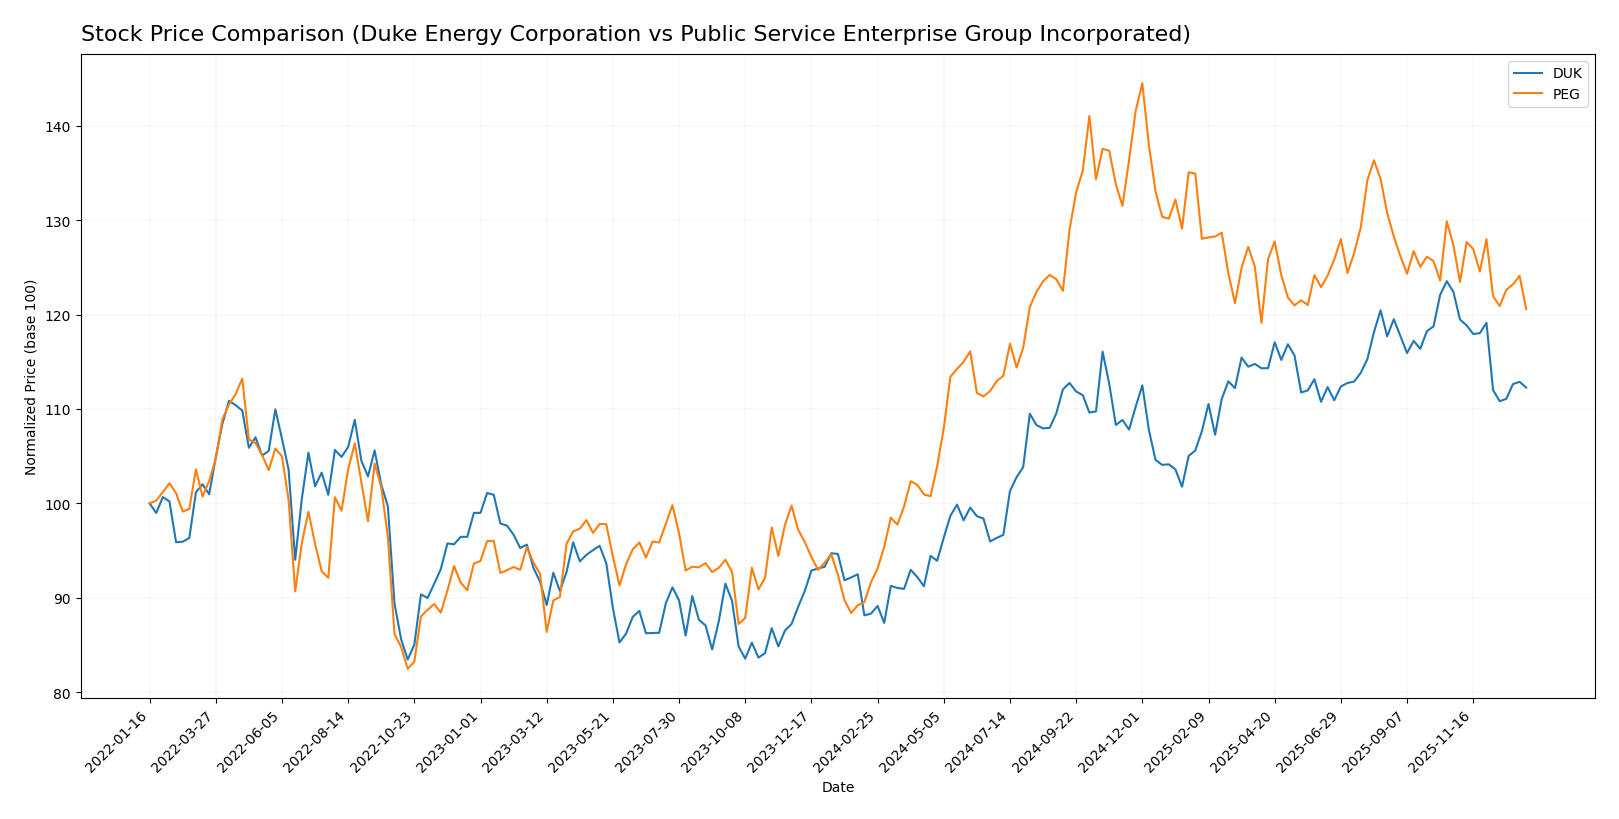
The stock prices of Duke Energy Corporation (DUK) and Public Service Enterprise Group Incorporated (PEG) have exhibited significant bullish trends over the past 12 months, with both showing deceleration in momentum and recent downward pressure in share prices.
Trend Analysis
Duke Energy Corporation’s stock rose 27.12% over the past year, displaying a bullish trend with decelerating price gains. The highest price reached 128.53, with a low of 90.86. Recent months show a -8.3% decline, indicating short-term bearish pressure.
Public Service Enterprise Group’s stock increased 31.59% over the same period, also bullish with deceleration. The price ranged from 59.79 to 94.3. Its recent trend shows a moderate -5.33% drop, reflecting some short-term weakness.
Comparing both, PEG delivered higher market performance with a 31.59% gain versus DUK’s 27.12% over the last year, despite both facing recent price declines.
Target Prices
Analysts provide a bullish consensus for Duke Energy Corporation and Public Service Enterprise Group Incorporated.
| Company | Target High | Target Low | Consensus |
|---|---|---|---|
| Duke Energy Corporation | 150 | 126 | 135.91 |
| Public Service Enterprise Group | 98 | 83 | 89 |
The target consensus prices for both utilities exceed their current stock prices, indicating expected upside potential according to analysts. Duke Energy’s consensus target is about 16% above its current price, while Public Service Enterprise Group shows a roughly 13% upside.
Analyst Opinions Comparison
This section compares analysts’ ratings and grades for Duke Energy Corporation and Public Service Enterprise Group Incorporated:
Rating Comparison
DUK Rating
- Rating: C+ with a “Very Favorable” status reflecting a solid overall assessment.
- Discounted Cash Flow Score: 1, rated “Very Unfavorable,” suggesting undervaluation concerns.
- ROE Score: 3, “Moderate” efficiency in generating profit from equity.
- ROA Score: 3, “Moderate” asset utilization for earnings.
- Debt To Equity Score: 2, “Moderate” financial risk with balanced leverage.
- Overall Score: 2, “Moderate” summary of financial standing.
PEG Rating
- Rating: B- with a “Very Favorable” status indicating a stronger overall view.
- Discounted Cash Flow Score: 1, also “Very Unfavorable,” showing similar concerns.
- ROE Score: 4, “Favorable,” indicating more efficient profit generation.
- ROA Score: 4, “Favorable,” showing better asset efficiency.
- Debt To Equity Score: 2, also “Moderate,” indicating comparable financial risk.
- Overall Score: 3, “Moderate,” but higher than DUK, reflecting better overall metrics.
Which one is the best rated?
Based strictly on the provided data, PEG holds a higher overall rating (B-) and better scores for ROE and ROA compared to DUK’s C+. Both share low discounted cash flow and moderate debt-to-equity scores, but PEG’s stronger profitability metrics suggest a better analyst rating overall.
Scores Comparison
Here is a comparison of the financial scores for Duke Energy Corporation and Public Service Enterprise Group Incorporated:
DUK Scores
- Altman Z-Score: 0.71, indicating financial distress zone.
- Piotroski Score: 6, reflecting average financial strength.
PEG Scores
- Altman Z-Score: 1.32, also in financial distress zone.
- Piotroski Score: 7, indicating strong financial strength.
Which company has the best scores?
PEG shows a higher Piotroski Score of 7 compared to DUK’s 6, suggesting stronger financial health. Both companies have Altman Z-Scores in the distress zone, but PEG’s score is closer to the grey area threshold.
Grades Comparison
Here is a detailed comparison of the latest reliable grades for Duke Energy Corporation and Public Service Enterprise Group Incorporated:
Duke Energy Corporation Grades
The table below summarizes recent analyst grades for Duke Energy Corporation:
| Grading Company | Action | New Grade | Date |
|---|---|---|---|
| UBS | Maintain | Neutral | 2025-12-17 |
| JP Morgan | Maintain | Neutral | 2025-12-11 |
| Mizuho | Maintain | Outperform | 2025-10-27 |
| Morgan Stanley | Maintain | Equal Weight | 2025-10-22 |
| Barclays | Maintain | Overweight | 2025-10-14 |
| UBS | Maintain | Neutral | 2025-10-10 |
| BMO Capital | Maintain | Outperform | 2025-10-10 |
| Scotiabank | Upgrade | Sector Outperform | 2025-10-03 |
| Jefferies | Downgrade | Hold | 2025-09-26 |
| Morgan Stanley | Maintain | Equal Weight | 2025-09-25 |
Overall, Duke Energy’s grades show a stable to moderately positive trend, with several “Outperform” and “Overweight” ratings balanced by neutral and hold recommendations.
Public Service Enterprise Group Incorporated Grades
The table below summarizes recent analyst grades for Public Service Enterprise Group Incorporated:
| Grading Company | Action | New Grade | Date |
|---|---|---|---|
| Ladenburg Thalmann | Upgrade | Buy | 2026-01-07 |
| UBS | Maintain | Buy | 2025-12-17 |
| JP Morgan | Maintain | Overweight | 2025-12-12 |
| Jefferies | Upgrade | Buy | 2025-11-06 |
| TD Cowen | Maintain | Buy | 2025-11-05 |
| BMO Capital | Maintain | Market Perform | 2025-11-04 |
| Barclays | Maintain | Equal Weight | 2025-10-21 |
| BMO Capital | Maintain | Market Perform | 2025-10-20 |
| Morgan Stanley | Maintain | Overweight | 2025-09-25 |
| BMO Capital | Maintain | Market Perform | 2025-08-06 |
Public Service Enterprise Group exhibits a predominantly positive grading trend, with numerous “Buy” and “Overweight” ratings and few lower assessments.
Which company has the best grades?
Public Service Enterprise Group has received stronger and more consistent buy-side grades compared to Duke Energy’s more mixed outlook, potentially indicating a comparatively higher analyst confidence that could influence investor sentiment and portfolio positioning.
Strengths and Weaknesses
Below is a comparative overview of the key strengths and weaknesses of Duke Energy Corporation (DUK) and Public Service Enterprise Group Incorporated (PEG) based on recent financial and operational data.
| Criterion | Duke Energy Corporation (DUK) | Public Service Enterprise Group Incorporated (PEG) |
|---|---|---|
| Diversification | Primarily electric utilities with growing gas and renewables segments; moderate diversification in energy sources. | Focused on electric and gas utilities with multiple contract revenues; moderately diversified within utility services. |
| Profitability | Net margin at 14.86% (favorable); ROIC at 4.02% below WACC, indicating value destruction but improving profitability trend. | Net margin stronger at 17.22% (favorable); ROIC at 4.4%, also below WACC, signaling value destruction but with positive ROIC growth. |
| Innovation | Moderate innovation in commercial renewables, representing a small but growing segment. | Innovation less visible but steady operations in transmission and contract services suggest operational stability. |
| Global presence | Primarily US-focused utilities with limited international exposure. | Mainly US regional utility presence with no significant global footprint. |
| Market Share | Large player in electric utilities with $26.8B revenue in this segment, strong infrastructure base. | Significant market share in gas distribution and electric utilities with $3.98B revenue in Public Service Electric and Gas Company segment. |
Key takeaways: Both companies operate in similar sectors with a strong US utility focus and moderate diversification. They face challenges in creating value as ROIC is below WACC, though profitability is improving. Duke shows more emphasis on renewable innovation, while PEG has a steadier contract and transmission revenue base. Investors should weigh growth potential against current value destruction risks.
Risk Analysis
Below is a comparative table of key risks for Duke Energy Corporation (DUK) and Public Service Enterprise Group Incorporated (PEG) based on the latest available data from 2024.
| Metric | Duke Energy Corporation (DUK) | Public Service Enterprise Group (PEG) |
|---|---|---|
| Market Risk | Beta 0.49 (low volatility) | Beta 0.613 (moderate volatility) |
| Debt level | Debt-to-Equity 1.7 (unfavorable) | Debt-to-Equity 1.42 (unfavorable) |
| Regulatory Risk | High (regulated electric utility in several states) | High (regulated electric utility in Northeast US) |
| Operational Risk | Moderate (diverse generation mix but aging assets) | Moderate (large grid infrastructure and gas distribution) |
| Environmental Risk | Medium (coal, gas, renewables mix; transition risks) | Medium (solar investments but reliance on fossil fuels) |
| Geopolitical Risk | Low (domestic US operations) | Low (domestic US operations) |
The most impactful risks for both companies are regulatory and debt-related. Both operate in heavily regulated utility sectors with significant capital expenditures and leverage, posing financial strain. Duke Energy’s lower beta suggests less market volatility risk, but both are in the distress zone per Altman Z-Score, indicating financial vulnerability. Environmental transition poses medium risk as both work to shift toward renewables amid regulatory pressure.
Which Stock to Choose?
Duke Energy Corporation (DUK) shows favorable income evolution with a 29.92% revenue increase and 227.52% net income growth over 2020-2024. Its profitability is positive, but financial ratios reveal a slightly unfavorable overall status, with debt levels and liquidity concerns. The rating stands at C+ with moderate scores, while the Altman Z-Score signals financial distress and a moderate Piotroski score.
Public Service Enterprise Group Incorporated (PEG) has an unfavorable income evolution, marked by recent declines and a 6.98% net income decrease over the same period. Financial ratios are slightly better than DUK’s, with fewer unfavorable metrics, and a higher rating of B-, supported by stronger return on equity and assets scores. PEG’s Altman Z-Score also indicates distress but pairs with a stronger Piotroski score.
Investors focused on growth might find Duke Energy’s improving profitability and income growth more appealing, whereas those prioritizing financial stability could see Public Service Enterprise Group’s stronger rating and financial ratios as more favorable. Both companies show signs of value destruction but improving profitability, suggesting caution depending on risk tolerance and investment strategy.
Disclaimer: Investment carries a risk of loss of initial capital. The past performance is not a reliable indicator of future results. Be sure to understand risks before making an investment decision.
Go Further
I encourage you to read the complete analyses of Duke Energy Corporation and Public Service Enterprise Group Incorporated to enhance your investment decisions: