In the evolving landscape of regulated electric utilities, Duke Energy Corporation and PPL Corporation stand out as key players shaping the industry’s future. Both companies operate in overlapping markets, focusing on electricity generation and distribution, while embracing innovation through renewable energy integration. This comparison will explore their strategies, financial health, and growth potential to help you decide which company merits a place in your investment portfolio. Let’s uncover which utility offers the most compelling opportunity for investors today.

Table of contents
Companies Overview
I will begin the comparison between Duke Energy Corporation and PPL Corporation by providing an overview of these two companies and their main differences.
Duke Energy Corporation Overview
Duke Energy Corporation operates as an energy company in the US, focusing on electric utilities, gas utilities, and commercial renewables. Serving approximately 8.2M customers across six states, Duke generates electricity using coal, natural gas, hydro, nuclear, and renewables. With 50,259 MW of generation capacity and 3,554 MW in renewable facilities, it covers a 91,000-square-mile service territory in the Southeast and Midwest regions.
PPL Corporation Overview
PPL Corporation is a utility holding company delivering electricity and natural gas in the US and UK. It serves about 2.7M customers across Kentucky, Pennsylvania, and southwestern Virginia. PPL generates power from coal, gas, hydro, and solar, and operates through Kentucky and Pennsylvania regulated segments. Founded in 1920, it is headquartered in Allentown, PA, with a more regional focus compared to Duke.
Key similarities and differences
Both companies operate in the regulated electric utility sector and provide electricity and natural gas services. Duke has a broader geographic reach and a larger customer base, with substantial renewable energy investments. PPL operates primarily regionally with a focus on Kentucky and Pennsylvania and fewer employees. Duke’s business is more diversified across three segments, while PPL concentrates on two regulated segments.
Income Statement Comparison
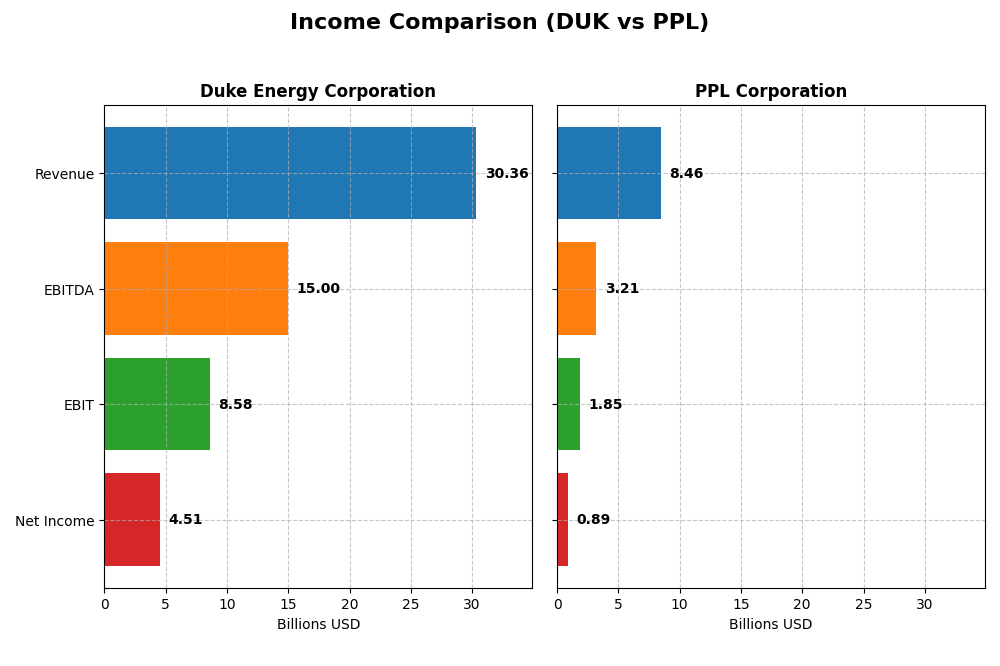
The table below compares key income statement metrics for Duke Energy Corporation and PPL Corporation for the fiscal year 2024, providing a snapshot of their financial performance.
| Metric | Duke Energy Corporation | PPL Corporation |
|---|---|---|
| Market Cap | 90.8B | 25.6B |
| Revenue | 30.4B | 8.5B |
| EBITDA | 15.0B | 3.2B |
| EBIT | 8.6B | 1.9B |
| Net Income | 4.5B | 888M |
| EPS | 5.71 | 1.20 |
| Fiscal Year | 2024 | 2024 |
Income Statement Interpretations
Duke Energy Corporation
Duke Energy showed consistent revenue growth from 23.7B in 2020 to 30.4B in 2024, with net income rising significantly from 1.28B to 4.51B over the same period. Margins improved notably, with gross margin at 50.06% and net margin at 14.86% in 2024. The recent year indicated stable revenue growth at 4.46%, strong EBIT expansion, and a slight net margin increase, reflecting improved operational efficiency.
PPL Corporation
PPL’s revenue increased steadily from 5.47B in 2020 to 8.46B in 2024, although net income showed volatility, dropping from 1.47B in 2020 to 888M in 2024. Margins remain favorable but lower than Duke’s, with a 40.1% gross margin and 10.49% net margin in 2024. The latest year saw modest revenue growth at 1.8%, positive EBIT and net margin growth, but an overall decline in net income and EPS over the five-year span.
Which one has the stronger fundamentals?
Duke Energy demonstrates stronger fundamentals with consistent revenue and net income growth, superior margins, and predominantly favorable income statement trends. Conversely, PPL, despite revenue gains and some margin improvements, struggles with declining net income and EPS over the period. Duke’s higher margin stability and earnings growth indicate more robust income statement health under current data.
Financial Ratios Comparison
The table below presents a side-by-side comparison of key financial ratios for Duke Energy Corporation (DUK) and PPL Corporation (PPL) based on their most recent fiscal year data (2024).
| Ratios | Duke Energy Corporation (DUK) | PPL Corporation (PPL) |
|---|---|---|
| ROE | 8.997% | 6.308% |
| ROIC | 4.017% | 3.588% |
| P/E | 18.44 | 26.97 |
| P/B | 1.66 | 1.70 |
| Current Ratio | 0.67 | 0.86 |
| Quick Ratio | 0.44 | 0.71 |
| D/E (Debt-to-Equity) | 1.70 | 1.19 |
| Debt-to-Assets | 45.7% | 40.9% |
| Interest Coverage | 2.34 | 2.36 |
| Asset Turnover | 0.16 | 0.21 |
| Fixed Asset Turnover | 0.24 | 0.26 |
| Payout ratio | 71.2% | 84.1% |
| Dividend yield | 3.86% | 3.12% |
Interpretation of the Ratios
Duke Energy Corporation
Duke Energy shows a mixed ratio profile with a strong net margin of 14.86% and a favorable dividend yield of 3.86%. However, several key ratios such as return on equity (9.0%), return on invested capital (4.02%), and liquidity ratios are unfavorable, indicating operational and financial efficiency concerns. The company pays dividends supported by a moderate payout, but coverage by free cash flow appears weak, which could pose sustainability risks.
PPL Corporation
PPL exhibits favorable net margin (10.49%) and dividend yield (3.12%), yet profitability ratios like return on equity (6.31%) and return on invested capital (3.59%) are below expectations. Liquidity and leverage ratios remain unfavorable, and the price-to-earnings ratio is elevated at 26.97, signaling valuation concerns. PPL also pays dividends but may face challenges maintaining distributions amid weaker cash flow metrics.
Which one has the best ratios?
Both companies have a similar proportion of favorable ratios (21.43%), but Duke Energy has a slightly better overall ratio profile due to stronger profitability and a more attractive dividend yield. PPL’s higher valuation multiples and weaker profitability contribute to a less favorable assessment. Nonetheless, both firms face significant liquidity and efficiency challenges, warranting cautious analysis.
Strategic Positioning
This section compares the strategic positioning of Duke Energy Corporation and PPL Corporation, including market position, key segments, and exposure to disruption:
Duke Energy Corporation
- Large market cap of $90.8B in regulated electric utilities with low beta of 0.49, facing stable competitive pressure.
- Diversified segments: Electric Utilities and Infrastructure ($26.8B), Gas Utilities ($2.3B), and Commercial Renewables with wind, solar, and battery assets.
- Exposure to technological disruption through 23 wind, 178 solar, and 2 battery storage facilities, plus fuel cells across 22 states.
PPL Corporation
- Smaller market cap of $25.6B, also in regulated electric utilities, with moderate beta of 0.72, facing regional competition.
- Focused on regulated electric and natural gas in Kentucky and Pennsylvania, with revenues mainly from Kentucky ($3.6B) and Pennsylvania ($2.9B) segments.
- Limited explicit mention of renewables or energy storage; generation includes coal, gas, hydro, and solar in Kentucky, indicating moderate exposure.
Duke Energy Corporation vs PPL Corporation Positioning
Duke Energy pursues a diversified approach with multiple energy sources and renewables, enhancing resilience but increasing complexity. PPL remains concentrated in regulated regional markets with a focus on traditional utilities, offering streamlined operations but less diversification in growth areas.
Which has the best competitive advantage?
Both companies exhibit slightly unfavorable moat evaluations, shedding value yet showing growing ROIC trends. Duke Energy’s larger scale and renewable investments suggest broader potential, while PPL’s smaller scale and regional focus limit its competitive breadth.
Stock Comparison
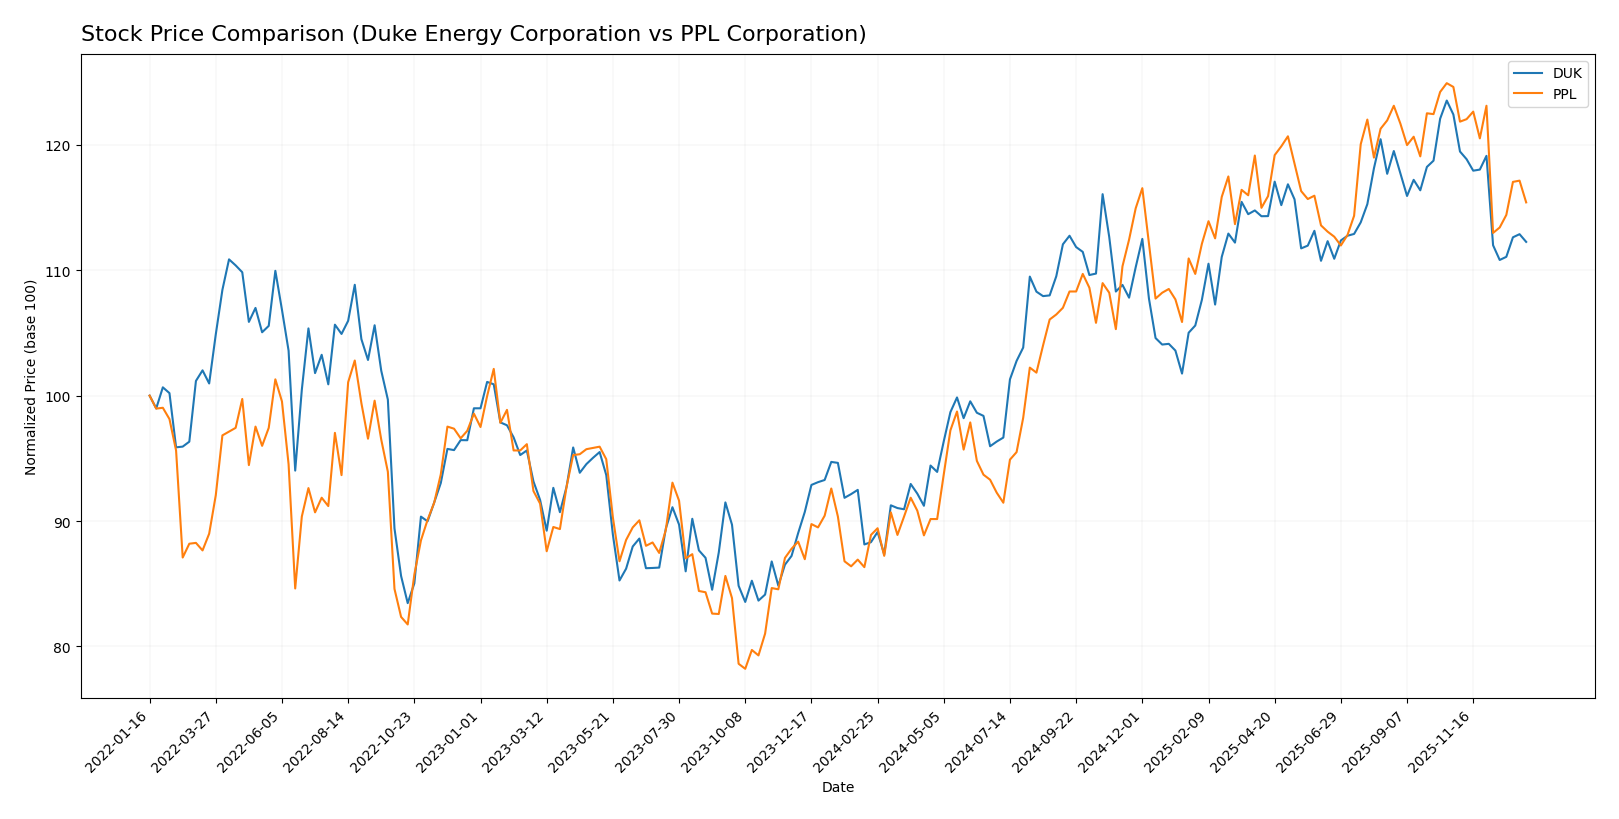
The stock prices of Duke Energy Corporation (DUK) and PPL Corporation (PPL) show significant bullish trends over the past 12 months, with both experiencing deceleration in growth and recent downward movements in Q4 2025 to early 2026.
Trend Analysis
Duke Energy Corporation’s stock rose 27.12% over the past year, indicating a bullish trend with decelerating momentum. The price fluctuated between 90.86 and 128.53, with recent declines of 8.3% suggesting a short-term bearish movement.
PPL Corporation’s stock increased 29.84% over the same period, also showing a bullish trend with deceleration. Its price ranged from 26.14 to 37.44, with a recent 7.39% drop reflecting a mild bearish trend.
Comparing the two, PPL delivered the highest market performance with a 29.84% gain versus Duke Energy’s 27.12%, despite both showing similar deceleration and recent short-term declines.
Target Prices
The current analyst consensus suggests moderate upside potential for these utility stocks.
| Company | Target High | Target Low | Consensus |
|---|---|---|---|
| Duke Energy Corporation | 150 | 126 | 135.91 |
| PPL Corporation | 45 | 36 | 41.29 |
Analysts expect Duke Energy’s stock to appreciate from its $116.8 price toward a consensus near $136, while PPL’s shares could rise from $34.59 to around $41, indicating positive market sentiment.
Analyst Opinions Comparison
This section compares analysts’ ratings and grades for Duke Energy Corporation and PPL Corporation:
Rating Comparison
DUK Rating
- Rating: C+, considered Very Favorable overall by analysts.
- Discounted Cash Flow Score: 1, rated Very Unfavorable, indicating concerns on valuation.
- ROE Score: 3, Moderate rating, showing average efficiency in generating profit from equity.
- ROA Score: 3, Moderate rating, reflecting average asset utilization effectiveness.
- Debt To Equity Score: 2, Moderate rating, indicating moderate financial risk.
- Overall Score: 2, Moderate rating summarizing the company’s financial standing.
PPL Rating
- Rating: C+, considered Very Favorable overall by analysts.
- Discounted Cash Flow Score: 1, rated Very Unfavorable, indicating concerns on valuation.
- ROE Score: 3, Moderate rating, showing average efficiency in generating profit from equity.
- ROA Score: 3, Moderate rating, reflecting average asset utilization effectiveness.
- Debt To Equity Score: 2, Moderate rating, indicating moderate financial risk.
- Overall Score: 2, Moderate rating summarizing the company’s financial standing.
Which one is the best rated?
Both Duke Energy and PPL Corporation share identical ratings and financial scores, all assessed as moderate or very unfavorable in the same categories. Therefore, neither company is distinctly better rated based on this data.
Scores Comparison
Here is the comparison of the Altman Z-Score and Piotroski Score for the two companies:
Duke Energy Corporation Scores
- Altman Z-Score: 0.71, placing Duke in distress zone with high bankruptcy risk.
- Piotroski Score: 6, indicating average financial strength.
PPL Corporation Scores
- Altman Z-Score: 0.97, placing PPL in distress zone with high bankruptcy risk.
- Piotroski Score: 6, indicating average financial strength.
Which company has the best scores?
Both Duke Energy and PPL have Altman Z-Scores in the distress zone, indicating high bankruptcy risk, and equal Piotroski Scores of 6, reflecting average financial strength. Neither company shows a clear advantage in scores based on this data.
Grades Comparison
Here is a comparison of the latest reliable grades and ratings for Duke Energy Corporation and PPL Corporation:
Duke Energy Corporation Grades
The table below summarizes recent grades from well-known financial institutions for Duke Energy Corporation:
| Grading Company | Action | New Grade | Date |
|---|---|---|---|
| UBS | Maintain | Neutral | 2025-12-17 |
| JP Morgan | Maintain | Neutral | 2025-12-11 |
| Mizuho | Maintain | Outperform | 2025-10-27 |
| Morgan Stanley | Maintain | Equal Weight | 2025-10-22 |
| Barclays | Maintain | Overweight | 2025-10-14 |
| UBS | Maintain | Neutral | 2025-10-10 |
| BMO Capital | Maintain | Outperform | 2025-10-10 |
| Scotiabank | Upgrade | Sector Outperform | 2025-10-03 |
| Jefferies | Downgrade | Hold | 2025-09-26 |
| Morgan Stanley | Maintain | Equal Weight | 2025-09-25 |
Duke Energy’s grades mostly range from Neutral to Outperform, with a consensus rating of Hold, indicating moderate outlook stability.
PPL Corporation Grades
The table below presents recent grades from recognized grading firms for PPL Corporation:
| Grading Company | Action | New Grade | Date |
|---|---|---|---|
| UBS | Maintain | Neutral | 2025-12-17 |
| Wells Fargo | Maintain | Overweight | 2025-12-12 |
| JP Morgan | Maintain | Overweight | 2025-12-11 |
| BMO Capital | Maintain | Outperform | 2025-10-21 |
| B of A Securities | Maintain | Buy | 2025-10-16 |
| Barclays | Maintain | Equal Weight | 2025-10-14 |
| UBS | Maintain | Neutral | 2025-10-10 |
| Morgan Stanley | Maintain | Overweight | 2025-09-25 |
| Barclays | Maintain | Equal Weight | 2025-07-01 |
| Morgan Stanley | Maintain | Overweight | 2025-06-18 |
PPL Corporation shows a stronger bias toward positive ratings, including several Overweight and Buy grades, with a consensus rating of Buy.
Which company has the best grades?
PPL Corporation has received generally more favorable grades than Duke Energy Corporation, with a consensus Buy versus Hold for Duke. This suggests PPL is currently viewed with higher growth or value potential, which might influence investors seeking stronger upside prospects.
Strengths and Weaknesses
The table below summarizes key strengths and weaknesses of Duke Energy Corporation (DUK) and PPL Corporation (PPL) based on recent financial data, profitability trends, innovation capacity, global footprint, and market share.
| Criterion | Duke Energy Corporation (DUK) | PPL Corporation (PPL) |
|---|---|---|
| Diversification | Strong focus on Electric Utilities ($26.8B) and Gas Utilities ($2.3B); limited other segments | Primarily regional regulated utilities in Kentucky, Pennsylvania, Rhode Island; less diversified |
| Profitability | Net margin favorable (14.86%), ROIC slightly below WACC (4.02% vs 4.8%), growing ROIC trend | Net margin favorable (10.49%), ROIC below WACC (3.59% vs 5.5%), growing ROIC but less than DUK |
| Innovation | Moderate investment in Commercial Renewables (~$460-500M annually), showing commitment to green energy | Limited visible innovation investment; focus remains on regulated utilities |
| Global presence | Primarily U.S.-based with strong regional footprint; limited international exposure | Mainly U.S. regional utilities with some historical UK presence, now focused domestically |
| Market Share | Leader in electric and gas utilities with $29B total revenue; diversified customer base | Smaller scale with ~$8.5B revenue concentrated in three states; niche market presence |
In summary, Duke Energy offers greater diversification and a stronger market presence with moderate innovation in renewables, but it faces challenges in efficiently using capital. PPL shows steady profitability growth despite a narrower market and less diversification, but its higher cost of capital and less innovation may limit long-term competitive advantage. Investors should weigh Duke’s broader scale against PPL’s regional stability.
Risk Analysis
Below is a comparison table outlining key risks for Duke Energy Corporation (DUK) and PPL Corporation (PPL) as of 2024.
| Metric | Duke Energy Corporation (DUK) | PPL Corporation (PPL) |
|---|---|---|
| Market Risk | Low beta (0.49) reduces volatility exposure | Moderate beta (0.72) implies higher market sensitivity |
| Debt level | High debt-to-equity (1.7), moderate risk | Moderate debt-to-equity (1.19), moderate risk |
| Regulatory Risk | High, due to regulated electric utilities and multiple jurisdictions | High, operates in US and UK regulated markets |
| Operational Risk | Complex energy mix including coal, nuclear, renewables | Diverse generation but smaller scale, moderate complexity |
| Environmental Risk | Material, given coal and nuclear assets amid transition to renewables | Moderate, with coal and gas exposure but increasing renewables |
| Geopolitical Risk | Low, primarily US-focused operations | Moderate, with exposure to UK market uncertainties |
The most impactful risks for both companies are regulatory and environmental, given their reliance on regulated utilities and fossil fuel assets. Both firms face financial strain reflected in their Altman Z-scores in the distress zone, signaling caution. Duke’s larger scale and diversification into renewables slightly mitigate operational risks, while PPL’s international exposure adds geopolitical uncertainty. Investors should weigh these risks carefully against dividend yields and sector stability.
Which Stock to Choose?
Duke Energy Corporation (DUK) has shown favorable income statement trends with a 30% revenue growth and 228% net income increase over 2020-2024, but its financial ratios are slightly unfavorable overall, marked by low liquidity and high debt levels; the company’s rating is very favorable (C+), yet its Altman Z-score signals distress.
PPL Corporation (PPL) demonstrates a favorable income profile with 55% revenue growth but a decline in net income by 40% over the period; its financial ratios are generally unfavorable with moderate debt and liquidity concerns, sharing the same very favorable (C+) rating as DUK, although it also resides in the Altman Z-score distress zone.
Investors focused on growth might find DUK’s consistent profitability growth and improving ROIC more appealing, while those prioritizing revenue expansion despite net income challenges could interpret PPL’s profile as fitting; both companies show signs of value destruction but improving profitability, suggesting cautious evaluation based on risk tolerance.
Disclaimer: Investment carries a risk of loss of initial capital. The past performance is not a reliable indicator of future results. Be sure to understand risks before making an investment decision.
Go Further
I encourage you to read the complete analyses of Duke Energy Corporation and PPL Corporation to enhance your investment decisions: