In the evolving landscape of regulated electric utilities, Duke Energy Corporation and Pinnacle West Capital Corporation stand out as prominent players. Both companies focus on electricity generation, transmission, and distribution, yet differ in scale, regional influence, and renewable energy initiatives. This comparison highlights their market positions and innovation strategies, helping investors like you decide which offers the most compelling opportunity for a balanced and forward-looking investment portfolio.

Table of contents
Companies Overview
I will begin the comparison between Duke Energy Corporation and Pinnacle West Capital Corporation by providing an overview of these two companies and their main differences.
Duke Energy Corporation Overview
Duke Energy Corporation operates as a leading energy company in the United States with a mission to provide reliable and sustainable energy. It serves approximately 8.2M customers across six states in the Southeast and Midwest. Its operations span electric utilities, gas utilities, and commercial renewables, owning roughly 50,259 MW of generation capacity including coal, nuclear, natural gas, and renewable sources.
Pinnacle West Capital Corporation Overview
Pinnacle West Capital Corporation, through its subsidiary Arizona Public Service, primarily serves retail and wholesale electric customers in Arizona. With around 1.3M customers, it generates, transmits, and distributes electricity using coal, nuclear, gas, oil, and solar facilities. The company owns about 6,323 MW of regulated generation capacity and maintains extensive transmission and distribution infrastructure in the region.
Key similarities and differences
Both companies operate in the regulated electric utility industry, focusing on electricity generation and distribution with diversified energy sources including renewables. Duke Energy has a significantly larger customer base and generation capacity than Pinnacle West. While Duke operates across multiple states with a strong renewables segment, Pinnacle West is regionally focused in Arizona with a substantial transmission network, reflecting differences in scale and geographic reach.
Income Statement Comparison
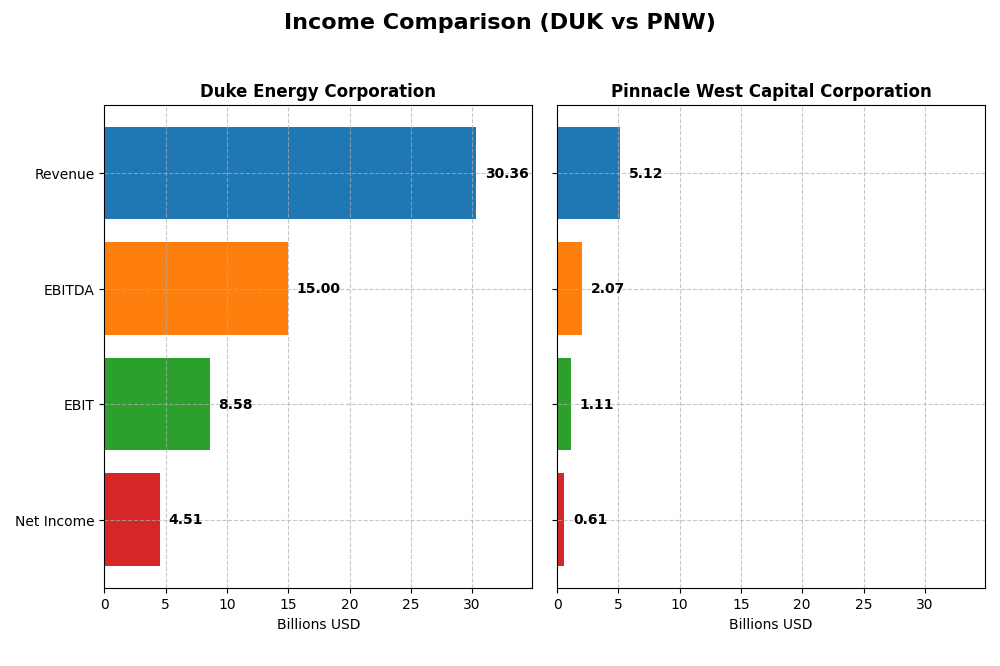
This table compares key financial metrics from the most recent fiscal year of two regulated electric utilities, highlighting their market capitalization, revenue, profitability, and earnings per share.
| Metric | Duke Energy Corporation (DUK) | Pinnacle West Capital Corporation (PNW) |
|---|---|---|
| Market Cap | 90.8B | 10.7B |
| Revenue | 30.4B | 5.1B |
| EBITDA | 15.0B | 2.1B |
| EBIT | 8.6B | 1.1B |
| Net Income | 4.5B | 609M |
| EPS | 5.71 | 5.35 |
| Fiscal Year | 2024 | 2024 |
Income Statement Interpretations
Duke Energy Corporation
Duke Energy’s revenue grew steadily from 23.4B in 2020 to 30.4B in 2024, with net income surging from 1.3B to 4.5B over the same period. Margins improved overall, with a gross margin at 50.06% and net margin at 14.86% in 2024. The latest year showed moderate revenue growth of 4.46%, while gross profit and EBIT margins expanded favorably.
Pinnacle West Capital Corporation
Pinnacle West’s revenue increased from 3.6B in 2020 to 5.1B in 2024, with net income rising from 551M to 609M. Margins remain favorable, with a 41.7% gross margin and 11.88% net margin in 2024. The most recent year saw a strong 9.13% revenue growth and notable improvements in gross profit and EBIT, alongside a positive net margin growth of 11.22%.
Which one has the stronger fundamentals?
Both companies exhibit favorable income statement trends, with Duke Energy showing stronger overall growth in net income and margins over five years. Pinnacle West demonstrates higher revenue growth rates recently but has a less favorable long-term net margin trend. Duke’s higher interest expense is a concern, while Pinnacle West maintains a neutral interest expense status, balancing their fundamental strengths.
Financial Ratios Comparison
The table below presents a side-by-side comparison of key financial ratios for Duke Energy Corporation (DUK) and Pinnacle West Capital Corporation (PNW) based on their most recent fiscal year data (2024).
| Ratios | Duke Energy Corporation (DUK) | Pinnacle West Capital Corporation (PNW) |
|---|---|---|
| ROE | 9.0% | 9.0% |
| ROIC | 4.0% | 3.5% |
| P/E | 18.4 | 15.9 |
| P/B | 1.66 | 1.43 |
| Current Ratio | 0.67 | 0.59 |
| Quick Ratio | 0.44 | 0.42 |
| D/E (Debt to Equity) | 1.70 | 1.64 |
| Debt-to-Assets | 45.7% | 42.3% |
| Interest Coverage | 2.34 | 2.68 |
| Asset Turnover | 0.16 | 0.20 |
| Fixed Asset Turnover | 0.24 | 0.25 |
| Payout ratio | 71.2% | 64.8% |
| Dividend yield | 3.86% | 4.09% |
Interpretation of the Ratios
Duke Energy Corporation
Duke Energy shows mixed ratio strength with a favorable net margin (14.86%) and dividend yield (3.86%), but unfavorable returns on equity (9.0%) and invested capital (4.02%). Its liquidity ratios and asset turnover are weak, raising concerns about operational efficiency. The company maintains a stable dividend payout supported by cash flows, yet free cash flow to equity remains negative, signaling potential risks in sustaining distributions.
Pinnacle West Capital Corporation
Pinnacle West Capital also exhibits a favorable net margin (11.88%) and dividend yield (4.09%), with a slightly better price-to-book ratio (1.43) than Duke. However, it faces similar challenges with low returns on equity (9.01%) and invested capital (3.48%), and weak liquidity ratios. The firm pays dividends consistently, though negative free cash flow to equity indicates cautious monitoring of dividend sustainability.
Which one has the best ratios?
Both firms share a slightly unfavorable global ratio opinion, with half of their ratios marked unfavorable. Pinnacle West edges Duke in favorable ratios percentage and valuation multiples, yet both struggle with liquidity and asset efficiency. Overall, neither company demonstrates a clear superiority in ratio strength, reflecting comparable financial challenges in the regulated electric sector.
Strategic Positioning
This section compares the strategic positioning of Duke Energy Corporation and Pinnacle West Capital Corporation, including market position, key segments, and exposure to technological disruption:
Duke Energy Corporation
- Large market cap (~$90.8B) with diversified regional presence in Southeast and Midwest, facing regulated electric competition.
- Diverse business segments: Electric Utilities (~$26.8B), Gas Utilities (~$2.3B), and Commercial Renewables (wind, solar, storage).
- Moderate exposure to technological disruption via renewables and energy storage projects across 22 states.
Pinnacle West Capital Corporation
- Smaller market cap (~$10.7B), focused on Arizona, operating in a regulated electric market with localized competition.
- Primarily Electric Service (~$2.56B) with transmission and wholesale energy segments emphasizing regulated generation.
- Limited exposure to renewables; generation includes coal, nuclear, gas, oil, and some solar facilities.
Duke Energy Corporation vs Pinnacle West Capital Corporation Positioning
Duke Energy shows a diversified approach with multiple segments and geographic coverage, offering broader business drivers but facing complexity. Pinnacle West is more concentrated regionally and segment-wise, which may limit scale but simplifies operations.
Which has the best competitive advantage?
Both companies are shedding value with ROIC below WACC; however, Duke Energy’s improving ROIC trend indicates slightly better value creation potential compared to Pinnacle West’s declining profitability.
Stock Comparison
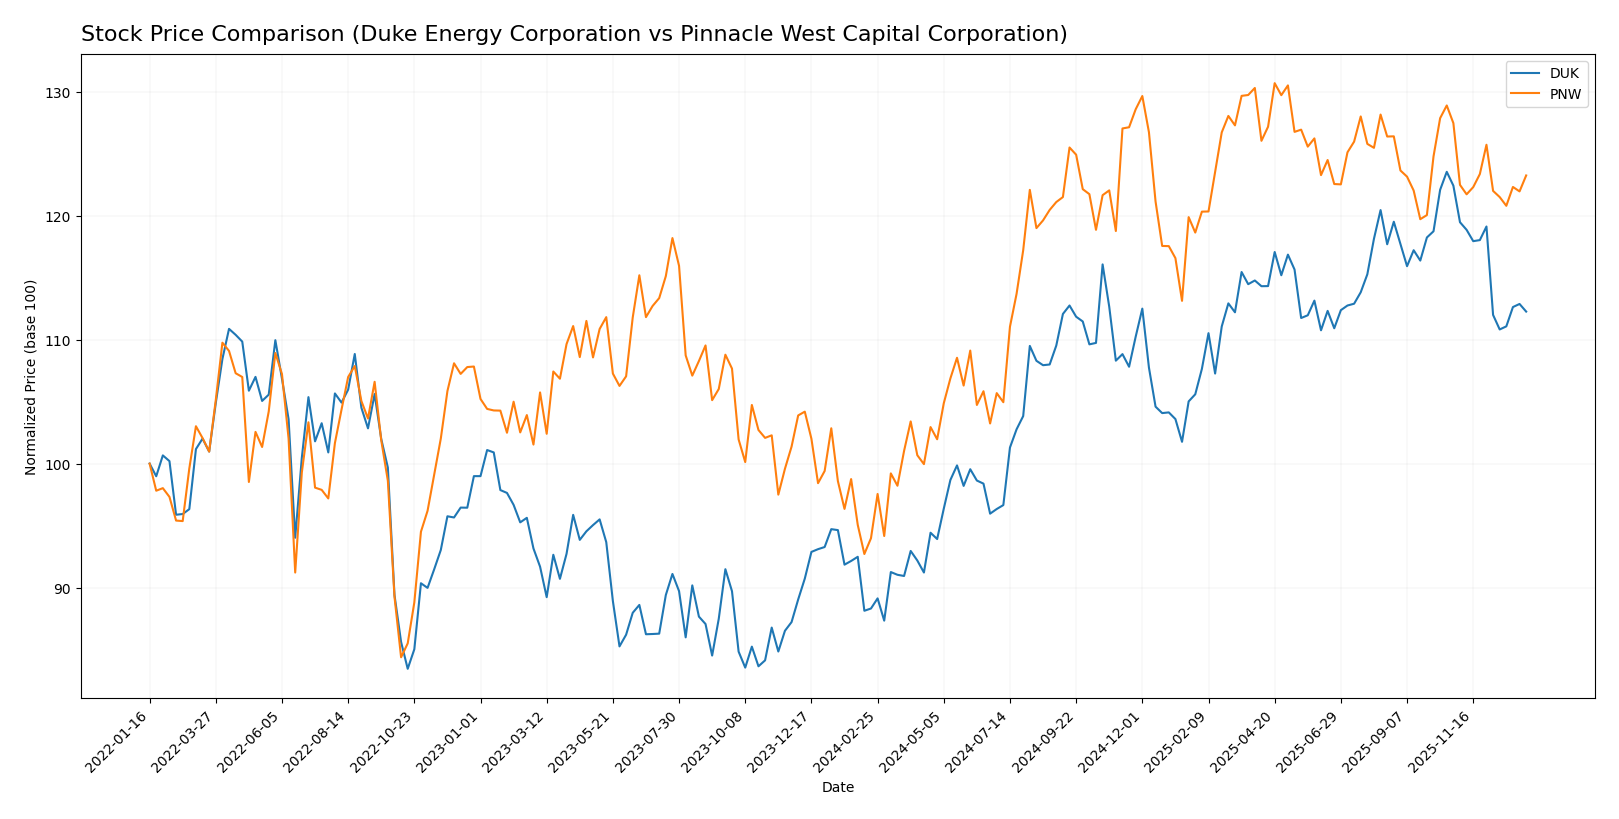
Over the past 12 months, Duke Energy Corporation (DUK) and Pinnacle West Capital Corporation (PNW) have both exhibited bullish trends with notable price appreciations, though recent quarters reveal a deceleration and slight downturn in trading dynamics.
Trend Analysis
Duke Energy Corporation’s stock posted a 27.12% increase over the past year, reflecting a bullish but decelerating trend with a high volatility indicated by a 9.13 standard deviation; recent months show a -8.3% decline.
Pinnacle West Capital Corporation’s stock rose 31.14% over the past year, also bullish with deceleration and lower volatility at 6.87 standard deviation; its recent price decreased by -3.31%.
Comparing both, Pinnacle West Capital delivered a higher overall market performance with a 31.14% gain versus Duke Energy’s 27.12%, despite both facing modest declines in the recent period.
Target Prices
Analysts present a clear consensus on target prices for Duke Energy Corporation and Pinnacle West Capital Corporation.
| Company | Target High | Target Low | Consensus |
|---|---|---|---|
| Duke Energy Corporation | 150 | 126 | 135.91 |
| Pinnacle West Capital Corporation | 115 | 85 | 96.33 |
The target consensus for Duke Energy at 135.91 suggests upside potential from the current price of 116.8, while Pinnacle West’s consensus of 96.33 also indicates expected growth above its current price of 89.07.
Analyst Opinions Comparison
This section compares analysts’ ratings and grades for Duke Energy Corporation and Pinnacle West Capital Corporation:
Rating Comparison
DUK Rating
- Rating: C+, classified as Very Favorable by analysts.
- Discounted Cash Flow Score: 1, indicating a Very Unfavorable valuation based on cash flows.
- ROE Score: 3, reflecting a Moderate efficiency in generating profit from shareholders’ equity.
- ROA Score: 3, showing Moderate effectiveness in asset utilization to generate earnings.
- Debt To Equity Score: 2, suggesting Moderate financial risk with balanced debt levels.
- Overall Score: 2, a Moderate summary assessment of financial standing.
PNW Rating
- Rating: C+, classified as Very Favorable by analysts.
- Discounted Cash Flow Score: 1, indicating a Very Unfavorable valuation based on cash flows.
- ROE Score: 3, reflecting a Moderate efficiency in generating profit from shareholders’ equity.
- ROA Score: 3, showing Moderate effectiveness in asset utilization to generate earnings.
- Debt To Equity Score: 1, indicating Very Unfavorable financial risk due to higher debt reliance.
- Overall Score: 2, a Moderate summary assessment of financial standing.
Which one is the best rated?
Both Duke Energy and Pinnacle West share the same overall rating of C+ and overall score of 2, with both considered Very Favorable in analyst classification. However, Duke Energy has a stronger Debt to Equity Score, indicating relatively lower financial risk compared to Pinnacle West.
Scores Comparison
Here is a comparison of the Altman Z-Score and Piotroski Score for Duke Energy Corporation and Pinnacle West Capital Corporation:
Duke Energy Corporation Scores
- Altman Z-Score: 0.71, in distress zone, high bankruptcy risk.
- Piotroski Score: 6, average financial strength.
Pinnacle West Capital Corporation Scores
- Altman Z-Score: 0.73, in distress zone, high bankruptcy risk.
- Piotroski Score: 4, average financial strength.
Which company has the best scores?
Both companies are in the distress zone for Altman Z-Score, indicating high bankruptcy risk. Duke Energy scores higher on Piotroski (6 vs. 4), suggesting relatively stronger financial health.
Grades Comparison
The following presents the latest grades and rating trends from reputable grading companies for Duke Energy Corporation and Pinnacle West Capital Corporation:
Duke Energy Corporation Grades
This table summarizes recent grades assigned by recognized financial institutions to Duke Energy Corporation:
| Grading Company | Action | New Grade | Date |
|---|---|---|---|
| UBS | Maintain | Neutral | 2025-12-17 |
| JP Morgan | Maintain | Neutral | 2025-12-11 |
| Mizuho | Maintain | Outperform | 2025-10-27 |
| Morgan Stanley | Maintain | Equal Weight | 2025-10-22 |
| Barclays | Maintain | Overweight | 2025-10-14 |
| UBS | Maintain | Neutral | 2025-10-10 |
| BMO Capital | Maintain | Outperform | 2025-10-10 |
| Scotiabank | Upgrade | Sector Outperform | 2025-10-03 |
| Jefferies | Downgrade | Hold | 2025-09-26 |
| Morgan Stanley | Maintain | Equal Weight | 2025-09-25 |
Duke Energy’s grades generally trend around Neutral to Outperform, with occasional upgrades and downgrades reflecting a stable but cautious outlook.
Pinnacle West Capital Corporation Grades
This table details recent ratings from respected grading companies for Pinnacle West Capital Corporation:
| Grading Company | Action | New Grade | Date |
|---|---|---|---|
| UBS | Maintain | Neutral | 2025-12-17 |
| Keybanc | Downgrade | Sector Weight | 2025-12-12 |
| Keybanc | Maintain | Overweight | 2025-10-15 |
| UBS | Maintain | Neutral | 2025-10-10 |
| Barclays | Maintain | Equal Weight | 2025-10-07 |
| Argus Research | Maintain | Buy | 2025-09-30 |
| Morgan Stanley | Maintain | Equal Weight | 2025-09-25 |
| UBS | Maintain | Neutral | 2025-09-12 |
| Mizuho | Downgrade | Neutral | 2025-09-09 |
| Barclays | Maintain | Equal Weight | 2025-08-13 |
Pinnacle West shows a more mixed grade profile, with several Neutral and Equal Weight ratings and some downgrades, indicating cautious sentiment among analysts.
Which company has the best grades?
Duke Energy Corporation holds a slightly stronger grading profile with multiple Outperform and Overweight ratings, while Pinnacle West Capital Corporation’s ratings cluster more around Neutral and Equal Weight with recent downgrades. This suggests Duke Energy may be viewed with a marginally more favorable outlook by analysts, which could influence investor perception of potential risk and reward.
Strengths and Weaknesses
Below is a comparative overview of key strengths and weaknesses for Duke Energy Corporation (DUK) and Pinnacle West Capital Corporation (PNW) based on the most recent financial and operational data.
| Criterion | Duke Energy Corporation (DUK) | Pinnacle West Capital Corporation (PNW) |
|---|---|---|
| Diversification | Strongly diversified with Electric Utilities ($26.8B) and Gas Utilities ($2.3B) segments | Less diversified, mainly Electric Service ($2.56B) with smaller transmission and wholesale energy segments |
| Profitability | Net margin 14.86% (favorable), ROIC 4.02% (unfavorable); improving ROIC trend | Net margin 11.88% (favorable), ROIC 3.48% (unfavorable); declining ROIC trend |
| Innovation | Moderate investment in Commercial Renewables (~$0.5B segment) | Limited visible innovation investments; more traditional electric utility focus |
| Global presence | Primarily U.S.-focused utilities, no significant international operations | U.S.-focused with no notable international presence |
| Market Share | Large market share in electric and gas utilities sectors | Smaller market share, focused regionally in electric services |
Key takeaways: Duke Energy benefits from strong segment diversification and improving profitability metrics, though it currently sheds value relative to cost of capital. Pinnacle West shows lower diversification and declining profitability, indicating higher investment risk. Both companies display slightly unfavorable financial ratios, urging cautious investment consideration.
Risk Analysis
Below is a summary table of key risk metrics for Duke Energy Corporation (DUK) and Pinnacle West Capital Corporation (PNW) in 2024, helping investors assess their respective risk profiles.
| Metric | Duke Energy Corporation (DUK) | Pinnacle West Capital Corporation (PNW) |
|---|---|---|
| Market Risk | Beta 0.49 (low volatility) | Beta 0.543 (low volatility) |
| Debt level | Debt-to-Equity 1.7 (unfavorable) | Debt-to-Equity 1.64 (unfavorable) |
| Regulatory Risk | High (regulated utility sector) | High (regulated utility sector) |
| Operational Risk | Moderate (diverse energy mix) | Moderate (regional focus in Arizona) |
| Environmental Risk | Transition to renewables ongoing | Reliance on fossil fuels still present |
| Geopolitical Risk | Low (US domestic operations) | Low (US domestic operations) |
The most impactful risks for both companies are their relatively high debt levels and exposure to regulatory changes in the utility sector. Both show low market volatility but face environmental transition challenges. Their Altman Z-scores below 1.8 indicate financial distress risk, demanding cautious risk management from investors.
Which Stock to Choose?
Duke Energy Corporation (DUK) shows favorable income statement metrics with strong growth in net income and EPS over 2020-2024. Its financial ratios reveal a mixed picture: solid net margin and dividend yield but unfavorable ROE, ROIC, and leverage ratios. The company carries moderate debt, and its rating is very favorable with a C+ score.
Pinnacle West Capital Corporation (PNW) also reports favorable income statement trends, including higher revenue growth and EPS growth than DUK, despite a declining net margin over the period. Its financial ratios are similarly mixed, with a slightly higher net margin yield and dividend yield but an unfavorable ROE and ROIC. PNW maintains moderate debt, holds a very favorable rating with a C+, yet shows a lower Piotroski score than DUK.
For investors, the choice might depend on risk tolerance and investment focus. Those prioritizing income growth and improving profitability might find DUK’s trend and dividend yield appealing, while investors focused on revenue growth and a slightly better price-to-book ratio could see potential in PNW. Both stocks exhibit slightly unfavorable financial ratios and face challenges with value creation, suggesting a need for cautious interpretation.
Disclaimer: Investment carries a risk of loss of initial capital. The past performance is not a reliable indicator of future results. Be sure to understand risks before making an investment decision.
Go Further
I encourage you to read the complete analyses of Duke Energy Corporation and Pinnacle West Capital Corporation to enhance your investment decisions: