Home > Comparison > Utilities > DUK vs PCG
The strategic rivalry between Duke Energy Corporation and Pacific Gas & Electric Co. shapes the landscape of the regulated electric utilities sector. Duke operates a diversified energy model spanning electric, gas, and renewables across multiple states, while Pacific Gas & Electric focuses on electricity and natural gas in California with innovative smart grid integration. This analysis weighs their differing operational scopes to identify which offers superior risk-adjusted returns for a balanced portfolio.
Table of contents
Companies Overview
Duke Energy and Pacific Gas & Electric Co. stand as pivotal players in the U.S. regulated electric market.
Duke Energy Corporation: Comprehensive Energy Giant
Duke Energy dominates as a regulated electric utility in the Southeast and Midwest, serving 8.2M customers. Its core revenue comes from electricity generation and distribution using coal, nuclear, natural gas, and renewables. In 2026, it sharpens its focus on expanding commercial renewables with 178 solar and 23 wind facilities, reinforcing its strategic shift towards cleaner energy sources.
Pacific Gas & Electric Co.: California’s Utility Powerhouse
Pacific Gas & Electric Co. commands the Northern and Central California energy market with a diversified electricity and natural gas distribution business. Its revenue engine blends nuclear, hydro, fossil fuels, and solar generation. The company advances innovation through a personal microgrid backup power transfer meter, integrating with smart grid tech to enhance reliability and customer autonomy in 2026.
Strategic Collision: Similarities & Divergences
Both companies operate as regulated utilities with mixed generation portfolios blending traditional and renewable sources. Duke Energy’s broad geographic footprint contrasts with Pacific Gas & Electric’s focused California market. The primary battleground lies in renewable integration and grid modernization. Duke offers scale and diversification, while Pacific Gas pioneers customer-centric smart grid solutions, presenting distinct risk and growth profiles for investors.
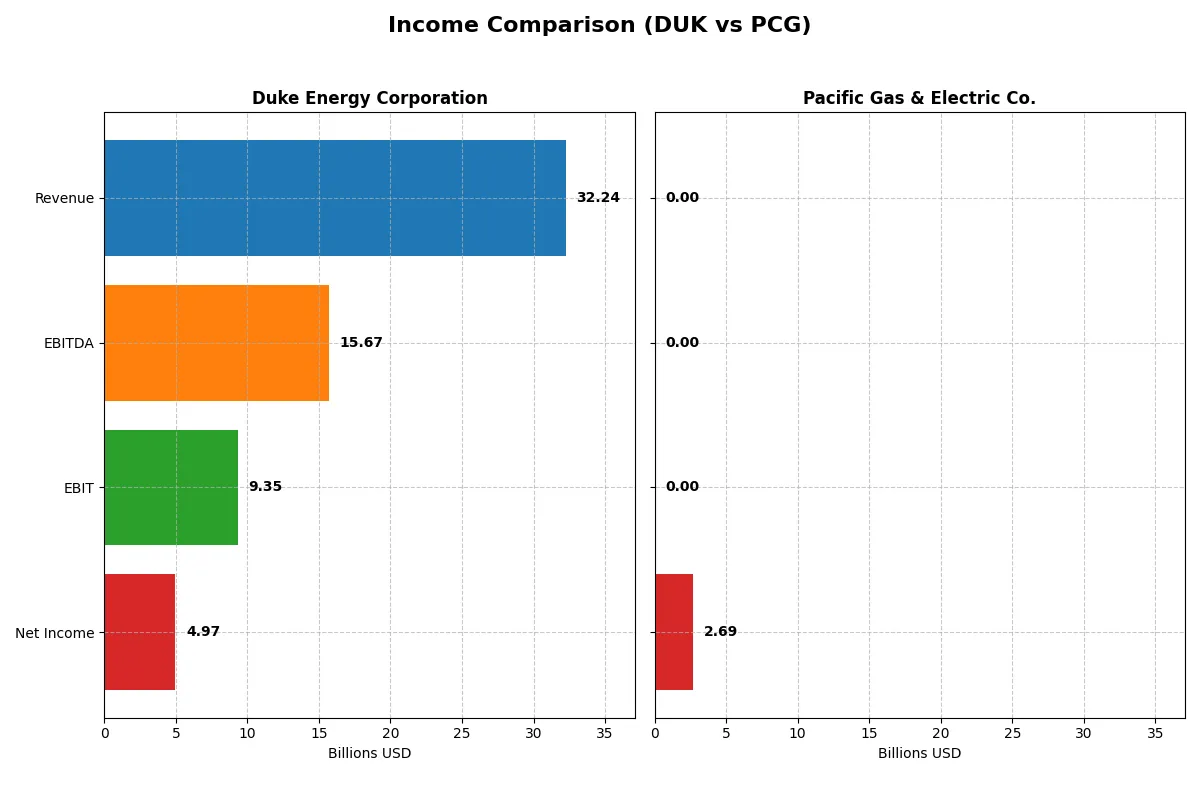
Income Statement Comparison
This data dissects the core profitability and scalability of both corporate engines to reveal who dominates the bottom line:
| Metric | Duke Energy Corporation (DUK) | Pacific Gas & Electric Co. (PCG) |
|---|---|---|
| Revenue | 32.2B | 0 |
| Cost of Revenue | 22.1B | 0 |
| Operating Expenses | 1.6B | -207M |
| Gross Profit | 10.2B | 0 |
| EBITDA | 15.7B | 0 |
| EBIT | 9.3B | 0 |
| Interest Expense | 3.6B | -315M |
| Net Income | 4.97B | 2.69B |
| EPS | 6.31 | 1.18 |
| Fiscal Year | 2025 | 2025 |
Income Statement Analysis: The Bottom-Line Duel
This income statement comparison reveals which company operates with superior efficiency and profit sustainability through their core business results.
Duke Energy Corporation Analysis
Duke Energy’s revenue rose steadily to 32.2B in 2025, with net income climbing to 4.97B, reflecting solid growth over five years. Its gross margin remains favorable at 31.6%, while the net margin holds strong at 15.4%. Despite a slight dip in gross profit growth last year, Duke’s operating efficiency and EPS growth signal consistent momentum in profitability.
Pacific Gas & Electric Co. Analysis
Pacific Gas & Electric faced a dramatic revenue collapse to zero in 2025, following 24.4B in 2024, severely impacting gross and EBIT margins, both at zero last year. However, net income surged to 2.69B due to non-operating factors, lifting EPS modestly. This volatile profile shows a struggling core business, undermining operating income but buoyed by one-off financial gains.
Operating Stability vs. Financial Volatility
Duke Energy demonstrates robust operational profitability and margin stability, underpinned by steady revenue and net income growth. In contrast, Pacific Gas & Electric’s core operations collapsed in 2025, masking underlying weakness despite net income spikes. For investors prioritizing durable earnings and clear operating leverage, Duke’s consistent income statement profile offers a more reliable investment foundation.
Financial Ratios Comparison
These vital ratios act as a diagnostic tool to expose the underlying fiscal health, valuation premiums, and capital efficiency of the companies compared below:
| Ratios | Duke Energy Corporation (DUK) | Pacific Gas & Electric Co. (PCG) |
|---|---|---|
| ROE | 9.6% | 8.3% |
| ROIC | 4.1% | 0% |
| P/E | 18.3 | 13.1 |
| P/B | 1.76 | 1.08 |
| Current Ratio | 0.55 | 0.03 |
| Quick Ratio | 0.33 | 0.03 |
| D/E (Debt-to-Equity) | 1.75 | 0.27 |
| Debt-to-Assets | 46.4% | 18.8% |
| Interest Coverage | 2.36 | 0 |
| Asset Turnover | 0.16 | 0 |
| Fixed Asset Turnover | 0.25 | 0 |
| Payout Ratio | 66.0% | 8.2% |
| Dividend Yield | 3.6% | 0.62% |
| Fiscal Year | 2025 | 2025 |
Efficiency & Valuation Duel: The Vital Signs
Financial ratios serve as a company’s DNA, unveiling hidden risks and operational excellence beneath the surface of headline figures.
Duke Energy Corporation
Duke Energy posts a solid 15.4% net margin but a modest 9.6% ROE, signaling moderate profitability. Its P/E of 18.3 and P/B of 1.76 mark a fairly valued stock. The company sustains shareholder returns with a 3.6% dividend yield, balancing income with steady capital deployment amid operational challenges.
Pacific Gas & Electric Co.
Pacific Gas & Electric shows weaker profitability with an 8.3% ROE and a 0% net margin, reflecting operational strain. Its valuation is attractive, with a P/E of 13.1 and P/B of 1.08, suggesting undervaluation. However, a low 0.62% dividend yield indicates limited direct returns, amid a conservative capital structure and riskier operational profile.
Valuation Discipline vs. Profitability Resilience
Duke Energy offers higher profitability and consistent dividends but trades at a premium. Pacific Gas & Electric provides cheaper valuation metrics but struggles with profitability and shareholder payouts. Investors prioritizing stable income and operational steadiness may lean toward Duke, while those seeking value with higher risk might consider Pacific Gas & Electric.
Which one offers the Superior Shareholder Reward?
I compare Duke Energy (DUK) and Pacific Gas & Electric (PCG) on dividends, payout ratios, and buybacks. DUK offers a robust 3.6% dividend yield with a 66% payout, backed by positive free cash flow of $15.9/share in 2025, supporting sustainable distributions. PCG’s yield is negligible at 0.6%, with minimal payouts and negative free cash flow (-$1.4/share), reflecting reinvestment or distress. DUK’s buyback activity is implied strong by stable capital allocation and cash flow; PCG lacks meaningful buybacks due to weak coverage ratios. Given DUK’s superior yield, payout sustainability, and capital return intensity, I see it as the better total return candidate in 2026.
Comparative Score Analysis: The Strategic Profile
The radar chart reveals the fundamental DNA and trade-offs of Duke Energy Corporation and Pacific Gas & Electric Co.:
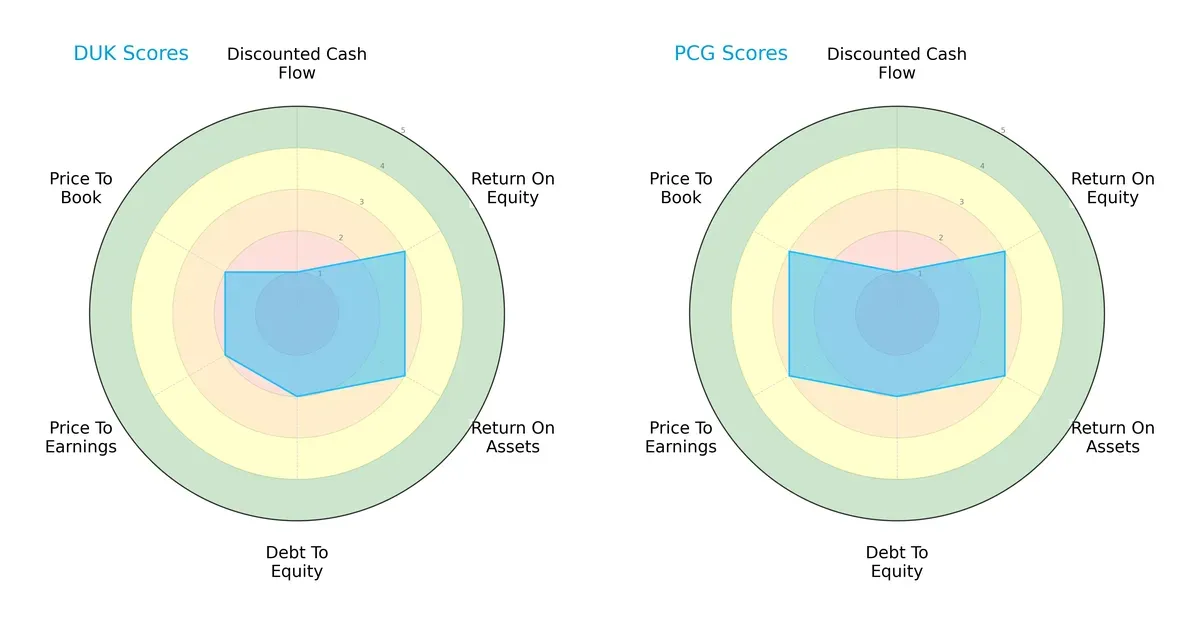
Duke Energy shows moderate efficiency in ROE and ROA but lags in valuation and debt management. Pacific Gas & Electric outperforms in valuation metrics and overall score, reflecting a more balanced financial profile. Duke relies more on operational returns, while Pacific Gas & Electric leverages valuation strength for its edge.
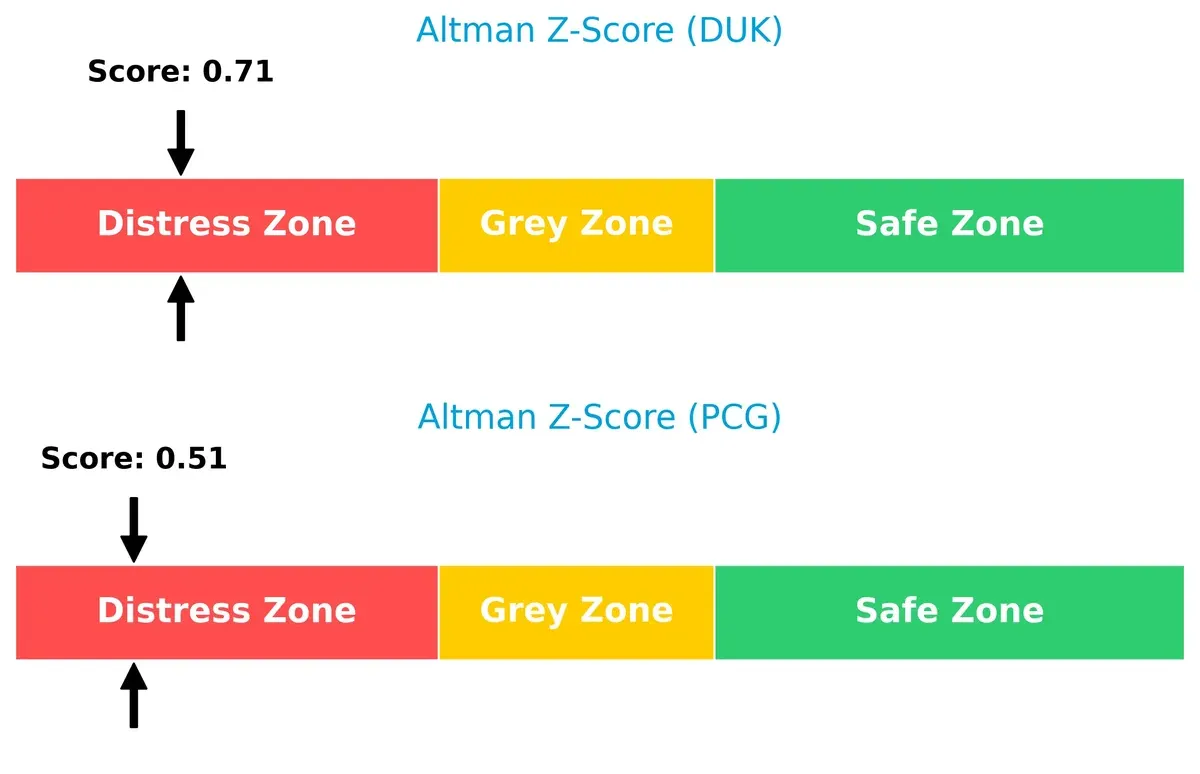
Bankruptcy Risk: Solvency Showdown
Both Duke Energy and Pacific Gas & Electric score in the distress zone, indicating elevated bankruptcy risk amid current economic pressures:
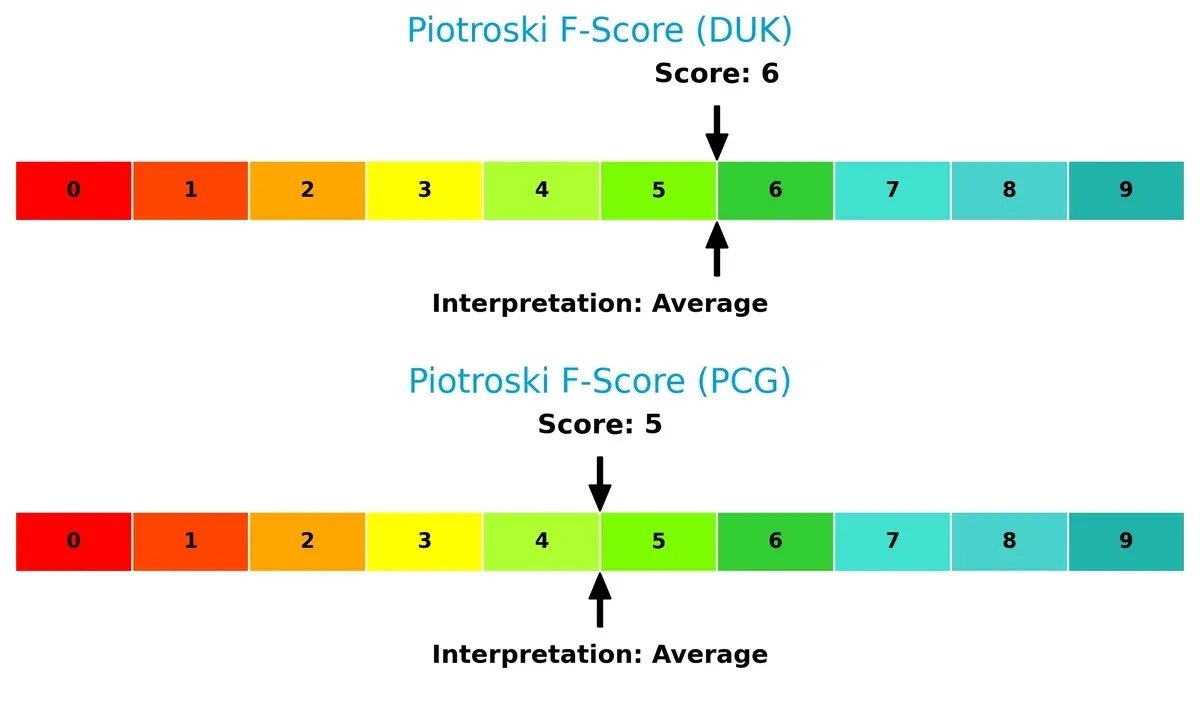
Financial Health: Quality of Operations
Duke Energy and Pacific Gas & Electric both register average Piotroski F-Scores, signaling moderate financial health without clear red flags:
How are the two companies positioned?
This section dissects Duke Energy and PG&E’s operational DNA by comparing revenue distribution and internal dynamics—strengths and weaknesses. The goal is to confront their economic moats and identify which model offers the most resilient, sustainable competitive advantage today.
Revenue Segmentation: The Strategic Mix
This visual comparison dissects how Duke Energy Corporation and Pacific Gas & Electric Co. diversify their income streams and where their primary sector bets lie:
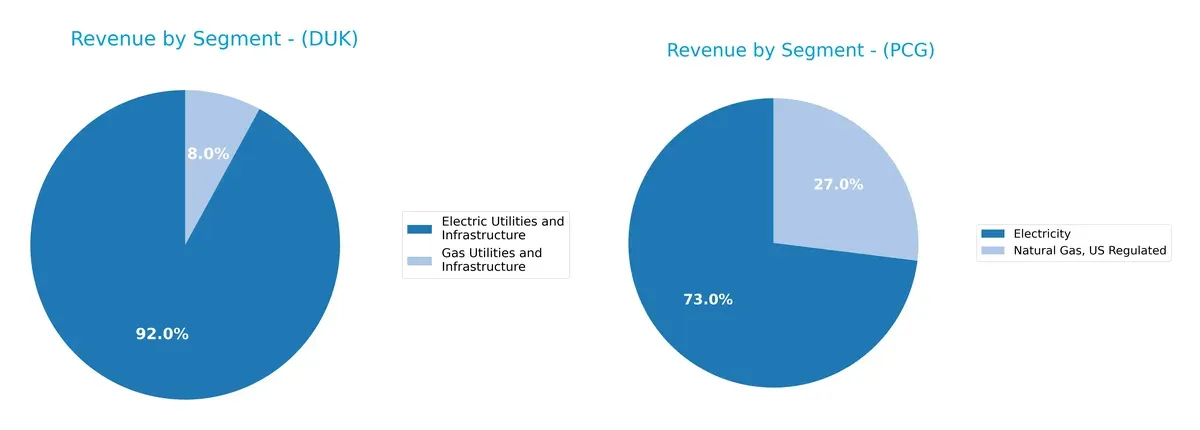
Duke Energy dwarfs Pacific Gas with $26.8B in Electric Utilities, anchoring its revenue heavily in this segment. PCG’s $18.6B electricity revenue is significant but balanced by $6.6B from Natural Gas. Duke’s reliance on Electric Utilities signals strong infrastructure dominance but raises concentration risk. PCG’s more diversified split between electricity and gas reduces risk, positioning it for stability amid sector shifts.
Strengths and Weaknesses Comparison
This table compares the strengths and weaknesses of Duke Energy Corporation and Pacific Gas & Electric Co.:
Duke Energy Corporation Strengths
- Strong net margin at 15.41%
- Favorable WACC at 4.77%
- Higher dividend yield at 3.6%
- Larger electric and gas utilities revenue base
- Neutral valuation multiples (PE 18.33, PB 1.76)
Pacific Gas & Electric Co. Strengths
- Favorable WACC at 4.93%
- Lower debt-to-equity ratio at 0.27
- Favorable debt-to-assets at 18.84%
- Attractive valuation multiples (PE 13.13, PB 1.08)
Duke Energy Corporation Weaknesses
- Unfavorable ROE at 9.58% and ROIC at 4.13% below WACC
- Poor liquidity ratios (current 0.55, quick 0.33)
- High debt-to-equity at 1.75
- Low asset turnover (0.16) and fixed asset turnover (0.25)
- Slightly unfavorable global ratios overall
Pacific Gas & Electric Co. Weaknesses
- Zero net margin and ROIC
- Negative interest coverage
- Extremely poor liquidity (current and quick ratio 0.03)
- Zero asset and fixed asset turnover
- Low dividend yield at 0.62%
- Unfavorable global ratios overall
Duke Energy has stronger profitability and a more diversified revenue base but faces challenges in efficiency and liquidity. Pacific Gas & Electric shows better leverage metrics and valuation but struggles with profitability and operational efficiency, indicating significant risks in financial health and earnings generation.
The Moat Duel: Analyzing Competitive Defensibility
A structural moat is the only defense that preserves long-term profits against relentless competitive pressures in utility markets:
Duke Energy Corporation: Infrastructure Scale and Regulatory Moat
Duke’s moat stems from vast regulated utility infrastructure and stable cash flows secured by regional monopolies. Its slightly unfavorable ROIC vs. WACC signals value erosion, yet growing profitability and expansion in renewables could deepen its moat in 2026.
Pacific Gas & Electric Co.: Innovation Amidst Regulatory Challenges
PG&E relies on regulatory protection and emerging smart grid technology for advantage, contrasting Duke’s scale focus. Despite negative ROIC spread, its improving profitability trend and microgrid innovations offer potential but face significant operational risks.
Verdict: Infrastructure Dominance vs. Technological Adaptation
Duke holds a wider moat with its entrenched utility network and diversified generation assets. PG&E’s narrower moat depends on innovation under regulatory strain. Duke stands better poised to defend its market share long-term.
Which stock offers better returns?
The past year saw Duke Energy’s stock surge sharply while Pacific Gas & Electric posted moderate gains, both exhibiting accelerating bullish trends with increasing buyer dominance.
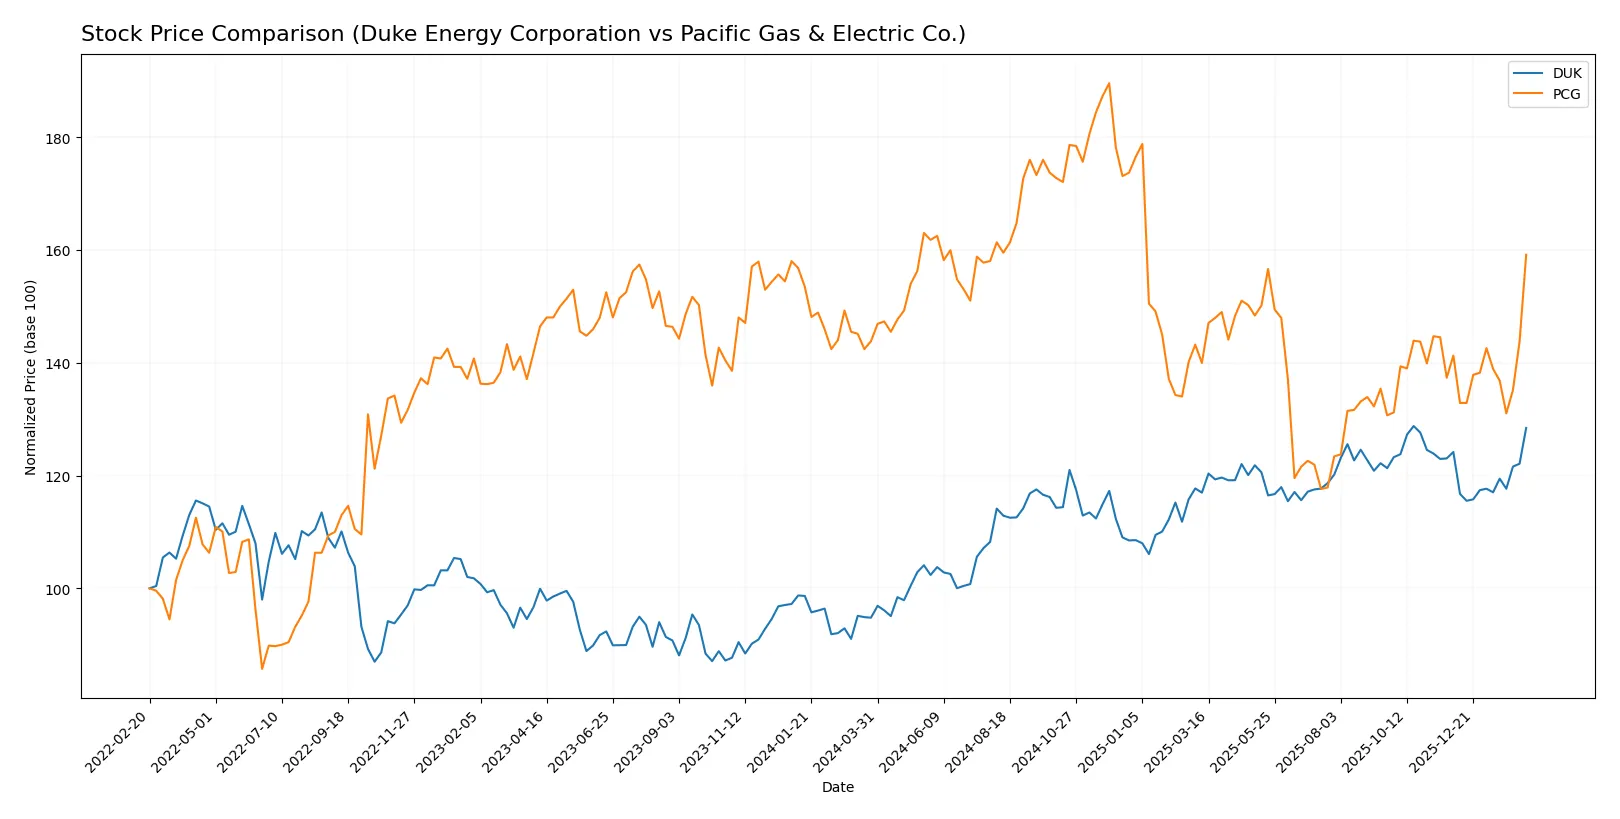
Trend Comparison
Duke Energy’s stock rose 35.5% over the past year, showing a strong bullish trend with accelerating momentum and a high volatility of 8.1%. The price ranged between 94.61 and 128.53.
Pacific Gas & Electric’s stock gained 10.66% during the same period, also bullish with acceleration but lower volatility at 1.96%. The price moved from 13.42 to a peak of 21.63.
Duke Energy outperformed Pacific Gas & Electric, delivering significantly higher returns and stronger trend acceleration over the last 12 months.
Target Prices
Analysts present a moderate upside potential for Duke Energy Corporation and cautious optimism for Pacific Gas & Electric Co.
| Company | Target Low | Target High | Consensus |
|---|---|---|---|
| Duke Energy Corporation | 115 | 143 | 132.64 |
| Pacific Gas & Electric Co. | 18 | 25 | 21.43 |
Duke Energy’s target consensus exceeds its current price of 128.2, signaling modest growth expectations. Pacific Gas & Electric’s consensus price sits slightly above its 18.16 current price, suggesting limited near-term appreciation.

Don’t Let Luck Decide Your Entry Point
Optimize your entry points with our advanced ProRealTime indicators. You’ll get efficient buy signals with precise price targets for maximum performance. Start outperforming now!
How do institutions grade them?
Duke Energy Corporation Grades
The following table summarizes recent grades assigned by reputable grading companies to Duke Energy Corporation:
| Grading Company | Action | New Grade | Date |
|---|---|---|---|
| Wells Fargo | Maintain | Equal Weight | 2026-01-20 |
| Barclays | Maintain | Overweight | 2026-01-15 |
| UBS | Maintain | Neutral | 2025-12-17 |
| JP Morgan | Maintain | Neutral | 2025-12-11 |
| Mizuho | Maintain | Outperform | 2025-10-27 |
| Morgan Stanley | Maintain | Equal Weight | 2025-10-22 |
| Barclays | Maintain | Overweight | 2025-10-14 |
| BMO Capital | Maintain | Outperform | 2025-10-10 |
| UBS | Maintain | Neutral | 2025-10-10 |
| Scotiabank | Upgrade | Sector Outperform | 2025-10-03 |
Pacific Gas & Electric Co. Grades
This table displays recent analyst grades for Pacific Gas & Electric Co. from established grading firms:
| Grading Company | Action | New Grade | Date |
|---|---|---|---|
| Jefferies | Maintain | Buy | 2026-01-28 |
| Wells Fargo | Maintain | Overweight | 2026-01-20 |
| JP Morgan | Maintain | Overweight | 2025-12-12 |
| UBS | Maintain | Neutral | 2025-10-24 |
| Jefferies | Maintain | Buy | 2025-10-22 |
| BMO Capital | Maintain | Outperform | 2025-10-14 |
| Jefferies | Maintain | Buy | 2025-10-03 |
| Barclays | Maintain | Overweight | 2025-10-01 |
| Morgan Stanley | Maintain | Equal Weight | 2025-09-25 |
| Morgan Stanley | Upgrade | Equal Weight | 2025-09-18 |
Which company has the best grades?
Pacific Gas & Electric Co. holds generally higher analyst grades with multiple “Buy” and “Overweight” ratings, indicating stronger institutional confidence. Duke Energy shows a mix of “Neutral,” “Equal Weight,” and some “Outperform” grades, suggesting more cautious outlooks. This divergence may affect investor sentiment and portfolio positioning differently.
Risks specific to each company
The following categories identify critical pressure points and systemic threats facing Duke Energy Corporation and Pacific Gas & Electric Co. in the 2026 market environment:
1. Market & Competition
Duke Energy Corporation
- Faces intense competition in regulated electric markets with diversified generation assets across six states.
Pacific Gas & Electric Co.
- Operates in a highly regulated California market with legacy challenges impacting customer trust and competition.
2. Capital Structure & Debt
Duke Energy Corporation
- High debt-to-equity ratio of 1.75 signals elevated leverage risk; interest coverage is moderate at 2.57x.
Pacific Gas & Electric Co.
- Low debt-to-equity of 0.27 indicates conservative leverage, but negative interest coverage signals cash flow stress.
3. Stock Volatility
Duke Energy Corporation
- Beta of 0.51 implies moderate stock volatility, reflecting stable investor sentiment.
Pacific Gas & Electric Co.
- Lower beta of 0.374 shows less price sensitivity but high volume and low price range suggest potential liquidity risk.
4. Regulatory & Legal
Duke Energy Corporation
- Regulatory environment is stable but subject to policy shifts on coal and nuclear generation.
Pacific Gas & Electric Co.
- Ongoing legal liabilities and regulatory scrutiny persist, especially linked to wildfire risks in California.
5. Supply Chain & Operations
Duke Energy Corporation
- Diverse fuel mix and infrastructure across regions reduce operational vulnerability.
Pacific Gas & Electric Co.
- Concentrated California operations increase exposure to supply chain disruptions and operational risks.
6. ESG & Climate Transition
Duke Energy Corporation
- Expanding renewables portfolio with 3,554 MW capacity; transition risk moderated by diversification.
Pacific Gas & Electric Co.
- Faces significant ESG challenges given historical environmental impact and urgent climate transition pressures.
7. Geopolitical Exposure
Duke Energy Corporation
- Operations confined to stable U.S. Southeast and Midwest regions with minimal geopolitical risk.
Pacific Gas & Electric Co.
- Limited to California, mitigating international risks but exposed to state-level political and regulatory shifts.
Which company shows a better risk-adjusted profile?
Duke Energy faces a critical capital structure risk from high leverage, while Pacific Gas & Electric contends with severe regulatory and cash flow distress. Duke’s broader geographic footprint and stronger dividend yield offer a comparatively better risk-adjusted profile despite leverage concerns. PCG’s ongoing legal and financial instability heightens its risk profile. The sharp contrast in interest coverage and debt metrics highlights Duke’s relative financial resilience amid sector headwinds.
Final Verdict: Which stock to choose?
Duke Energy Corporation’s superpower lies in its ability to generate consistent cash flow with improving profitability despite a challenging capital structure. Its main point of vigilance is the high leverage and weak liquidity, which could pressure financial flexibility. Duke fits an income-focused portfolio seeking steady dividends with moderate growth.
Pacific Gas & Electric Co. benefits from a strategic moat rooted in its relatively low debt burden and attractive valuation metrics. However, its income statement volatility and liquidity concerns make it riskier than Duke. PCG suits a value-oriented investor willing to tolerate operational challenges for potential turnaround gains.
If you prioritize stable cash generation and dividend income, Duke outshines due to stronger income quality and a more favorable risk profile. However, if you seek value with a margin for recovery and can accept financial uncertainty, Pacific Gas & Electric offers better entry valuation and a potential rebound scenario. Both require close monitoring of balance sheet risks.
Disclaimer: Investment carries a risk of loss of initial capital. The past performance is not a reliable indicator of future results. Be sure to understand risks before making an investment decision.
Go Further
I encourage you to read the complete analyses of Duke Energy Corporation and Pacific Gas & Electric Co. to enhance your investment decisions: