In the evolving energy sector, Duke Energy Corporation and Oklo Inc. stand out as key players with distinct approaches. Duke Energy, a century-old giant, combines traditional and renewable energy sources across a broad service area. Oklo Inc., a newer innovator, focuses on advanced fission technology to redefine nuclear power. This comparison highlights their strategies and market potential, helping you identify which company offers the most compelling investment opportunity.
Table of contents
Companies Overview
I will begin the comparison between Duke Energy Corporation and Oklo Inc. by providing an overview of these two companies and their main differences.
Duke Energy Corporation Overview
Duke Energy Corporation operates as a major energy company in the United States, serving approximately 8.2M customers across six states in the Southeast and Midwest. Its business segments include Electric Utilities and Infrastructure, Gas Utilities and Infrastructure, and Commercial Renewables, with a generation capacity of about 50,259 MW. Founded in 1904 and headquartered in Charlotte, NC, Duke focuses on a diversified energy mix including coal, natural gas, nuclear, hydroelectric, and renewables.
Oklo Inc. Overview
Oklo Inc. is a newer player in the U.S. utilities sector, specializing in designing and developing fission power plants for reliable, commercial-scale energy. Founded in 2013 and based in Santa Clara, CA, it also offers used nuclear fuel recycling services. Oklo operates with a much smaller workforce of 120 employees and has a market cap of approximately 16.5B USD, reflecting its focused niche in nuclear technology.
Key similarities and differences
Both Duke and Oklo operate in the regulated electric industry within the U.S. utilities sector, but their business models differ significantly. Duke is a large, diversified utility with multiple energy sources and broad geographic coverage, while Oklo concentrates on advanced nuclear fission technology and fuel recycling. Duke’s scale and customer base are substantially larger, whereas Oklo is a specialized, growth-oriented firm with a technological focus on nuclear power.
Income Statement Comparison
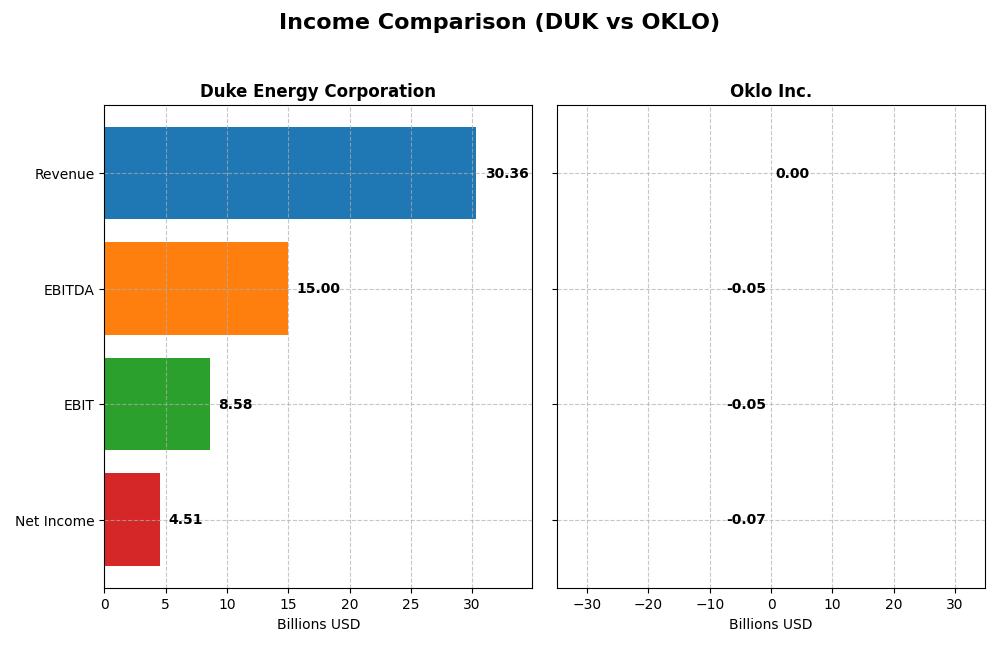
The table below presents a side-by-side comparison of key income statement metrics for Duke Energy Corporation and Oklo Inc. for the fiscal year 2024.
| Metric | Duke Energy Corporation | Oklo Inc. |
|---|---|---|
| Market Cap | 90.8B | 16.5B |
| Revenue | 30.4B | 0 |
| EBITDA | 15.0B | -52.5M |
| EBIT | 8.6B | -52.8M |
| Net Income | 4.5B | -73.6M |
| EPS | 5.71 | -0.74 |
| Fiscal Year | 2024 | 2024 |
Income Statement Interpretations
Duke Energy Corporation
Duke Energy’s revenue increased steadily from $23.4B in 2020 to $30.4B in 2024, with net income rising substantially from $1.3B to $4.5B over the same period. Gross and EBIT margins remained strong, around 50% and 28% respectively, indicating efficient cost management. In 2024, growth slowed slightly with a 4.5% revenue increase, but profitability and EPS improved moderately.
Oklo Inc.
Oklo recorded no revenue from 2021 through 2024, reflecting its development-stage status. Net losses widened significantly from -$5.2M in 2021 to -$73.6M in 2024, indicating rising expenses without offsetting income. Margins remained unfavorable, with zero gross and EBIT margins reflecting the lack of sales. The 2024 net loss nearly doubled compared to 2023, showing increased operational costs.
Which one has the stronger fundamentals?
Duke Energy exhibits stronger fundamentals with consistent revenue growth, positive margins, and improving net income and EPS over the past five years. Oklo’s income statement shows persistent losses and no revenue, characteristic of an early-stage company still investing heavily in development. Duke’s favorable margins and earnings growth contrast sharply with Oklo’s unfavorable income trends.
Financial Ratios Comparison
The table below presents key financial ratios for Duke Energy Corporation (DUK) and Oklo Inc. (OKLO) based on their most recent fiscal year data ending December 31, 2024.
| Ratios | Duke Energy Corporation (DUK) | Oklo Inc. (OKLO) |
|---|---|---|
| ROE | 8.99% | -29.35% |
| ROIC | 4.02% | -19.23% |
| P/E | 18.44 | -28.52 |
| P/B | 1.66 | 8.37 |
| Current Ratio | 0.67 | 43.47 |
| Quick Ratio | 0.44 | 43.47 |
| D/E (Debt-to-Equity) | 1.70 | 0.005 |
| Debt-to-Assets | 45.7% | 0.46% |
| Interest Coverage | 2.34 | 0 |
| Asset Turnover | 0.16 | 0 |
| Fixed Asset Turnover | 0.24 | 0 |
| Payout Ratio | 71.2% | 0 |
| Dividend Yield | 3.86% | 0 |
Interpretation of the Ratios
Duke Energy Corporation
Duke Energy shows a mixed ratio profile with favorable net margin (14.86%) and dividend yield (3.86%), but faces challenges in return on equity (9.0%) and invested capital (4.02%) alongside low liquidity ratios and high leverage (debt-to-equity 1.7). Dividend payments are consistent, supported by a reasonable payout, though some operational efficiency concerns exist.
Oklo Inc.
Oklo displays predominantly weak ratios including negative returns on equity (-29.35%) and invested capital (-19.23%), zero net margin, and no dividend yield, reflecting its early-stage growth focus. The company maintains a strong balance sheet with minimal debt and very high current and quick ratios, likely prioritizing reinvestment and R&D over shareholder payouts.
Which one has the best ratios?
Duke Energy has a slightly unfavorable overall ratio profile with more unfavorable than favorable metrics, but it offers steady dividend returns. Oklo’s ratios are generally unfavorable, reflecting its developmental stage and lack of profitability. Between the two, Duke Energy demonstrates stronger profitability and shareholder returns, while Oklo shows financial stability but no income generation.
Strategic Positioning
This section compares the strategic positioning of Duke Energy Corporation and Oklo Inc., covering Market position, Key segments, and Exposure to technological disruption:
Duke Energy Corporation
- Large market cap (~$90.8B), operates in regulated electric utility with stable competitive pressure.
- Diverse segments: Electric Utilities, Gas Utilities, Commercial Renewables, generating bulk revenue.
- Moderate exposure via commercial renewables and nuclear fuel; legacy infrastructure limits rapid tech shifts.
Oklo Inc.
- Smaller market cap (~$16.5B), emerging player in fission power plants, facing high competition risk.
- Focused on fission power plant design and nuclear fuel recycling, highly specialized in nuclear technology.
- High exposure to disruption, innovating in nuclear technology and used fuel recycling for energy reliability.
Duke Energy Corporation vs Oklo Inc. Positioning
Duke Energy pursues a diversified utility business with established infrastructure and multiple revenue streams, balancing traditional and renewable energy. Oklo concentrates on nuclear innovation with a narrow focus, which may increase risk and reward volatility.
Which has the best competitive advantage?
Duke Energy shows a slightly unfavorable moat with value destruction but improving profitability, while Oklo has a very unfavorable moat with declining profitability, indicating Duke’s positioning is currently more stable in competitive advantage terms.
Stock Comparison
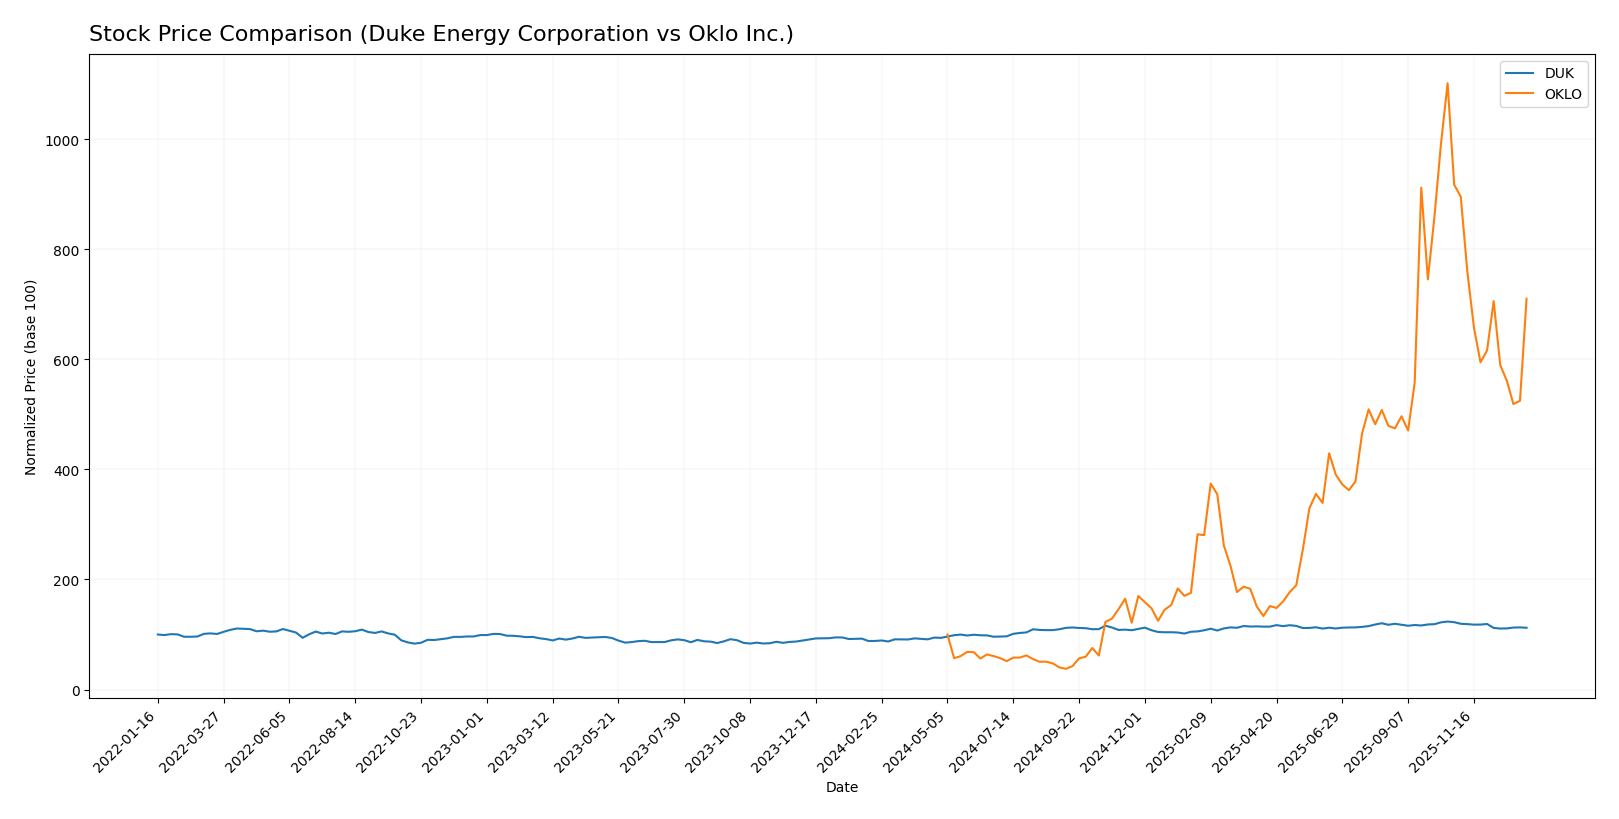
The stock price chart reveals significant bullish momentum for both Duke Energy Corporation and Oklo Inc. over the past 12 months, with notable deceleration in their upward trends and a recent period marked by seller dominance.
Trend Analysis
Duke Energy Corporation’s stock rose 27.12% over the past year, indicating a bullish trend with decelerating acceleration. The price ranged from 90.86 to 128.53, showing moderate volatility with a 9.13 std deviation. Recently, the price declined 8.3% with increased seller dominance.
Oklo Inc. exhibited a strong bullish trend with a 610.11% increase over the past year, though acceleration slowed. Its price fluctuated between 5.59 and 163.39, with high volatility (39.02 std deviation). Recently, Oklo’s stock dropped 22.59%, reflecting intensified selling pressure.
Compared to Duke Energy, Oklo delivered the highest market performance over the analyzed period, despite both stocks showing recent downward corrections and seller dominance.
Target Prices
The current analyst consensus suggests promising upside potential for both Duke Energy Corporation and Oklo Inc.
| Company | Target High | Target Low | Consensus |
|---|---|---|---|
| Duke Energy Corporation | 150 | 126 | 135.91 |
| Oklo Inc. | 150 | 95 | 125.67 |
Analysts expect Duke Energy’s stock to rise from its current price of $116.8 to around $136 on average, indicating moderate upside. Oklo’s consensus target of $125.67 suggests a strong potential gain from its current $105.31 price.
Analyst Opinions Comparison
This section compares analysts’ ratings and grades for Duke Energy Corporation and Oklo Inc.:
Rating Comparison
DUK Rating
- Rating: C+ with a very favorable status overall.
- Discounted Cash Flow Score: 1, very unfavorable, indicating potential overvaluation concerns.
- ROE Score: 3, moderate, reflecting average efficiency in generating profit from equity.
- ROA Score: 3, moderate, showing average asset utilization efficiency.
- Debt To Equity Score: 2, moderate, suggesting moderate financial risk.
- Overall Score: 2, moderate, summarizing a balanced but cautious financial standing.
OKLO Rating
- Rating: C+ with a very favorable status overall.
- Discounted Cash Flow Score: 3, moderate, showing better valuation based on future cash flows.
- ROE Score: 1, very unfavorable, indicating poor profit generation from shareholders’ equity.
- ROA Score: 1, very unfavorable, indicating weak asset utilization to generate earnings.
- Debt To Equity Score: 5, very favorable, indicating a strong balance sheet with low financial risk.
- Overall Score: 2, moderate, indicating a similar balanced but cautious financial standing.
Which one is the best rated?
Both Duke Energy and Oklo share the same overall rating of C+ and moderate overall scores. However, Oklo outperforms Duke Energy in discounted cash flow and debt-to-equity scores, while Duke Energy shows stronger returns on equity and assets.
Scores Comparison
Here is a comparison of the Altman Z-Score and Piotroski Score for Duke Energy Corporation and Oklo Inc.:
Duke Energy Corporation Scores
- Altman Z-Score: 0.71, indicating financial distress and high bankruptcy risk.
- Piotroski Score: 6, representing average financial strength.
Oklo Inc. Scores
- Altman Z-Score: 339.43, indicating a very safe financial position.
- Piotroski Score: 2, representing very weak financial strength.
Which company has the best scores?
Oklo Inc. shows a substantially stronger Altman Z-Score, placing it in the safe zone, while Duke Energy is in distress. However, Duke Energy has a higher Piotroski Score, indicating better financial health compared to Oklo.
Grades Comparison
Here is the grades comparison for Duke Energy Corporation and Oklo Inc.:
Duke Energy Corporation Grades
The following table summarizes the recent grades issued by recognized grading companies for Duke Energy Corporation:
| Grading Company | Action | New Grade | Date |
|---|---|---|---|
| UBS | Maintain | Neutral | 2025-12-17 |
| JP Morgan | Maintain | Neutral | 2025-12-11 |
| Mizuho | Maintain | Outperform | 2025-10-27 |
| Morgan Stanley | Maintain | Equal Weight | 2025-10-22 |
| Barclays | Maintain | Overweight | 2025-10-14 |
| UBS | Maintain | Neutral | 2025-10-10 |
| BMO Capital | Maintain | Outperform | 2025-10-10 |
| Scotiabank | Upgrade | Sector Outperform | 2025-10-03 |
| Jefferies | Downgrade | Hold | 2025-09-26 |
| Morgan Stanley | Maintain | Equal Weight | 2025-09-25 |
Duke Energy’s grades show a stable trend with mostly neutral to outperform ratings and very few downgrades, reflecting a cautious but generally positive outlook.
Oklo Inc. Grades
The following table shows the current grades issued by recognized grading companies for Oklo Inc.:
| Grading Company | Action | New Grade | Date |
|---|---|---|---|
| Seaport Global | Upgrade | Buy | 2025-12-08 |
| UBS | Maintain | Neutral | 2025-12-03 |
| B of A Securities | Maintain | Neutral | 2025-11-12 |
| B. Riley Securities | Maintain | Buy | 2025-11-12 |
| Wedbush | Maintain | Outperform | 2025-11-12 |
| B of A Securities | Downgrade | Neutral | 2025-09-30 |
| Seaport Global | Downgrade | Neutral | 2025-09-23 |
| Wedbush | Maintain | Outperform | 2025-09-22 |
| Wedbush | Maintain | Outperform | 2025-08-14 |
| Wedbush | Maintain | Outperform | 2025-08-12 |
Oklo Inc. has a generally positive grading trend with multiple outperform and buy ratings, though some recent downgrades to neutral indicate some volatility in analyst sentiment.
Which company has the best grades?
Oklo Inc. has received more buy and outperform ratings compared to Duke Energy’s predominantly neutral and hold grades. This may suggest higher growth expectations for Oklo, while Duke Energy’s grades reflect more stability and caution, impacting investor risk and return profiles differently.
Strengths and Weaknesses
Below is a comparative overview of the key strengths and weaknesses of Duke Energy Corporation (DUK) and Oklo Inc. (OKLO), based on the most recent financial and operational data.
| Criterion | Duke Energy Corporation (DUK) | Oklo Inc. (OKLO) |
|---|---|---|
| Diversification | Strong diversification with Electric Utilities and Infrastructure (~26.8B USD) and Gas Utilities (~2.3B USD) segments | Limited diversification; no reported revenue segmentation yet due to early stage |
| Profitability | Moderate profitability: net margin 14.86%, but ROIC (4.02%) below WACC (4.8%), indicating slight value destruction | Negative profitability: net margin 0%, ROIC -19.23%, declining profitability |
| Innovation | Established utility with incremental growth in renewables, but limited breakthrough innovation | Emerging player in nuclear technology with high innovation potential but unproven commercial success |
| Global presence | Primarily U.S.-focused with significant scale in regulated utilities | Very limited or no global presence reported at this stage |
| Market Share | Large market share in U.S. electric and gas utilities | Negligible market share, still in development phase |
Key takeaways: Duke Energy maintains a solid market position with diversified revenue streams and stable profitability, though it faces slight value destruction and operational inefficiencies. Oklo, while highly innovative in nuclear technology, is currently unprofitable with declining returns and limited market presence, posing a higher risk profile for investors.
Risk Analysis
Below is a comparison of key risks for Duke Energy Corporation (DUK) and Oklo Inc. (OKLO) based on the most recent 2024 data:
| Metric | Duke Energy Corporation (DUK) | Oklo Inc. (OKLO) |
|---|---|---|
| Market Risk | Low beta (0.49), stable sector | Moderate beta (0.77), volatile growth sector |
| Debt level | High debt-to-equity (1.7), 45.7% debt to assets | Very low debt-to-equity (0.01), 0.46% debt to assets |
| Regulatory Risk | High (regulated electric utility with complex compliance) | Moderate (nuclear energy, subject to evolving regulations) |
| Operational Risk | Moderate (diverse generation assets, aging infrastructure) | High (early-stage, technology risks in nuclear innovation) |
| Environmental Risk | Moderate (coal and nuclear fuel use, transition challenges) | Moderate to high (nuclear fuel recycling and safety concerns) |
| Geopolitical Risk | Low (domestic U.S. operations) | Low (domestic U.S. operations) |
Duke Energy faces its greatest risks from regulatory pressures and high leverage, which could impact financial flexibility. Oklo’s main risks lie in operational execution and regulatory approval amid pioneering nuclear technology. Investors should weigh Duke’s stable but leveraged profile against Oklo’s innovative but higher-risk position.
Which Stock to Choose?
Duke Energy Corporation (DUK) shows a favorable income evolution with growing revenue and net income over 2020-2024, supported by strong gross and EBIT margins. Despite an unfavorable debt level and some weak liquidity ratios, its profitability remains solid, and its rating is very favorable with a moderate overall score.
Oklo Inc. (OKLO) exhibits an unfavorable income evolution marked by no revenue growth and declining profitability metrics from 2021 to 2024. Financial ratios indicate a challenging position with negative returns and mixed liquidity, though it maintains a very favorable rating driven by low debt but with a very weak financial strength score.
For investors, Duke Energy’s slightly unfavorable financial ratios but favorable income statement and stable moderate rating could suggest it might appeal to those prioritizing income stability and quality investing. In contrast, Oklo’s unfavorable income and financial ratios with very weak financial strength might be more aligned with risk-tolerant investors focused on growth potential despite higher uncertainty.
Disclaimer: Investment carries a risk of loss of initial capital. The past performance is not a reliable indicator of future results. Be sure to understand risks before making an investment decision.
Go Further
I encourage you to read the complete analyses of Duke Energy Corporation and Oklo Inc. to enhance your investment decisions: