Home > Comparison > Utilities > NEE vs DUK
The strategic rivalry between NextEra Energy, Inc. and Duke Energy Corporation shapes the evolution of the U.S. utilities sector. NextEra excels as a clean energy innovator with a focus on renewable generation and long-term contracted assets. Duke operates a diversified utility portfolio spanning electric, gas, and commercial renewables. This analysis explores which company’s operational model delivers superior risk-adjusted returns, guiding investors seeking resilience and growth in regulated electric utilities.
Table of contents
Companies Overview
NextEra Energy and Duke Energy dominate the regulated electric utilities landscape with robust infrastructure and expanding clean energy portfolios.
NextEra Energy, Inc.: Renewable Power Pioneer
NextEra Energy stands as a leader in clean energy generation with 28,564 MW of net capacity. It generates revenue by producing electricity through wind, solar, nuclear, coal, and natural gas. In 2021, it strategically prioritized expanding renewable assets and battery storage, reinforcing its competitive edge in sustainable power solutions.
Duke Energy Corporation: Diversified Utility Giant
Duke Energy operates across electric utilities, gas infrastructure, and commercial renewables, serving 8.2M customers across six states. Its core revenue derives from electricity generation using coal, hydro, natural gas, oil, and nuclear fuel. In 2021, it focused on broadening its renewable footprint with 3,554 MW capacity across multiple states, balancing traditional and green energy sources.
Strategic Collision: Similarities & Divergences
Both companies leverage regulated electric utilities as their backbone but diverge in scale and resource mix. NextEra bets heavily on renewable dominance with a clean energy growth model. Duke maintains a diversified fuel strategy, combining fossil fuels and renewables. Their primary battleground is market share expansion in the Southeast US, with NextEra leading renewable innovation and Duke emphasizing infrastructure breadth. Their investment profiles reflect a trade-off between NextEra’s growth focus and Duke’s stability orientation.
Income Statement Comparison
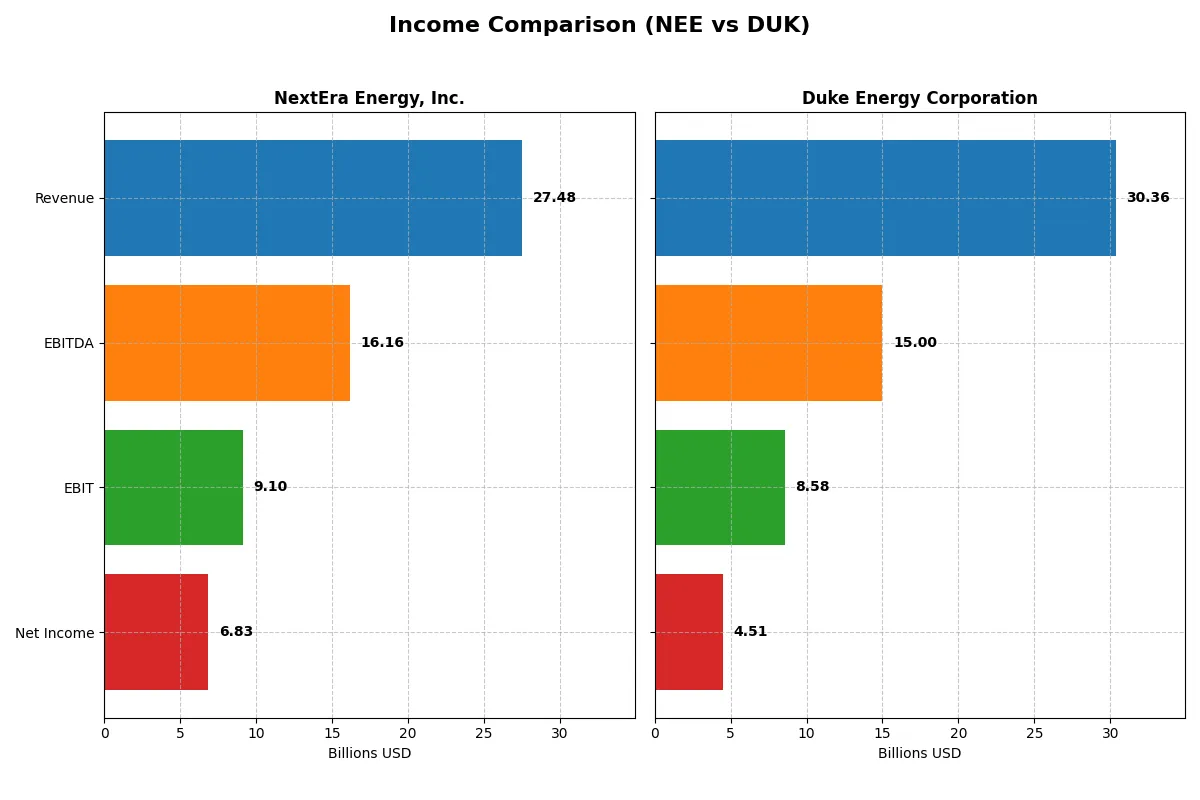
This data dissects the core profitability and scalability of both corporate engines to reveal who dominates the bottom line:
| Metric | NextEra Energy, Inc. (NEE) | Duke Energy Corporation (DUK) |
|---|---|---|
| Revenue | 27.5B | 30.4B |
| Cost of Revenue | 10.2B | 15.2B |
| Operating Expenses | 8.98B | 7.27B |
| Gross Profit | 17.3B | 15.2B |
| EBITDA | 16.2B | 15.0B |
| EBIT | 9.10B | 8.58B |
| Interest Expense | 4.57B | 3.38B |
| Net Income | 6.83B | 4.51B |
| EPS | 3.31 | 5.71 |
| Fiscal Year | 2025 | 2024 |
Income Statement Analysis: The Bottom-Line Duel
This income statement comparison reveals which company runs a more efficient and profitable business engine over recent years.
NextEra Energy, Inc. Analysis
NextEra Energy’s revenue climbed steadily from $17B in 2021 to $27.5B in 2025, with net income nearly doubling to $6.8B. It maintains a robust gross margin near 63%, signaling strong control over production costs. Despite a slight net margin dip last year, its overall margin growth and EPS gains show solid momentum and operational efficiency.
Duke Energy Corporation Analysis
Duke Energy’s revenue grew more modestly, from $23B in 2020 to $30.4B in 2024, while net income surged impressively by over 200% to $4.5B. The company sustains a healthy gross margin around 50%, with improving EBIT and net margins. Its EPS growth and margin expansion over the period highlight accelerating profitability despite slower revenue gains.
Margin Strength vs. Income Growth
NextEra delivers higher margins and consistent revenue growth, while Duke boasts remarkable net income and EPS expansion from a smaller base. NextEra’s scale and margin profile offer stability, but Duke’s rapid bottom-line growth demonstrates catching momentum. Investors seeking steady margin power may prefer NextEra; those valuing explosive earnings growth might lean toward Duke.
Financial Ratios Comparison
These vital ratios act as a diagnostic tool to expose the underlying fiscal health, valuation premiums, and capital efficiency of each company:
| Ratios | NextEra Energy, Inc. (NEE) | Duke Energy Corporation (DUK) |
|---|---|---|
| ROE | 13.9% | 9.0% |
| ROIC | 4.0% | 4.0% |
| P/E | 21.2 | 18.4 |
| P/B | 2.94 | 1.66 |
| Current Ratio | 0.47 | 0.67 |
| Quick Ratio | 0.38 | 0.44 |
| D/E (Debt-to-Equity) | 1.64 | 1.70 |
| Debt-to-Assets | 43.3% | 45.7% |
| Interest Coverage | 3.35 | 2.34 |
| Asset Turnover | 0.13 | 0.16 |
| Fixed Asset Turnover | 0.18 | 0.24 |
| Payout Ratio | 61.0% | 71.2% |
| Dividend Yield | 2.87% | 3.86% |
| Fiscal Year | 2024 | 2024 |
Efficiency & Valuation Duel: The Vital Signs
Financial ratios serve as a company’s DNA, exposing hidden risks and revealing operational strength crucial for investors.
NextEra Energy, Inc.
NextEra posts a solid net margin of 28.06%, reflecting robust profitability, yet its ROE of 13.86% is only neutral. The P/E of 21.23 suggests a fairly valued stock, neither cheap nor stretched. Shareholders benefit from a favorable 2.87% dividend yield, signaling steady income and confidence in capital allocation.
Duke Energy Corporation
Duke’s net margin at 14.86% is favorable but notably lower than NextEra’s. Its ROE of 9.0% is unfavorable, indicating weaker equity returns. The P/E multiple of 18.44 aligns with moderate valuation. Duke offers a higher dividend yield of 3.86%, compensating investors amid subdued operational efficiency.
Premium Valuation vs. Income Yield Balance
NextEra trades at a premium with stronger profitability metrics but offers a lower dividend yield than Duke. Duke provides better income through dividends despite weaker returns on equity. Risk-tolerant investors may prefer NextEra’s growth potential; income-focused investors might lean toward Duke’s yield profile.
Which one offers the Superior Shareholder Reward?
NextEra Energy (NEE) delivers a balanced distribution model with a 2.87% dividend yield and a 61% payout ratio, supported by steady free cash flow of 2.3B. Its share buybacks are moderate but consistent, enhancing total returns sustainably. Duke Energy (DUK) offers a higher dividend yield near 3.9% but with a riskier 71% payout ratio and minimal free cash flow of 62M, signaling tight cash for distributions. DUK’s buyback activity is negligible, reducing upside from capital returns. I see NEE’s disciplined reinvestment and buybacks as more sustainable for long-term shareholder reward in 2026. Thus, I favor NextEra’s total return profile for prudent investors seeking both income and growth.
Comparative Score Analysis: The Strategic Profile
The radar chart reveals the fundamental DNA and trade-offs of NextEra Energy, Inc. and Duke Energy Corporation, highlighting their core financial strengths and weaknesses:
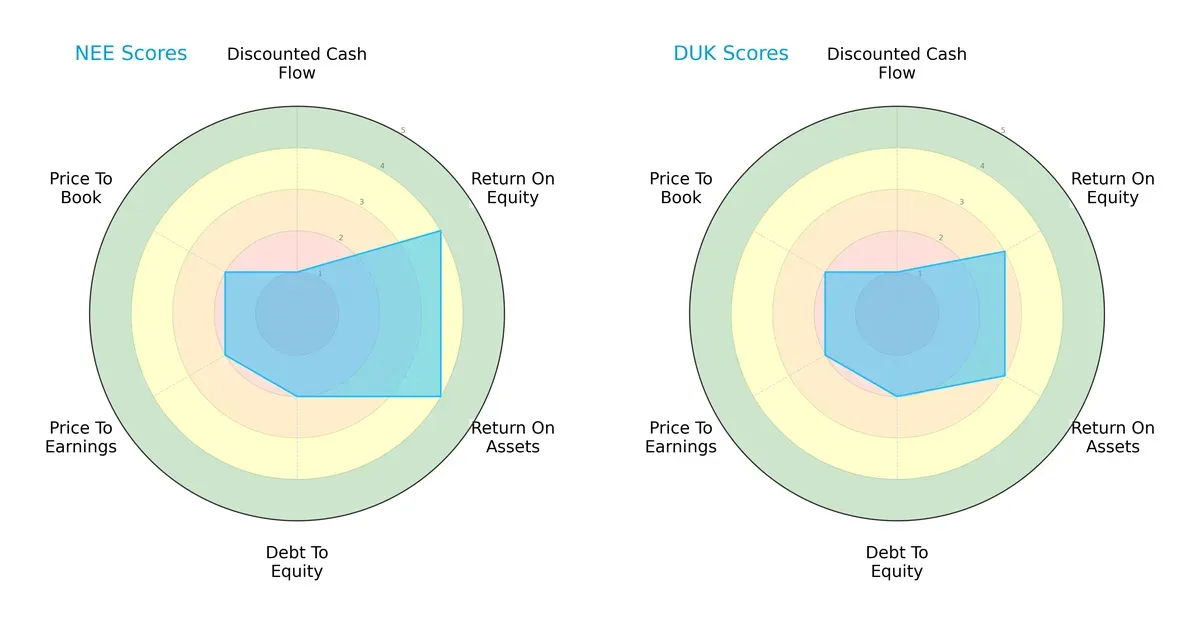
NextEra Energy shows stronger profitability with higher ROE (4 vs. 3) and ROA (4 vs. 3) scores than Duke Energy. Both firms share equal DCF (1) and leverage profiles (Debt/Equity score 2), reflecting moderate financial risk. Valuation metrics (PE and PB) sit at moderate levels for both, indicating neither is currently undervalued. NextEra has a more balanced profile weighted toward operational efficiency, while Duke leans on steadier but less robust returns.
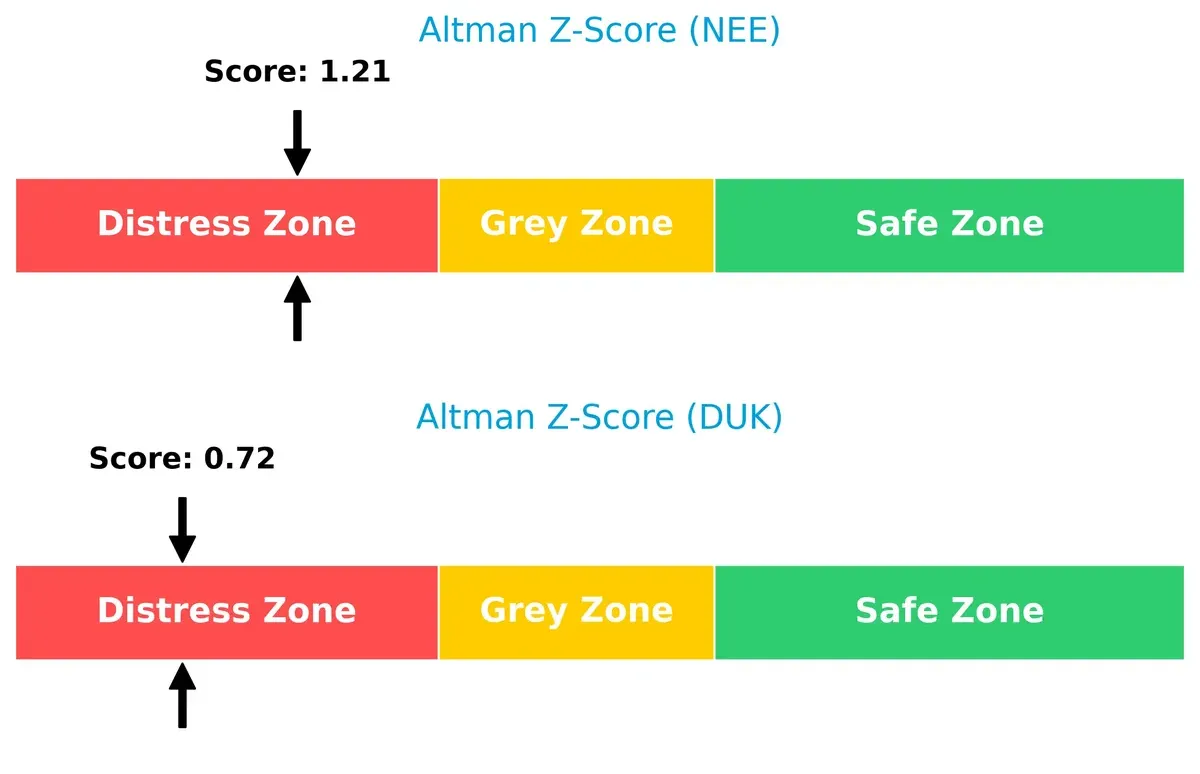
Bankruptcy Risk: Solvency Showdown
NextEra’s Altman Z-Score (1.21) outperforms Duke’s (0.72), though both reside in the distress zone, signaling elevated bankruptcy risk amid this cycle’s challenges:
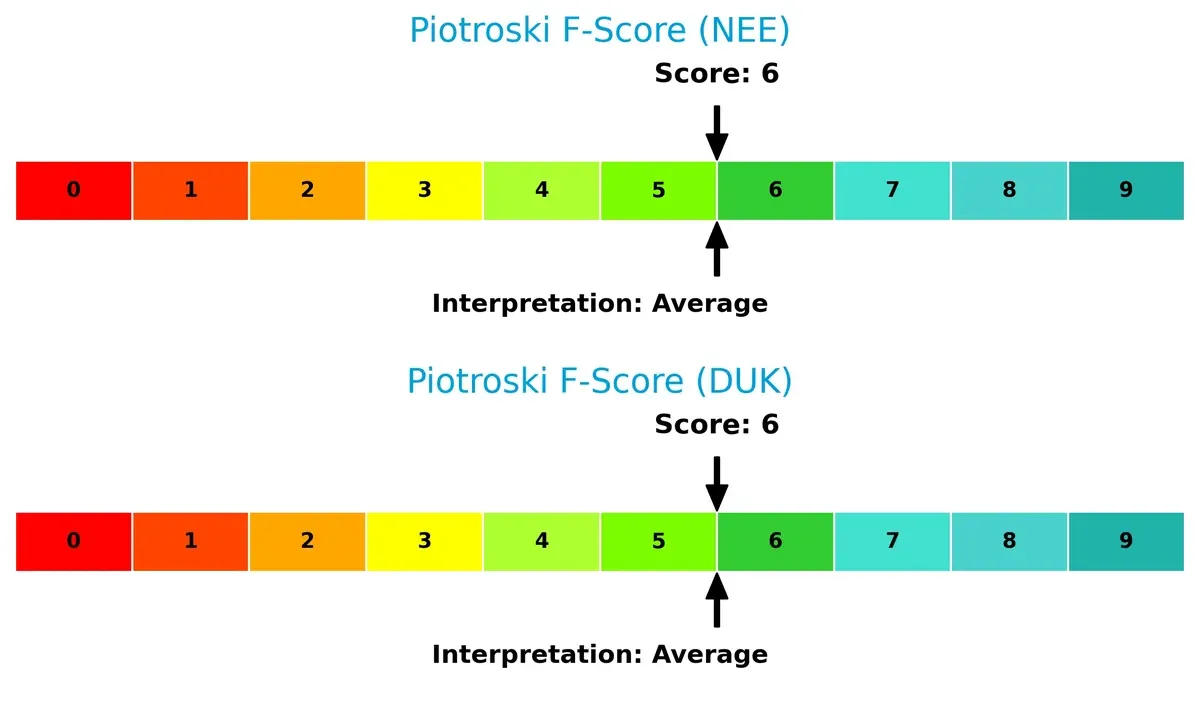
Financial Health: Quality of Operations
Both companies score a 6 on the Piotroski F-Score, indicating average financial health. Neither shows acute internal red flags, but neither ranks among the strongest financial performers either:
How are the two companies positioned?
This section dissects the operational DNA of NextEra Energy and Duke Energy by comparing their revenue distribution and internal strengths and weaknesses. The goal is to confront their economic moats to identify which model offers the most resilient and sustainable competitive advantage today.
Revenue Segmentation: The Strategic Mix
This visual comparison dissects how NextEra Energy, Inc. and Duke Energy Corporation diversify their income streams and where their primary sector bets lie:
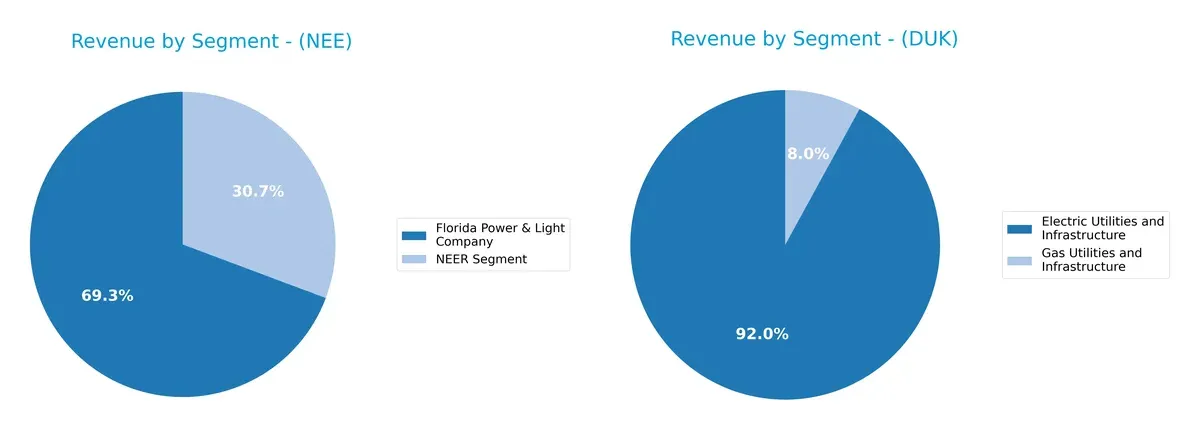
NextEra Energy anchors revenue in Florida Power & Light at $17B, with a significant $7.5B from NEER Segment, showing moderate diversification. Duke Energy dwarfs with $26.8B from Electric Utilities and $2.3B in Gas Utilities, relying heavily on regulated infrastructure. NextEra’s mix leans on ecosystem lock-in through regional dominance, while Duke’s concentration signals infrastructure dominance but exposes it to regulatory risk.
Strengths and Weaknesses Comparison
This table compares the strengths and weaknesses of NextEra Energy, Inc. and Duke Energy Corporation:
NextEra Energy, Inc. Strengths
- Strong net margin at 28.06%
- Favorable WACC at 6.4%
- High dividend yield at 2.87%
- Large revenue from Florida Power & Light segment
Duke Energy Corporation Strengths
- Favorable net margin at 14.86%
- Lower WACC at 4.85%
- Higher dividend yield at 3.86%
- Significant revenue from Electric Utilities and Infrastructure
NextEra Energy, Inc. Weaknesses
- Low current ratio at 0.47 signals liquidity risk
- Unfavorable ROIC at 4.04% below WACC
- High debt-to-equity ratio at 1.64
- Weak interest coverage at 1.99
- Low asset turnover metrics
Duke Energy Corporation Weaknesses
- Low current ratio at 0.67 indicates liquidity concerns
- Unfavorable ROIC at 4.02% below WACC
- High debt-to-equity ratio at 1.7
- Neutral interest coverage at 2.53
- Unfavorable asset turnover ratios
NextEra Energy excels in profitability but faces liquidity and capital efficiency challenges. Duke Energy maintains solid profitability with lower WACC, yet also shows liquidity and return on capital weaknesses. Both companies must address operational efficiency and capital structure risks to strengthen their financial resilience.
The Moat Duel: Analyzing Competitive Defensibility
A structural moat is the only barrier protecting long-term profits from relentless competition erosion. Let’s examine how NextEra Energy and Duke Energy defend their turf:
NextEra Energy, Inc. (NEE): Intangible Assets and Innovation Moat
NextEra leverages cutting-edge renewable technology and regulatory approvals to maintain a premium ROIC despite recent declines. Its large-scale clean energy projects could deepen this moat but rising interest expenses threaten margin stability in 2026.
Duke Energy Corporation (DUK): Operational Scale and Infrastructure Moat
Duke’s moat centers on its extensive regulated utility infrastructure and steady ROIC growth, contrasting with NextEra’s declining profitability. Expanding commercial renewables and gas infrastructure position Duke for gradual market share gains.
Moat Battle: Innovation Edge vs. Infrastructure Scale
Duke Energy exhibits a wider and more durable moat with improving ROIC and infrastructure dominance. NextEra’s innovation-driven moat is deeper but currently weakens under cost pressures. Duke is better equipped to defend and grow its market position.
Which stock offers better returns?
The past year shows strong price appreciation for both stocks, with NextEra Energy leading in gains despite some deceleration. Duke Energy maintains a steady bullish trend but with less momentum recently.
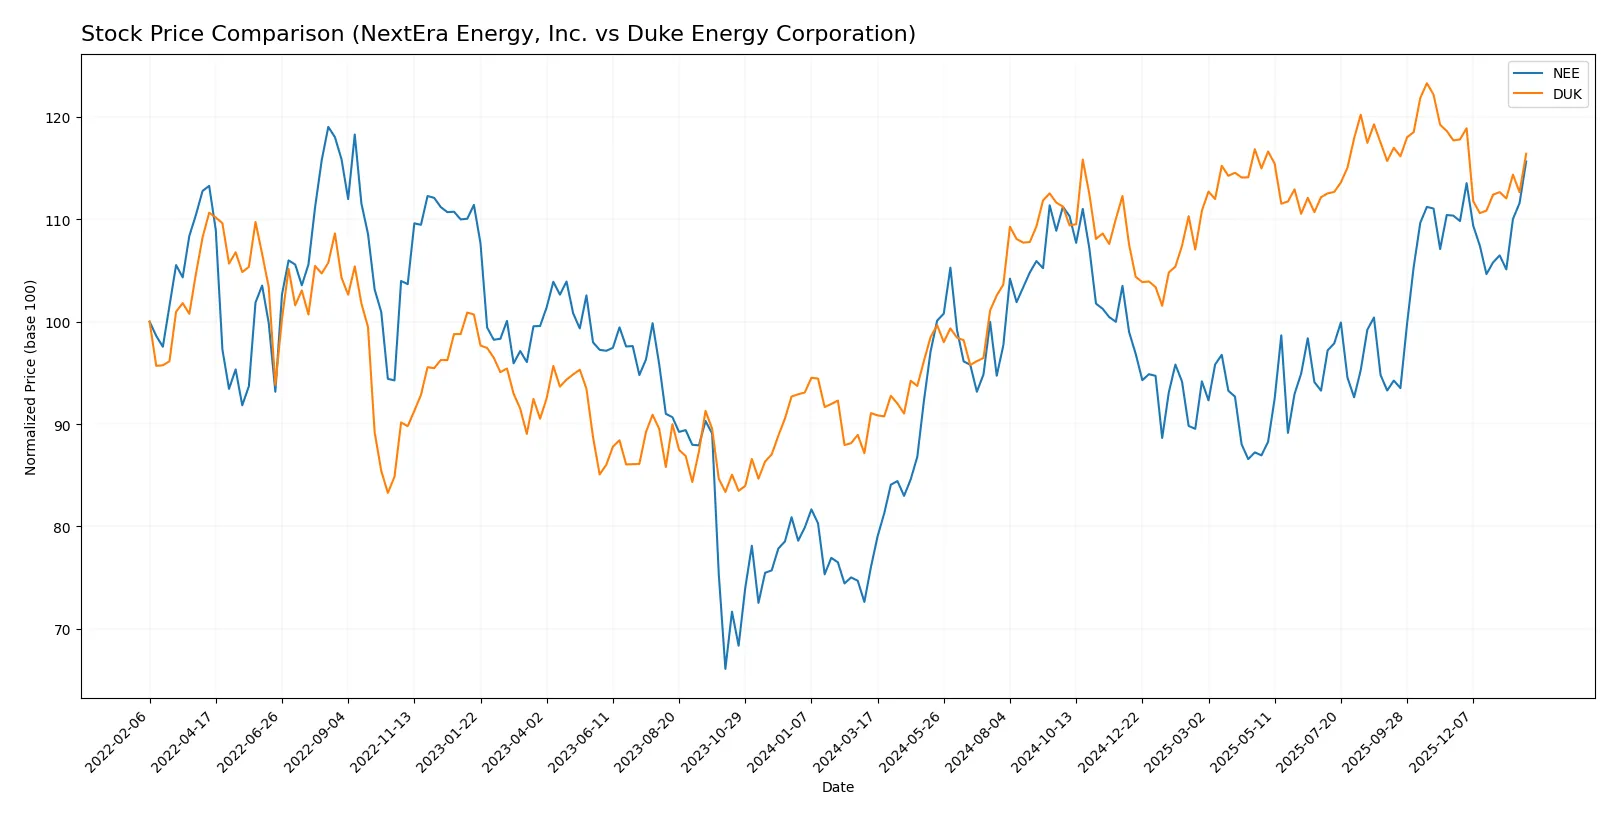
Trend Comparison
NextEra Energy (NEE) exhibits a 52.05% price increase over the last 12 months, signaling a bullish trend with decelerating momentum. Its price ranged between 57.81 and 87.9, showing moderated volatility (6.42 std dev).
Duke Energy (DUK) posted a 27.82% rise over the same period, also bullish but decelerating. Price fluctuated from 94.61 to 128.53 with higher volatility (8.39 std dev). Recent trend shows a slight pullback (-1.11%).
NEE outperformed DUK by a wide margin in total returns over 12 months, despite slowing acceleration; DUK’s recent slight decline contrasts with NEE’s continued modest upward trend.
Target Prices
Analysts present a confident target price range, signaling moderate upside potential for these utilities stocks.
| Company | Target Low | Target High | Consensus |
|---|---|---|---|
| NextEra Energy, Inc. | 84 | 104 | 93.09 |
| Duke Energy Corporation | 115 | 143 | 133.45 |
NextEra Energy’s consensus target at 93.09 suggests a slight premium over its current 87.9 price. Duke Energy’s 133.45 target implies significant upside from its 121.35 price, reflecting robust analyst optimism.

Don’t Let Luck Decide Your Entry Point
Optimize your entry points with our advanced ProRealTime indicators. You’ll get efficient buy signals with precise price targets for maximum performance. Start outperforming now!
How do institutions grade them?
NextEra Energy, Inc. Grades
The following table summarizes recent grades assigned to NextEra Energy by major institutions.
| Grading Company | Action | New Grade | Date |
|---|---|---|---|
| Mizuho | Maintain | Neutral | 2026-01-28 |
| Argus Research | Maintain | Buy | 2026-01-28 |
| BMO Capital | Maintain | Outperform | 2026-01-27 |
| Wells Fargo | Maintain | Overweight | 2026-01-20 |
| Barclays | Maintain | Equal Weight | 2026-01-15 |
| Jefferies | Maintain | Hold | 2025-12-31 |
| UBS | Maintain | Buy | 2025-12-17 |
| JP Morgan | Maintain | Overweight | 2025-12-11 |
| BMO Capital | Maintain | Outperform | 2025-12-10 |
| UBS | Maintain | Buy | 2025-12-10 |
Duke Energy Corporation Grades
Below is a summary of recent grades from key analysts for Duke Energy Corporation.
| Grading Company | Action | New Grade | Date |
|---|---|---|---|
| Wells Fargo | Maintain | Equal Weight | 2026-01-20 |
| Barclays | Maintain | Overweight | 2026-01-15 |
| UBS | Maintain | Neutral | 2025-12-17 |
| JP Morgan | Maintain | Neutral | 2025-12-11 |
| Mizuho | Maintain | Outperform | 2025-10-27 |
| Morgan Stanley | Maintain | Equal Weight | 2025-10-22 |
| Barclays | Maintain | Overweight | 2025-10-14 |
| BMO Capital | Maintain | Outperform | 2025-10-10 |
| UBS | Maintain | Neutral | 2025-10-10 |
| Scotiabank | Upgrade | Sector Outperform | 2025-10-03 |
Which company has the best grades?
NextEra Energy consistently receives stronger ratings, including multiple “Buy” and “Outperform” grades. Duke Energy shows more mixed assessments, often rated at “Neutral” or “Equal Weight.” This divergence may influence investor confidence and portfolio positioning differently.
Risks specific to each company
The following categories identify the critical pressure points and systemic threats facing both firms in the 2026 market environment:
1. Market & Competition
NextEra Energy, Inc.
- Faces intense competition in renewable energy markets with rapid technological change.
Duke Energy Corporation
- Operates in more diversified regions but faces regulatory pressure on coal and gas segments.
2. Capital Structure & Debt
NextEra Energy, Inc.
- Debt-to-equity ratio of 1.64 signals elevated leverage; interest coverage at 1.99 is weak, raising refinancing risks.
Duke Energy Corporation
- Slightly higher leverage at 1.7; better interest coverage at 2.53 but still moderate financial risk.
3. Stock Volatility
NextEra Energy, Inc.
- Beta of 0.73 indicates moderate market sensitivity, balancing growth and stability.
Duke Energy Corporation
- Lower beta of 0.49 signals more defensive stock behavior with less price fluctuation.
4. Regulatory & Legal
NextEra Energy, Inc.
- Regulatory risks tied to clean energy mandates and grid modernization in Florida and US coasts.
Duke Energy Corporation
- Exposure to multi-state regulations complicates compliance, especially in coal and gas-heavy regions.
5. Supply Chain & Operations
NextEra Energy, Inc.
- Complex operations with 28,564 MW capacity and extensive transmission network; renewable project execution risk.
Duke Energy Corporation
- Larger asset base (50,259 MW) with coal and gas reliance adds operational complexity and transition risk.
6. ESG & Climate Transition
NextEra Energy, Inc.
- Strong focus on renewables and battery storage but capital-intensive; risks in scaling transition costs.
Duke Energy Corporation
- Slower renewable adoption pace; legacy fossil fuel assets may face stranded asset risk.
7. Geopolitical Exposure
NextEra Energy, Inc.
- Primarily US-focused with limited international geopolitical risk.
Duke Energy Corporation
- US-centric operations but exposure to regional political shifts could impact regulatory environment.
Which company shows a better risk-adjusted profile?
NextEra’s biggest risk lies in its stretched capital structure and weak liquidity ratios, raising refinancing concerns. Duke’s primary threat is its slower transition from fossil fuels, exposing it to regulatory and stranded asset risks. Both firms are in the distress zone for Altman Z-scores, signaling financial vulnerability. Duke’s lower beta and slightly better interest coverage suggest a marginally more stable risk profile. However, NextEra’s aggressive renewable strategy may offer better long-term upside if capital risks are managed prudently. Recent data confirms both face significant financial strain, but Duke’s operational diversification cushions risk more effectively. I see Duke as having a slightly better risk-adjusted stance today.
Final Verdict: Which stock to choose?
NextEra Energy’s superpower lies in its robust revenue growth and strong net margins, signaling a company with impressive operational scale and pricing power. However, its declining ROIC and stretched liquidity ratios are points of vigilance, suggesting capital efficiency and short-term financial health need monitoring. It fits well in aggressive growth portfolios that can tolerate these risks.
Duke Energy’s strategic moat is its steady dividend yield and improving profitability trajectory, reflecting a utility with resilient cash flow and a growing return on invested capital. Relative to NextEra, Duke offers better balance sheet stability, making it more suitable for investors seeking GARP—growth at a reasonable price—with a focus on income and moderate risk.
If you prioritize rapid expansion and operational leverage, NextEra Energy is the compelling choice due to its strong top-line momentum and market positioning. However, if you seek income stability and improving capital efficiency, Duke Energy offers better stability and a more balanced risk profile. Both companies carry risks inherent to capital-intensive sectors, so aligning with your risk tolerance is crucial.
Disclaimer: Investment carries a risk of loss of initial capital. The past performance is not a reliable indicator of future results. Be sure to understand risks before making an investment decision.
Go Further
I encourage you to read the complete analyses of NextEra Energy, Inc. and Duke Energy Corporation to enhance your investment decisions: