In the evolving utilities sector, Duke Energy Corporation and FirstEnergy Corp. stand out as key players shaping the future of regulated electric power in the United States. Both companies serve millions of customers with diverse energy portfolios including renewables, nuclear, and traditional sources, reflecting their innovation strategies and market reach. This comparison explores their strengths and challenges, guiding investors to identify which company offers the most compelling opportunity. Let’s dive in to find the best fit for your investment wallet.

Table of contents
Companies Overview
I will begin the comparison between Duke Energy Corporation and FirstEnergy Corp. by providing an overview of these two companies and their main differences.
Duke Energy Corporation Overview
Duke Energy Corporation operates as a major energy company in the U.S., serving approximately 8.2M customers across six states in the Southeast and Midwest. It focuses on electric utilities, gas utilities, and commercial renewables, with a generation capacity of about 50,259 MW. Its diverse energy portfolio includes coal, natural gas, nuclear, hydroelectric, solar, wind, and battery storage facilities, positioning it as an integrated energy provider.
FirstEnergy Corp. Overview
FirstEnergy Corp. generates, transmits, and distributes electricity primarily in Ohio, Pennsylvania, West Virginia, Maryland, New Jersey, and New York, serving around 6M customers. The company operates coal, nuclear, hydroelectric, natural gas, wind, and solar power plants, along with extensive transmission and distribution networks. Its business revolves around regulated distribution and transmission segments, emphasizing infrastructure within its service territories.
Key similarities and differences
Both companies operate in the regulated electric utility industry in the U.S. and utilize diverse energy sources, including coal, nuclear, natural gas, wind, and solar. Duke Energy’s footprint covers more states with a larger customer base and significant renewable energy investments, while FirstEnergy focuses on fewer states with a strong emphasis on transmission and distribution infrastructure. Duke’s operations include gas utilities and commercial renewables, unlike FirstEnergy’s primarily electric-focused segments.
Income Statement Comparison
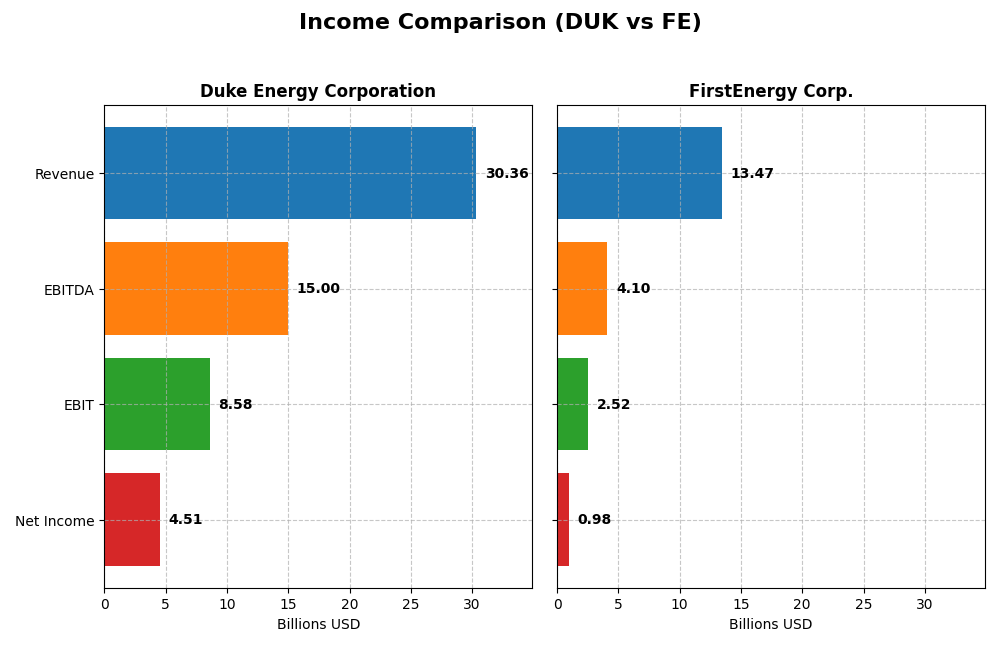
Below is the income statement comparison for Duke Energy Corporation and FirstEnergy Corp. based on their most recent fiscal year data from 2024.
| Metric | Duke Energy Corporation (DUK) | FirstEnergy Corp. (FE) |
|---|---|---|
| Market Cap | 90.8B | 25.8B |
| Revenue | 30.4B | 13.5B |
| EBITDA | 15.0B | 4.1B |
| EBIT | 8.6B | 2.5B |
| Net Income | 4.5B | 978M |
| EPS | 5.71 | 1.70 |
| Fiscal Year | 2024 | 2024 |
Income Statement Interpretations
Duke Energy Corporation
Duke Energy showed steady revenue growth from $23.4B in 2020 to $30.4B in 2024, with net income surging significantly from $1.28B to $4.51B. Margins improved overall, with gross margin around 50% and net margin near 15%, reflecting solid profitability. In 2024, revenue growth slowed modestly to 4.46%, but gross profit and EBIT margins rose, indicating operational efficiency gains.
FirstEnergy Corp.
FirstEnergy’s revenue increased from $10.8B in 2020 to $13.5B in 2024, while net income declined from $1.08B to $978M. The company maintained a high gross margin above 67%, but net margin decreased to 7.26%. In 2024, revenue growth was neutral at 4.68%, though net margin and EPS contracted, signaling profitability pressures despite stable top-line growth.
Which one has the stronger fundamentals?
Duke Energy exhibits stronger fundamentals with favorable trends in revenue and net income growth over five years, alongside improving margins and EPS. FirstEnergy faces challenges, showing declining net income and margins despite stable revenue gains. Duke’s higher EBIT and net margins, plus positive growth metrics, contrast with FirstEnergy’s unfavorable earnings trends, suggesting a more robust income statement profile.
Financial Ratios Comparison
The table below presents a side-by-side comparison of key financial ratios for Duke Energy Corporation (DUK) and FirstEnergy Corp. (FE) based on the most recent fiscal year data available for 2024.
| Ratios | Duke Energy Corporation (DUK) | FirstEnergy Corp. (FE) |
|---|---|---|
| ROE | 8.997% | 7.852% |
| ROIC | 4.017% | 3.660% |
| P/E | 18.44 | 23.39 |
| P/B | 1.66 | 1.84 |
| Current Ratio | 0.67 | 0.56 |
| Quick Ratio | 0.44 | 0.45 |
| D/E (Debt to Equity) | 1.70 | 1.95 |
| Debt-to-Assets | 45.7% | 46.6% |
| Interest Coverage | 2.34 | 2.35 |
| Asset Turnover | 0.163 | 0.259 |
| Fixed Asset Turnover | 0.244 | 0.328 |
| Payout ratio | 71.2% | 99.2% |
| Dividend yield | 3.86% | 4.24% |
Interpretation of the Ratios
Duke Energy Corporation
Duke Energy shows mixed ratio strength with favorable net margin (14.86%) and dividend yield (3.86%), but weak return on equity (9.0%) and return on invested capital (4.02%). Liquidity ratios are weak, with a current ratio at 0.67 and debt-to-equity at 1.7, indicating leverage concerns. The company pays dividends, supported by a moderate payout ratio, though free cash flow coverage is minimal, signaling potential sustainability risks.
FirstEnergy Corp.
FirstEnergy’s ratios reflect neutral net margin (7.26%) and favorable WACC (4.85%), but unfavorable returns on equity (7.85%) and invested capital (3.66%). Liquidity remains weak with a current ratio of 0.56 and debt-to-equity of 1.95, suggesting financial leverage pressures. The dividend yield is slightly higher at 4.24%, yet free cash flow coverage appears insufficient, raising concerns about long-term dividend sustainability.
Which one has the best ratios?
Both companies exhibit a similar proportion of unfavorable ratios (50%) and slightly unfavorable overall assessments. Duke Energy has a stronger net margin and dividend yield, while FirstEnergy shows better WACC and dividend yield but weaker returns. Neither company distinctly outperforms the other in key financial metrics, indicating comparable risk profiles.
Strategic Positioning
This section compares the strategic positioning of Duke Energy Corporation and FirstEnergy Corp., focusing on market position, key segments, and exposure to technological disruption:
Duke Energy Corporation
- Leading utility with 8.2M customers across Southeast and Midwest, facing moderate competitive pressure.
- Diversified segments: Electric Utilities, Gas Utilities, Commercial Renewables driving growth.
- Active in renewables with wind, solar, battery storage, and fuel cells, adapting to energy transition.
FirstEnergy Corp.
- Serves 6M customers in six states, operating in a competitive regulated electric market.
- Concentrated on Regulated Distribution and Transmission segments with coal, nuclear, and renewables.
- Owns coal, nuclear, hydro, wind, solar plants; less emphasis on renewables expansion in data provided.
Duke Energy Corporation vs FirstEnergy Corp. Positioning
Duke Energy shows a diversified approach with strong renewables focus and multiple utility segments, while FirstEnergy concentrates on regulated electric distribution and transmission. Duke’s broader portfolio may offer growth avenues; FirstEnergy’s focused model centers on traditional regulated assets.
Which has the best competitive advantage?
Based on MOAT evaluation, Duke Energy’s slightly unfavorable but improving ROIC trend indicates moderate value destruction with increasing profitability. FirstEnergy’s very unfavorable and declining ROIC trend shows stronger value destruction and decreasing profitability, suggesting a weaker competitive advantage.
Stock Comparison
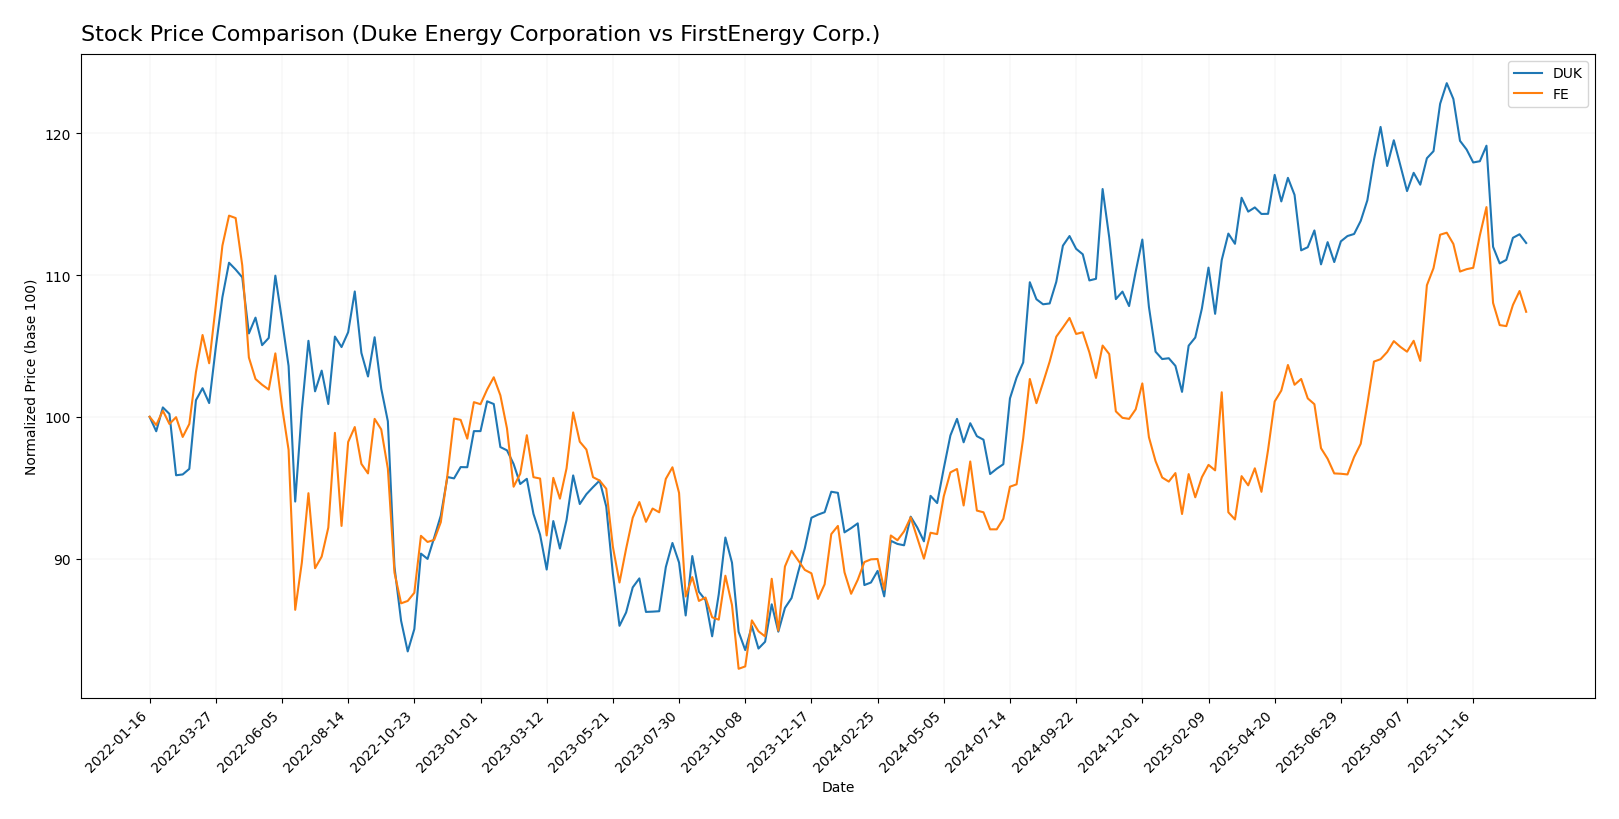
The stock price movements of Duke Energy Corporation and FirstEnergy Corp. over the past 12 months reveal distinct bullish trends with notable deceleration and recent downward pressure in both cases.
Trend Analysis
Duke Energy Corporation’s stock showed a 27.12% increase over the past year, indicating a bullish trend with deceleration. The price ranged between 90.86 and 128.53, with recent weeks reflecting an 8.3% decline.
FirstEnergy Corp. experienced a 19.42% gain over the last 12 months, also bullish but decelerating. Its price fluctuated from 36.5 to 47.72, followed by a recent 4.27% drop in the closing period.
Comparing both, Duke Energy delivered the highest market performance with a stronger overall gain, though both stocks faced recent short-term declines.
Target Prices
Analysts present a clear consensus on target prices for Duke Energy Corporation and FirstEnergy Corp.
| Company | Target High | Target Low | Consensus |
|---|---|---|---|
| Duke Energy Corporation | 150 | 126 | 135.91 |
| FirstEnergy Corp. | 54 | 46 | 49.29 |
The target consensus for both stocks suggests upside potential compared to current prices: Duke Energy trades at 116.8 USD, well below its 135.91 USD consensus, while FirstEnergy’s current price of 44.65 USD is also below its 49.29 USD consensus. This indicates moderate analyst optimism for price appreciation.
Analyst Opinions Comparison
This section compares analysts’ ratings and grades for Duke Energy Corporation and FirstEnergy Corp.:
Rating Comparison
DUK Rating
- Rating: C+, considered very favorable overall
- Discounted Cash Flow Score: 1, very unfavorable
- ROE Score: 3, moderate
- ROA Score: 3, moderate
- Debt To Equity Score: 2, moderate
- Overall Score: 2, moderate
FE Rating
- Rating: B, considered very favorable overall
- Discounted Cash Flow Score: 4, favorable
- ROE Score: 4, favorable
- ROA Score: 3, moderate
- Debt To Equity Score: 1, very unfavorable
- Overall Score: 3, moderate
Which one is the best rated?
Based strictly on the provided data, FirstEnergy Corp. is better rated with a higher overall score (3 vs. 2) and stronger scores in discounted cash flow and return on equity. Duke Energy has a slightly better debt-to-equity rating.
Scores Comparison
The following table compares the Altman Z-Score and Piotroski Score for Duke Energy Corporation and FirstEnergy Corp.:
Duke Energy Corporation Scores
- Altman Z-Score: 0.71, indicating financial distress
- Piotroski Score: 6, classified as average
FirstEnergy Corp. Scores
- Altman Z-Score: 0.78, also indicating distress
- Piotroski Score: 6, similarly classified average
Which company has the best scores?
Both Duke Energy and FirstEnergy have Altman Z-Scores in the distress zone, reflecting significant bankruptcy risk. Their Piotroski Scores are identical at 6, indicating average financial strength for each company.
Grades Comparison
Here is a detailed comparison of the recent grades assigned to Duke Energy Corporation and FirstEnergy Corp.:
Duke Energy Corporation Grades
The table below summarizes the latest grades from reputable financial institutions for Duke Energy Corporation:
| Grading Company | Action | New Grade | Date |
|---|---|---|---|
| UBS | Maintain | Neutral | 2025-12-17 |
| JP Morgan | Maintain | Neutral | 2025-12-11 |
| Mizuho | Maintain | Outperform | 2025-10-27 |
| Morgan Stanley | Maintain | Equal Weight | 2025-10-22 |
| Barclays | Maintain | Overweight | 2025-10-14 |
| UBS | Maintain | Neutral | 2025-10-10 |
| BMO Capital | Maintain | Outperform | 2025-10-10 |
| Scotiabank | Upgrade | Sector Outperform | 2025-10-03 |
| Jefferies | Downgrade | Hold | 2025-09-26 |
| Morgan Stanley | Maintain | Equal Weight | 2025-09-25 |
Overall, Duke Energy’s ratings show a balanced mix of neutral to outperform grades with some recent upgrades and a single downgrade, indicating stable analyst sentiment.
FirstEnergy Corp. Grades
The table below summarizes the latest grades from reputable financial institutions for FirstEnergy Corp.:
| Grading Company | Action | New Grade | Date |
|---|---|---|---|
| UBS | Maintain | Neutral | 2025-12-17 |
| Scotiabank | Maintain | Sector Outperform | 2025-10-24 |
| UBS | Maintain | Neutral | 2025-10-24 |
| Mizuho | Maintain | Neutral | 2025-10-24 |
| Morgan Stanley | Maintain | Overweight | 2025-10-21 |
| Jefferies | Maintain | Hold | 2025-10-21 |
| Keybanc | Downgrade | Sector Weight | 2025-10-15 |
| Scotiabank | Maintain | Sector Outperform | 2025-10-06 |
| Morgan Stanley | Maintain | Overweight | 2025-09-25 |
| Barclays | Upgrade | Overweight | 2025-08-25 |
FirstEnergy’s grades largely range from neutral to overweight, with consistent maintenance of positive sector outperform calls and few downgrades, suggesting steady analyst confidence.
Which company has the best grades?
Duke Energy and FirstEnergy both hold a consensus “Hold” rating with similar numbers of buy and hold grades. However, Duke Energy exhibits a slightly broader range including several outperform and sector outperform ratings, while FirstEnergy shows more overweight ratings. Investors may interpret Duke’s more varied analyst opinions as a signal of nuanced potential, whereas FirstEnergy’s steadier overweight grades indicate a relatively consistent positive outlook.
Strengths and Weaknesses
Below is a comparison table summarizing key strengths and weaknesses of Duke Energy Corporation (DUK) and FirstEnergy Corp. (FE) based on recent financial and operational data.
| Criterion | Duke Energy Corporation (DUK) | FirstEnergy Corp. (FE) |
|---|---|---|
| Diversification | Strong in electric utilities ($26.8B) and gas utilities ($2.3B) with growing renewables segment | Primarily focused on regulated distribution ($6.9B) and transmission ($1.8B), less diversified |
| Profitability | Moderate net margin (14.9%), but ROIC (4.0%) below WACC, showing slight value destruction | Lower net margin (7.3%) and ROIC (3.7%) also below WACC, with declining profitability |
| Innovation | Emerging commercial renewables business, signaling some innovation | Limited evidence of innovation, focused on traditional regulated energy services |
| Global presence | Mainly US-focused with stable infrastructure assets | US-centric with no significant international operations |
| Market Share | Leading position in regulated electric and gas utilities | Strong regional presence in distribution and transmission, but smaller scale than DUK |
Key takeaways: Duke Energy shows better diversification and a growing profitability trend despite currently destroying value, while FirstEnergy struggles with declining ROIC and lower margins. Both face challenges in innovation, but Duke’s move into renewables offers a potential edge. Risk-averse investors should note the value destruction signals.
Risk Analysis
Below is a summary table of key risks for Duke Energy Corporation (DUK) and FirstEnergy Corp. (FE) based on the latest 2024 data:
| Metric | Duke Energy Corporation (DUK) | FirstEnergy Corp. (FE) |
|---|---|---|
| Market Risk | Low beta at 0.49 indicates lower market volatility exposure | Moderate beta at 0.63 shows moderate market volatility exposure |
| Debt level | High debt-to-equity ratio of 1.7 (unfavorable) | Even higher debt-to-equity at 1.95 (unfavorable) |
| Regulatory Risk | Moderate, operates in regulated electric utilities in multiple states | Moderate, similar regulated electric utility exposure |
| Operational Risk | Diverse energy mix including coal, nuclear, renewables; some operational complexity | Broad energy portfolio, including coal and nuclear, operational challenges present |
| Environmental Risk | Exposure to coal and nuclear raises environmental compliance costs | Similar environmental exposure with coal and nuclear assets |
| Geopolitical Risk | US-focused operations minimize geopolitical risk | US-focused as well, low geopolitical risk |
The most significant risks for both companies stem from their high debt levels and environmental exposures due to coal and nuclear assets. Both firms are in the distress zone per Altman Z-Score, indicating elevated bankruptcy risk. Market volatility is moderate to low, but regulatory changes and operational challenges in transitioning to renewables remain impactful. Investors should carefully weigh these financial and environmental risks.
Which Stock to Choose?
Duke Energy Corporation (DUK) shows a favorable income evolution with 29.92% revenue growth over five years and strong net margin at 14.86%. Despite high debt and a current ratio of 0.67, its financial ratios are slightly unfavorable overall, with a moderate rating of C+ and a growing but negative value creation trend.
FirstEnergy Corp. (FE) presents a mixed income profile, with 24.86% revenue growth but declining net income and margin over the period. Financial ratios are also slightly unfavorable, burdened by high debt and a current ratio of 0.56, while its rating is B with a very unfavorable value creation status and declining profitability.
Investors prioritizing income growth and improving profitability might find Duke Energy’s profile more aligned with growth strategies, whereas those focusing on companies with higher ratings but facing profitability challenges could view FirstEnergy’s profile as suitable for a different risk-tolerant approach.
Disclaimer: Investment carries a risk of loss of initial capital. The past performance is not a reliable indicator of future results. Be sure to understand risks before making an investment decision.
Go Further
I encourage you to read the complete analyses of Duke Energy Corporation and FirstEnergy Corp. to enhance your investment decisions: