Home > Comparison > Utilities > DUK vs EXC
The strategic rivalry between Duke Energy Corporation and Exelon Corporation shapes the evolving landscape of the regulated electric utilities sector. Duke operates as a capital-intensive utility with a diversified generation mix spanning coal to renewables, serving over 8 million customers across six states. Exelon, a utility holding company, combines nuclear dominance with broad energy services across the US and Canada. This analysis evaluates which operational model offers superior risk-adjusted returns for a diversified portfolio.
Table of contents
Companies Overview
Duke Energy and Exelon stand as key players in the regulated electric utility sector in the United States.
Duke Energy Corporation: Integrated Energy Leader
Duke Energy dominates with its diversified energy generation and distribution spanning electric and gas utilities in six states. Its core revenue stems from serving 8.2M electric customers and 1.6M gas clients. In 2026, Duke focuses strategically on expanding commercial renewables, operating 23 wind, 178 solar, and 2 battery storage facilities totaling 3,554 MW capacity.
Exelon Corporation: Comprehensive Utility Services Provider
Exelon operates as a utility services holding company with a strong presence in energy generation and delivery across the U.S. and Canada. It generates revenue through electricity and natural gas sales, leveraging nuclear, fossil, and renewable power assets. In 2026, Exelon prioritizes integrated energy solutions and customer-centric services, including extensive support functions like asset management and power procurement.
Strategic Collision: Similarities & Divergences
Both companies emphasize regulated electric utilities but diverge in scale and service breadth. Duke’s model integrates gas distribution and renewables, while Exelon blends generation with extensive utility service operations. Their primary battleground is the transition to clean energy and infrastructure modernization. Investors face distinct profiles: Duke offers scale and renewable growth; Exelon delivers diversified utility services and cross-border reach.
Income Statement Comparison
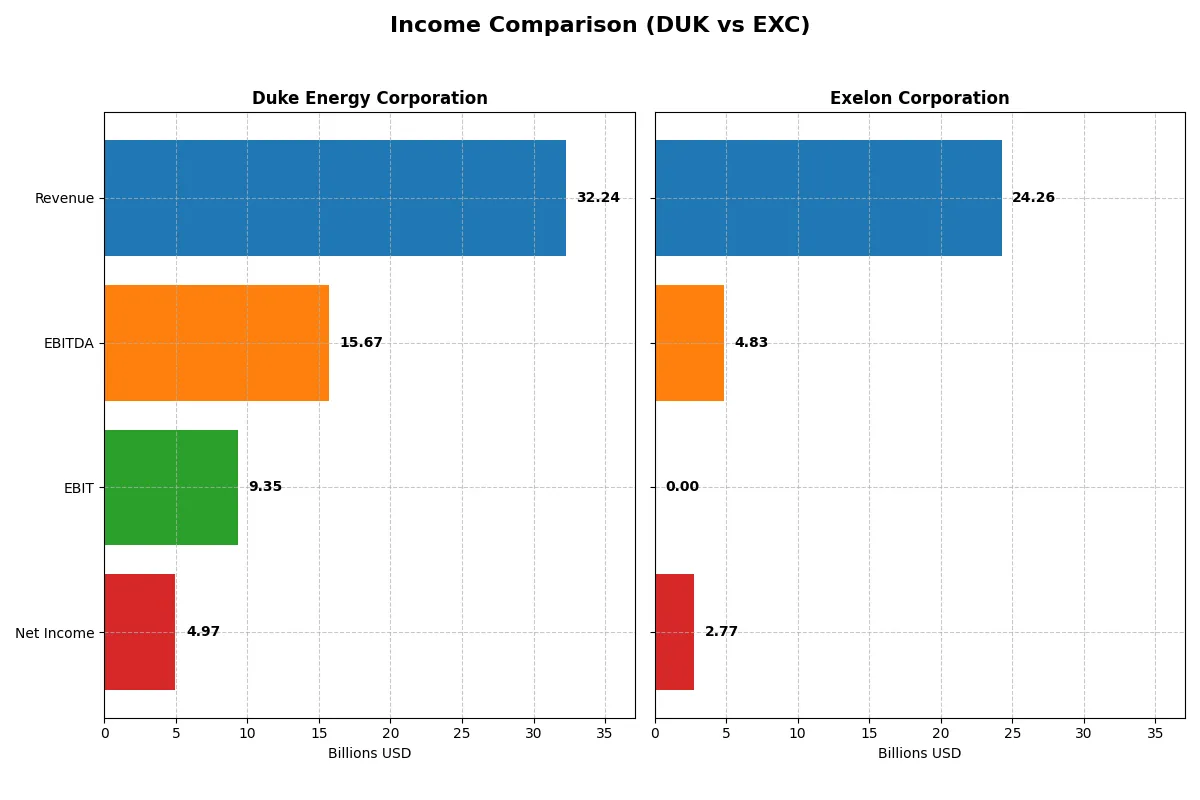
This data dissects the core profitability and scalability of both corporate engines to reveal who dominates the bottom line:
| Metric | Duke Energy Corporation (DUK) | Exelon Corporation (EXC) |
|---|---|---|
| Revenue | 32.2B | 24.3B |
| Cost of Revenue | 22.1B | 13.1B |
| Operating Expenses | 1.6B | 19.1B |
| Gross Profit | 10.2B | 11.1B |
| EBITDA | 15.7B | 4.8B |
| EBIT | 9.3B | 0 |
| Interest Expense | 3.6B | -2.1B |
| Net Income | 5.0B | 2.8B |
| EPS | 6.31 | 2.74 |
| Fiscal Year | 2025 | 2025 |
Income Statement Analysis: The Bottom-Line Duel
This income statement comparison exposes which company’s financial engine runs most efficiently through revenue growth and margin control.
Duke Energy Corporation Analysis
Duke Energy’s revenue rose steadily from 24.6B in 2021 to 32.2B in 2025, showing 31% growth over five years. Net income climbed from 3.8B to 4.9B, reflecting solid profit expansion. Gross margins remain healthy near 31.6%, while net margins improved to 15.4%. Despite rising interest expenses, Duke’s EBIT margin held favorable at 29%, signaling operational strength and margin resilience in 2025.
Exelon Corporation Analysis
Exelon’s revenue expanded from 17.9B in 2021 to 24.3B in 2025, a 35% increase. Net income surged more sharply, from 1.7B to 2.8B, supported by a robust gross margin of 45.9%. However, EBIT margin collapsed to zero in 2025, indicating operational challenges despite top-line strength. Net margin of 11.4% improved, reflecting some cost management, but rising operating expenses raise caution about sustainable profitability.
Margin Stability vs. Top-Line Growth
Duke Energy delivers consistent margin stability and steady net income growth, with strong operational efficiency. Exelon achieves higher revenue and net income growth but suffers from a deteriorating EBIT margin, signaling riskier profitability. Investors valuing margin discipline might prefer Duke’s profile, while those chasing growth face greater uncertainty with Exelon’s operational volatility.
Financial Ratios Comparison
These vital ratios act as a diagnostic tool to expose the underlying fiscal health, valuation premiums, and capital efficiency of the companies compared below:
| Ratios | Duke Energy Corporation (DUK) | Exelon Corporation (EXC) |
|---|---|---|
| ROE | 9.6% | 17.7% |
| ROIC | 4.1% | -53.8% |
| P/E | 18.3 | 15.9 |
| P/B | 1.76 | 2.82 |
| Current Ratio | 0.55 | 0.00 |
| Quick Ratio | 0.33 | 0.00 |
| D/E | 1.75 | 3.18 |
| Debt-to-Assets | 46.4% | 0.00 |
| Interest Coverage | 2.36 | -2.45 |
| Asset Turnover | 0.16 | 0.00 |
| Fixed Asset Turnover | 0.25 | 0.00 |
| Payout Ratio | 66.0% | 58.4% |
| Dividend Yield | 3.60% | 3.67% |
| Fiscal Year | 2025 | 2025 |
Efficiency & Valuation Duel: The Vital Signs
Financial ratios act as a company’s DNA, exposing hidden risks and revealing operational strengths crucial for investors’ decisions.
Duke Energy Corporation
Duke Energy posts a moderate ROE of 9.6% but lags in ROIC at 4.1%, signaling less efficient capital use. The stock trades at a neutral P/E of 18.3 and P/B of 1.76, suggesting fair valuation. Its 3.6% dividend yield supports shareholder returns amid limited reinvestment in R&D or growth.
Exelon Corporation
Exelon shows robust profitability with a 17.7% ROE but suffers a negative ROIC of -53.8%, highlighting capital allocation issues. The stock’s P/E of 15.9 and P/B of 2.82 remain neutral but reflect tempered growth expectations. A 3.7% dividend yield compensates investors despite weak liquidity and debt coverage ratios.
Balanced Profitability vs. Capital Efficiency
Exelon delivers stronger shareholder returns through higher ROE and dividends, but Duke maintains steadier capital efficiency and valuation metrics. Risk-averse investors may prefer Duke’s stable operational profile, while those seeking higher profitability might lean toward Exelon’s aggressive returns despite its capital challenges.
Which one offers the Superior Shareholder Reward?
I observe that Duke Energy (DUK) pays a higher dividend yield around 3.6% with a payout ratio near 66%, supported by strong FCF coverage. Its buyback program is moderate but consistent, enhancing total returns sustainably. Exelon (EXC) offers a similar yield near 3.7%, but with a lower payout ratio of about 58%, reflecting a more conservative distribution. EXC’s buyback activity is less pronounced, and its free cash flow remains negative, pressuring dividend sustainability. I favor Duke Energy for superior total shareholder reward in 2026 due to its robust dividend coverage and disciplined capital returns.
Comparative Score Analysis: The Strategic Profile
The radar chart reveals the fundamental DNA and trade-offs of Duke Energy Corporation and Exelon Corporation:
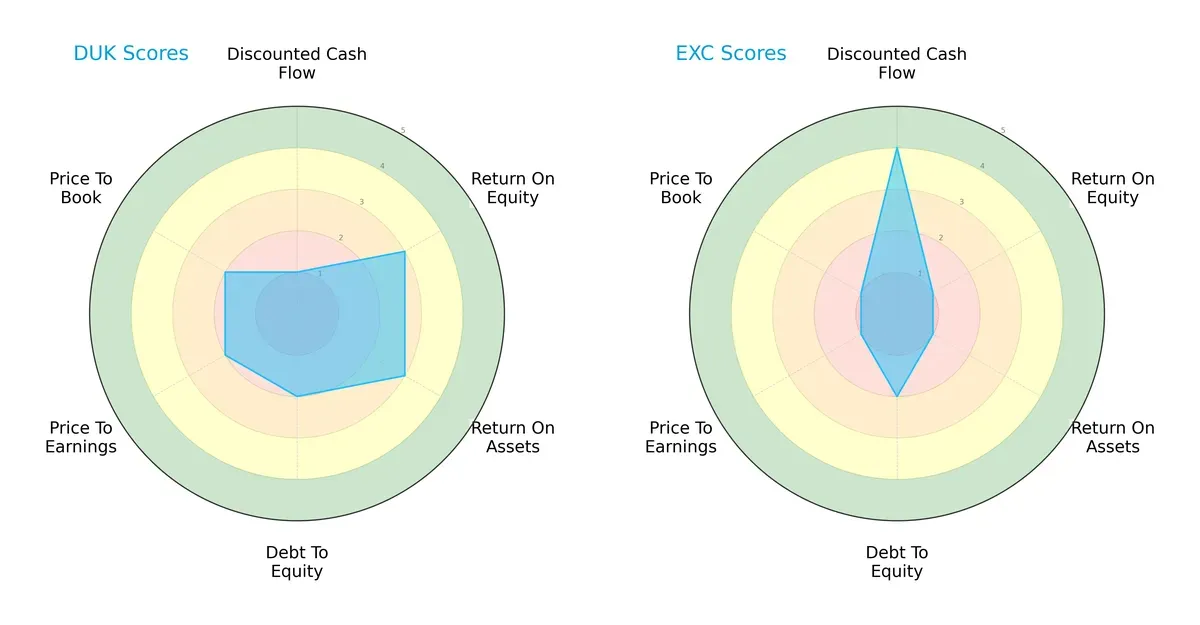
Duke shows moderate returns on equity and assets (ROE 3, ROA 3), while Exelon underperforms these metrics (ROE 1, ROA 1). Exelon excels in discounted cash flow valuation (DCF 4) compared to Duke’s low score (1). Both have unfavorable debt-to-equity and valuation scores, but Duke’s profile appears more balanced, relying less on a single strength. Exelon depends heavily on valuation metrics, reflecting potential risk if cash flow projections falter.
—
Financial Health: Quality of Operations
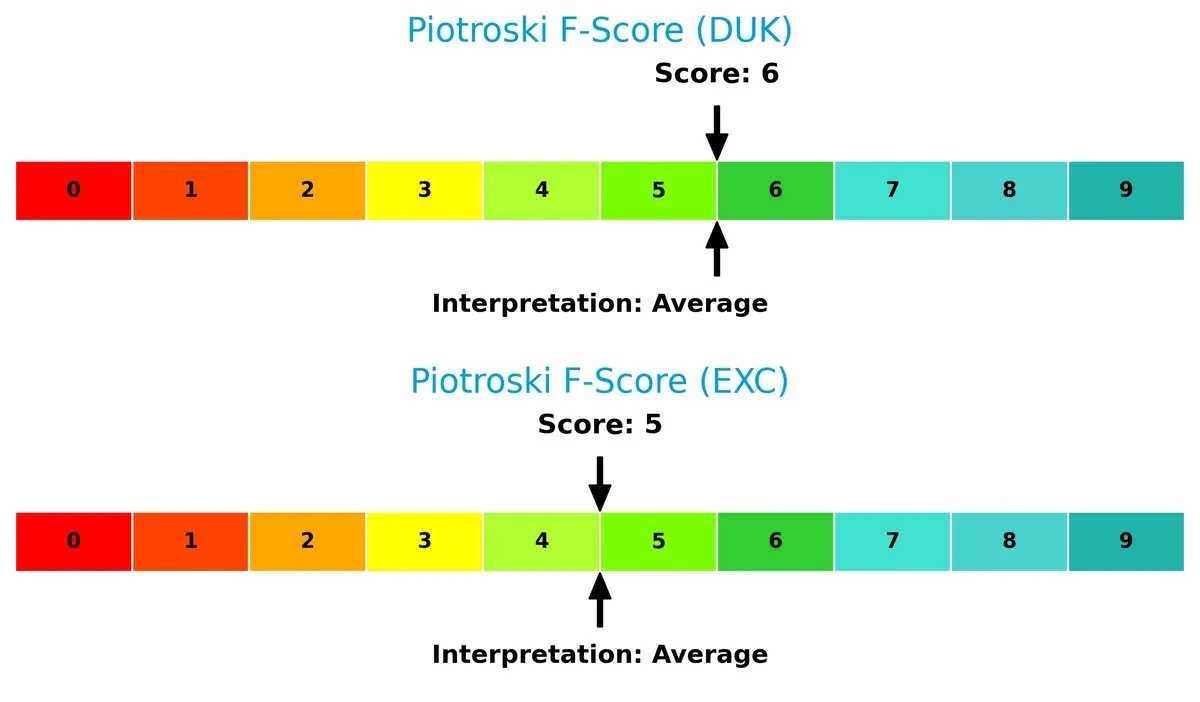
Duke scores slightly better with a Piotroski F-Score of 6 versus Exelon’s 5, indicating marginally stronger financial health and operational efficiency:
How are the two companies positioned?
This section dissects Duke and Exelon’s operational DNA by comparing revenue distribution and internal dynamics. The goal is to confront their economic moats to reveal the most resilient, sustainable advantage today.
Revenue Segmentation: The Strategic Mix
This visual comparison dissects how Duke Energy Corporation and Exelon Corporation diversify their income streams and where their primary sector bets lie:
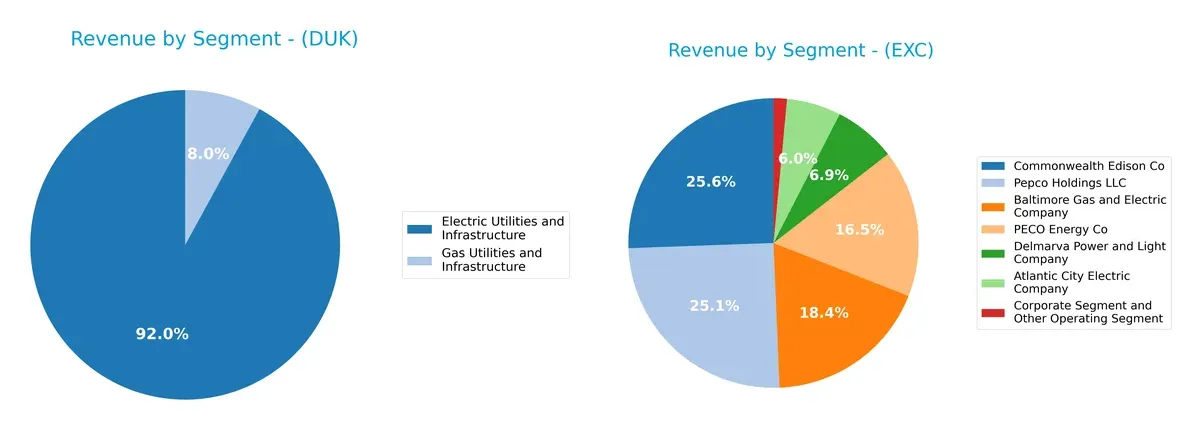
Duke Energy anchors its revenue in Electric Utilities and Infrastructure with $26.8B in 2024, plus a smaller $2.3B in Gas Utilities, showing moderate diversification. Exelon spreads revenue across multiple regulated utilities, with Pepco Holdings LLC ($7.1B) and Commonwealth Edison Co ($7.3B) as top contributors, creating a balanced portfolio. Duke’s focus signals infrastructure dominance but concentration risk. Exelon’s diversified utilities reduce exposure and enhance ecosystem lock-in.
Strengths and Weaknesses Comparison
This table compares the Strengths and Weaknesses of Duke Energy Corporation and Exelon Corporation:
Duke Energy Corporation Strengths
- Strong net margin at 15.41%
- Favorable WACC of 4.77% below ROIC
- Stable dividend yield at 3.6%
- Diverse revenue from electric, gas, and renewables
- Predominantly US-based with consistent market presence
Exelon Corporation Strengths
- High ROE at 17.74% indicates strong profitability
- Favorable net margin at 11.41%
- Favorable WACC at 4.47%
- Slightly higher dividend yield at 3.67%
- Broad utility footprint with multiple operating subsidiaries
Duke Energy Corporation Weaknesses
- Unfavorable ROE at 9.58% below sector average
- ROIC at 4.13% below WACC
- Weak liquidity ratios with current ratio at 0.55
- High debt-to-equity at 1.75 and low asset turnover
- Global ratios slightly unfavorable reflecting operational inefficiencies
Exelon Corporation Weaknesses
- Severely negative ROIC at -53.76% signals poor capital efficiency
- Current and quick ratios at 0 indicate liquidity concerns
- Elevated debt-to-equity at 3.18
- Negative interest coverage ratio poses credit risk
- Asset turnover effectively zero, showing underutilized assets
Duke Energy demonstrates solid profitability metrics but faces challenges in capital efficiency and liquidity. Exelon shows strong returns on equity yet suffers from critical issues in asset utilization and financial health. Both companies must carefully manage their capital structures and operational efficiencies to sustain competitive advantages.
The Moat Duel: Analyzing Competitive Defensibility
A structural moat is the only reliable shield protecting long-term profits from relentless competitive erosion. Let’s examine how Duke Energy and Exelon defend their turf:
Duke Energy Corporation: Regulated Utility with Scale and Infrastructure Moat
Duke’s moat stems from its vast regulated electric and gas infrastructure serving 8.2M customers across multiple states. This scale enables stable cash flows and margin resilience, reflected in a solid 29% ROIC growth despite currently shedding value versus WACC. Expansion in renewables and battery storage may deepen its moat in 2026.
Exelon Corporation: Diversified Generation with Nuclear and Renewables Moat
Exelon’s competitive advantage lies in its diversified generation portfolio, including nuclear and renewables, contrasting Duke’s infrastructure focus. However, Exelon’s ROIC sharply declines, signaling value destruction and weakening its moat. Regulatory shifts and clean energy demand offer upside, but operational challenges press on profitability.
Infrastructure Scale vs. Generation Diversity: Who Maintains the Stronger Moat?
Duke’s growing ROIC trend and stable regulated footprint give it a wider, more sustainable moat than Exelon’s faltering returns. I see Duke better positioned to defend market share amid evolving energy markets in 2026.
Which stock offers better returns?
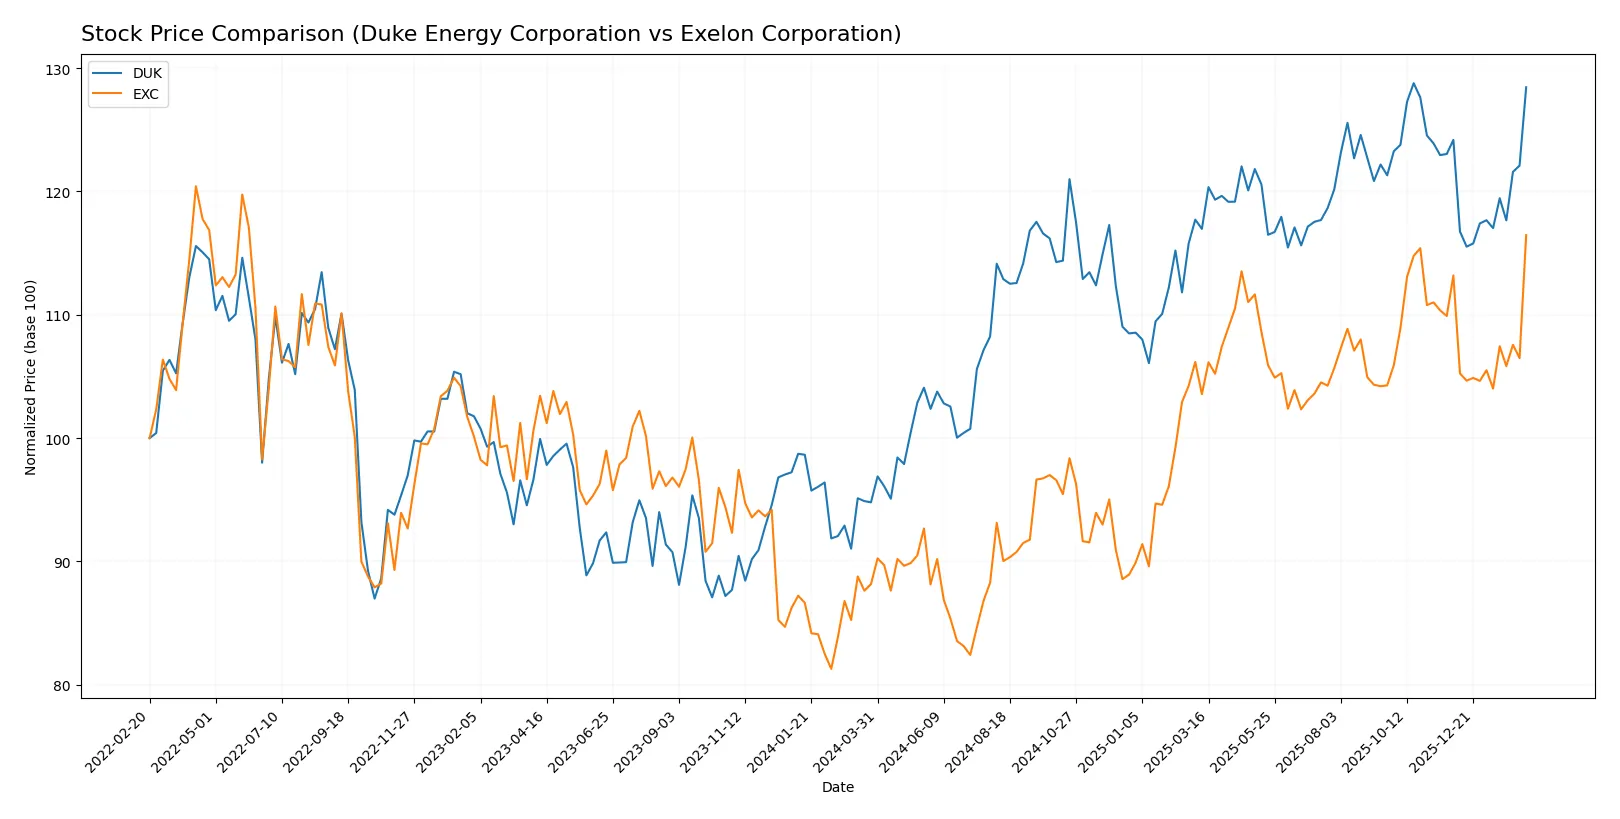
The stock price chart reveals strong bullish momentum for both Duke Energy Corporation and Exelon Corporation over the past 12 months, with notable acceleration in gains.
Trend Comparison
Duke Energy’s stock rose 35.5% over the past year, showing a bullish trend with accelerating momentum and higher volatility (8.1 std deviation). The price ranged from $94.61 to $128.53.
Exelon’s stock gained 32.1% over the same period, also bullish with acceleration but lower volatility (3.69 std deviation). Its price fluctuated between $34.31 and $48.48.
Duke Energy outperformed Exelon with a higher total return and stronger acceleration, despite greater volatility. Both show positive trajectories, but Duke leads on market performance.
Target Prices
Analysts present a clear target consensus for Duke Energy Corporation and Exelon Corporation.
| Company | Target Low | Target High | Consensus |
|---|---|---|---|
| Duke Energy Corporation | 115 | 143 | 132.64 |
| Exelon Corporation | 39 | 57 | 50.27 |
The consensus target for Duke Energy stands about 3.5% above its current price of 128.2, suggesting modest upside. Exelon’s target consensus is nearly 4% above its current price of 48.48, indicating moderate growth expectations.

Don’t Let Luck Decide Your Entry Point
Optimize your entry points with our advanced ProRealTime indicators. You’ll get efficient buy signals with precise price targets for maximum performance. Start outperforming now!
How do institutions grade them?
The following tables summarize recent institutional grades for Duke Energy Corporation and Exelon Corporation:
Duke Energy Corporation Grades
This table shows recent grades from major financial institutions for Duke Energy Corporation.
| Grading Company | Action | New Grade | Date |
|---|---|---|---|
| Wells Fargo | Maintain | Equal Weight | 2026-01-20 |
| Barclays | Maintain | Overweight | 2026-01-15 |
| UBS | Maintain | Neutral | 2025-12-17 |
| JP Morgan | Maintain | Neutral | 2025-12-11 |
| Mizuho | Maintain | Outperform | 2025-10-27 |
| Morgan Stanley | Maintain | Equal Weight | 2025-10-22 |
| Barclays | Maintain | Overweight | 2025-10-14 |
| BMO Capital | Maintain | Outperform | 2025-10-10 |
| UBS | Maintain | Neutral | 2025-10-10 |
| Scotiabank | Upgrade | Sector Outperform | 2025-10-03 |
Exelon Corporation Grades
This table shows recent grades from major financial institutions for Exelon Corporation.
| Grading Company | Action | New Grade | Date |
|---|---|---|---|
| Scotiabank | Maintain | Sector Perform | 2026-02-13 |
| BMO Capital | Maintain | Outperform | 2026-02-13 |
| Wells Fargo | Maintain | Overweight | 2026-02-13 |
| Mizuho | Maintain | Outperform | 2026-02-13 |
| Jefferies | Maintain | Buy | 2026-01-27 |
| Barclays | Maintain | Overweight | 2026-01-22 |
| Wells Fargo | Maintain | Overweight | 2026-01-20 |
| UBS | Maintain | Neutral | 2025-12-17 |
| JP Morgan | Maintain | Neutral | 2025-12-12 |
| Morgan Stanley | Maintain | Equal Weight | 2025-10-22 |
Which company has the best grades?
Exelon Corporation generally receives stronger grades, including multiple “Outperform” and “Buy” ratings. Duke Energy mostly holds “Neutral” to “Overweight” ratings. This difference may influence investor perception of growth potential and risk.
Risks specific to each company
The following categories identify the critical pressure points and systemic threats facing both firms in the 2026 market environment:
1. Market & Competition
Duke Energy Corporation
- Large regulated utility with stable customer base; faces competition from renewables and deregulation risks.
Exelon Corporation
- Diversified generation mix; exposure to wholesale market volatility and competition from alternative energy providers.
2. Capital Structure & Debt
Duke Energy Corporation
- High debt-to-equity ratio (1.75) and moderate interest coverage (2.57) signal leverage risks.
Exelon Corporation
- Very high debt-to-equity ratio (3.18) with negative interest coverage raises financial distress concerns.
3. Stock Volatility
Duke Energy Corporation
- Beta of 0.51 indicates low stock volatility, reflecting defensive utility status.
Exelon Corporation
- Even lower beta at 0.44 suggests relatively stable stock but increased operational risks may offset this.
4. Regulatory & Legal
Duke Energy Corporation
- Operates in multiple states under regulated tariffs; regulatory changes could impact revenue stability.
Exelon Corporation
- Faces complex regulatory environment in US and Canada; nuclear operations increase legal and compliance risks.
5. Supply Chain & Operations
Duke Energy Corporation
- Diverse fuel mix including coal, gas, renewables; supply disruptions and fuel price volatility are risks.
Exelon Corporation
- Heavy reliance on nuclear and fossil fuels; operational outages and maintenance cost overruns are concerns.
6. ESG & Climate Transition
Duke Energy Corporation
- Invests in renewables and storage but coal exposure challenges carbon reduction goals.
Exelon Corporation
- Strong nuclear portfolio supports low-carbon goals but faces public and policy acceptance risks.
7. Geopolitical Exposure
Duke Energy Corporation
- Primarily US-focused with limited geopolitical risk.
Exelon Corporation
- US and Canadian operations introduce cross-border regulatory and political risks.
Which company shows a better risk-adjusted profile?
Duke Energy’s highest risk is its leveraged capital structure combined with weak liquidity ratios. Exelon’s greatest threat is severe financial distress signals, notably negative interest coverage and very high debt. Despite this, Exelon’s more favorable discounted cash flow score and diversified generation mix suggest a marginally better risk-adjusted profile. However, both face significant financial and operational headwinds that demand cautious monitoring.
Final Verdict: Which stock to choose?
Duke Energy’s superpower lies in its steady cash generation and improving profitability, despite being weighed down by a stretched balance sheet. Its slightly unfavorable moat signals caution but growing ROIC suggests potential value creation ahead. This stock fits an income-focused portfolio willing to tolerate moderate leverage risk.
Exelon commands a strategic moat through its strong net margin and robust equity returns, reflecting operational efficiency and growth. Yet, its declining ROIC and financial distress indicators present clear vulnerabilities. Relative to Duke, Exelon offers higher growth potential but with greater financial instability, suiting growth-at-a-reasonable-price (GARP) investors with a higher risk appetite.
If you prioritize steady income and improving profitability, Duke Energy is the compelling choice due to its resilience and growing efficiency. However, if you seek growth potential coupled with operational strength, Exelon offers superior margin expansion but commands a premium in risk. Both stocks require vigilant risk management given their financial challenges.
Disclaimer: Investment carries a risk of loss of initial capital. The past performance is not a reliable indicator of future results. Be sure to understand risks before making an investment decision.
Go Further
I encourage you to read the complete analyses of Duke Energy Corporation and Exelon Corporation to enhance your investment decisions: