In the evolving landscape of regulated electric utilities, Duke Energy Corporation and Eversource Energy stand out as key players shaping the future of energy delivery. Both companies operate within overlapping markets in the U.S., focusing on electric and natural gas distribution while advancing renewable energy integration. This comparison highlights their strategic approaches and market positions, guiding investors to identify which company holds the most promising potential for their portfolio.
Table of contents
Companies Overview
I will begin the comparison between Duke Energy Corporation and Eversource Energy by providing an overview of these two companies and their main differences.
Duke Energy Corporation Overview
Duke Energy operates as a leading energy company in the US, focusing on electric utilities, gas utilities, and commercial renewables. It serves about 8.2M customers across six states in the Southeast and Midwest, managing a diverse generation portfolio including coal, nuclear, natural gas, and renewables. With a market cap near $91B, Duke emphasizes infrastructure and renewable energy development, owning over 50,000 MW of generation capacity.
Eversource Energy Overview
Eversource Energy is a public utility holding company that delivers electricity, natural gas, and water services primarily in Connecticut, Massachusetts, and New Hampshire. It serves residential, commercial, and municipal customers, with regulated electric and water distribution segments. The company has around 10,000 employees and a market cap of approximately $25B, focusing on energy delivery and solar power facilities in the Northeast region.
Key similarities and differences
Both Duke and Eversource operate in the regulated electric utilities sector, providing electricity and natural gas distribution to residential and commercial customers. Duke has a broader geographic footprint and a larger market cap, with significant involvement in renewable generation and infrastructure. Eversource, while smaller, uniquely includes water distribution in its business model and concentrates on the Northeast US, reflecting regional specialization versus Duke’s diversified energy sources and wider operational scale.
Income Statement Comparison
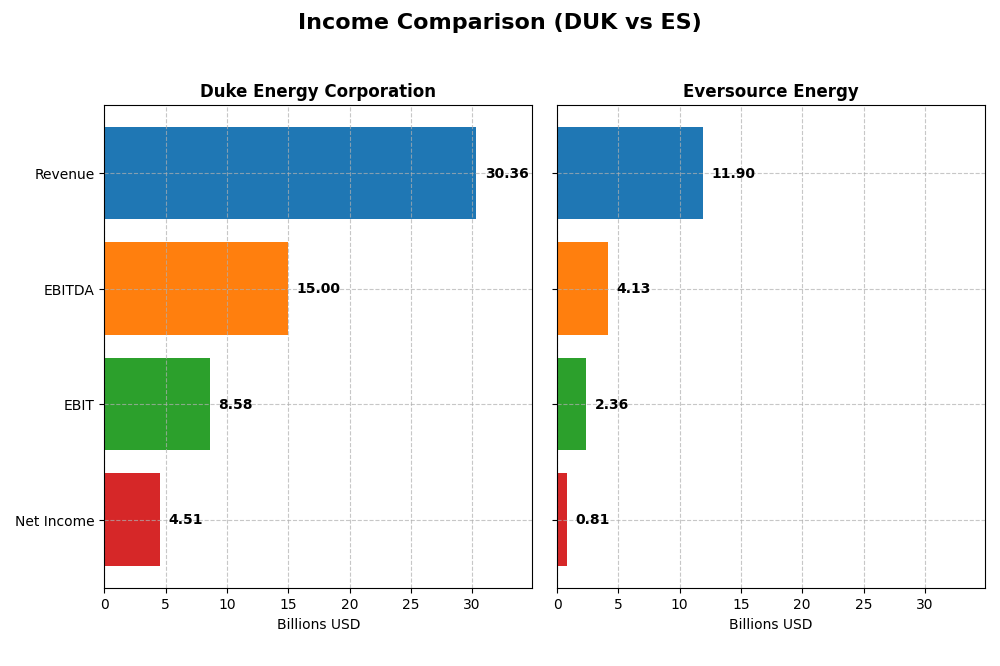
This table presents a side-by-side comparison of key income statement metrics for Duke Energy Corporation and Eversource Energy for the fiscal year 2024.
| Metric | Duke Energy Corporation | Eversource Energy |
|---|---|---|
| Market Cap | 90.8B | 24.9B |
| Revenue | 30.4B | 11.9B |
| EBITDA | 15.0B | 4.1B |
| EBIT | 8.6B | 2.4B |
| Net Income | 4.5B | 812M |
| EPS | 5.71 | 2.27 |
| Fiscal Year | 2024 | 2024 |
Income Statement Interpretations
Duke Energy Corporation
Duke Energy’s revenue and net income have shown consistent growth from 2020 to 2024, with revenue rising nearly 30% and net income more than doubling. Margins have generally improved, with a strong gross margin of 50.06% and an EBIT margin of 28.26%. In 2024, revenue growth was moderate at 4.46%, but gross profit and EBIT expanded favorably, signaling strengthening profitability despite a slight increase in operating expenses relative to revenue.
Eversource Energy
Eversource Energy’s revenue experienced a slight decline in 2024 by 0.08%, yet the company’s EBIT and net margin showed significant improvement, with EBIT growth exceeding 300%. Gross margin remains steady at 31.12%, but net income has fallen over the longer term, with a 32.65% decline since 2020. The net margin and EPS growth in the most recent year reflect a recovery, although overall profitability has faced challenges across the period.
Which one has the stronger fundamentals?
Duke Energy demonstrates stronger fundamentals with consistent revenue and net income growth, favorable margin expansions, and a robust overall income statement evaluation. Eversource Energy shows recent improvement in profitability measures but struggles with long-term net income decline and margin contraction. Duke’s balance of steady growth and margin strength positions it with a more favorable fundamental profile based on the data.
Financial Ratios Comparison
The table below presents a side-by-side comparison of key financial ratios for Duke Energy Corporation (DUK) and Eversource Energy (ES) based on their most recent fiscal year data from 2024.
| Ratios | Duke Energy Corporation (DUK) | Eversource Energy (ES) |
|---|---|---|
| ROE | 8.99% | 5.40% |
| ROIC | 4.02% | 3.18% |
| P/E | 18.44 | 25.29 |
| P/B | 1.66 | 1.37 |
| Current Ratio | 0.67 | 0.76 |
| Quick Ratio | 0.44 | 0.67 |
| D/E (Debt to Equity) | 1.70 | 1.94 |
| Debt-to-Assets | 45.7% | 48.9% |
| Interest Coverage | 2.34 | 2.43 |
| Asset Turnover | 0.16 | 0.20 |
| Fixed Asset Turnover | 0.24 | 0.29 |
| Payout Ratio | 71.2% | 124.3% |
| Dividend Yield | 3.86% | 4.91% |
Interpretation of the Ratios
Duke Energy Corporation
Duke Energy shows a mixed ratio profile with a strong net margin of 14.86% and a favorable dividend yield of 3.86%, but faces challenges with low liquidity (current ratio 0.67) and high leverage (debt-to-equity 1.7). Its return on equity (9.0%) and return on invested capital (4.02%) are unfavorable, indicating moderate profitability concerns. Duke Energy pays dividends supported by a stable payout and coverage, but risks include potential strain from its leverage and liquidity.
Eversource Energy
Eversource Energy displays a neutral net margin of 6.82% and a favorable price-to-book ratio of 1.37, though it struggles with a higher debt-to-equity ratio of 1.94 and weak liquidity ratios (current ratio 0.76). Return on equity at 5.4% and return on invested capital at 3.18% are unfavorable, reflecting profitability constraints. The company offers a higher dividend yield of 4.91%, with dividend payments sustained despite some pressure from leverage and cash flow metrics.
Which one has the best ratios?
Both companies show more unfavorable than favorable ratios, with Duke Energy slightly better positioned due to a stronger net margin and better returns relative to its weighted average cost of capital. However, Eversource Energy’s higher dividend yield and price-to-book ratio provide some strengths despite its higher leverage and weaker profitability ratios. Overall, Duke Energy’s ratios are slightly less unfavorable compared to Eversource Energy’s.
Strategic Positioning
This section compares the strategic positioning of Duke Energy Corporation and Eversource Energy, focusing on Market position, Key segments, and exposure to disruption:
Duke Energy Corporation
- Large market cap of 90.8B, operating in Southeast and Midwest with significant scale and competitive presence.
- Diversified segments: Electric Utilities, Gas Utilities, and Commercial Renewables driving revenue.
- Invests in multiple renewable sources including wind, solar, and battery storage across 22 states.
Eversource Energy
- Smaller market cap of 24.9B, focused on Northeast US markets, facing regional competitive pressures.
- Concentrated on Electric Distribution, Transmission, Natural Gas, and Water Distribution segments.
- Engaged in solar power facilities but with less emphasis on renewables compared to Duke.
Duke Energy Corporation vs Eversource Energy Positioning
Duke Energy pursues a diversified business model across electricity, gas, and renewables with a broad geographic footprint. Eversource focuses on regulated electric, gas, and water distribution primarily in the Northeast, representing a more concentrated strategy with regional specialization.
Which has the best competitive advantage?
Both companies are shedding value with ROIC below WACC; however, Duke shows a growing ROIC trend, indicating improving profitability, while Eversource’s declining ROIC suggests weakening competitive advantage.
Stock Comparison
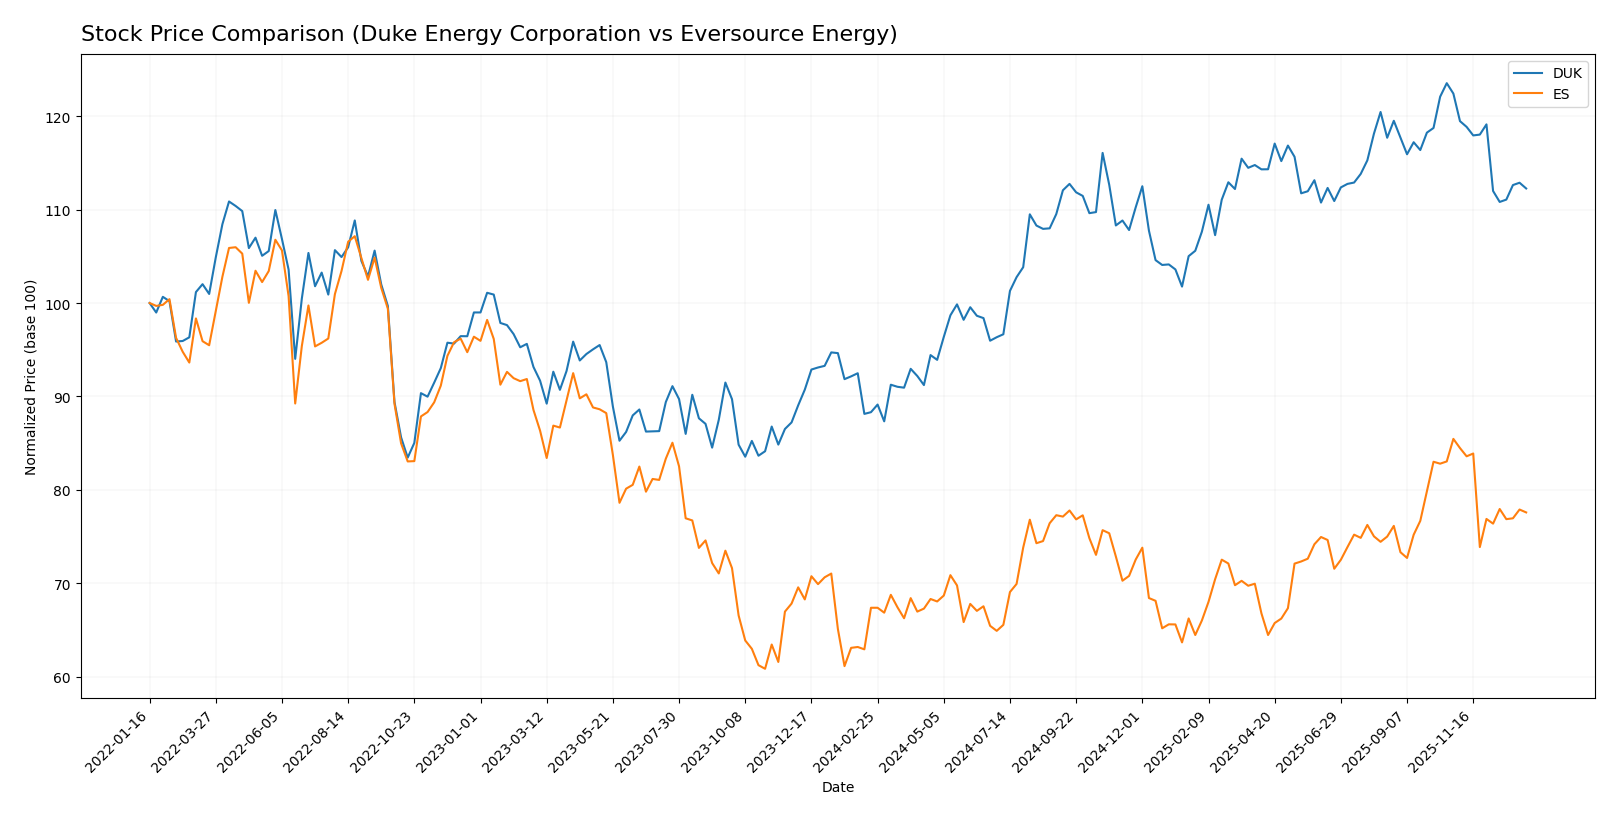
The stock prices of Duke Energy Corporation (DUK) and Eversource Energy (ES) exhibited notable bullish trends over the past 12 months, with both showing decelerating growth and recent downward momentum in trading dynamics.
Trend Analysis
Duke Energy Corporation’s stock showed a 27.12% increase over the past year, indicating a bullish trend with decelerating momentum. The price ranged between 90.86 and 128.53, with recent months showing an 8.3% decline.
Eversource Energy’s stock increased by 15.15% over the same period, also reflecting a bullish but decelerating trend. Prices fluctuated between 55.63 and 74.67, with a recent 9.21% drop in the last few months.
Comparing both, Duke Energy delivered the highest market performance with a stronger overall price increase, despite recent downward trends affecting both stocks similarly.
Target Prices
The current analyst consensus provides a clear target range for both Duke Energy Corporation and Eversource Energy.
| Company | Target High | Target Low | Consensus |
|---|---|---|---|
| Duke Energy Corporation | 150 | 126 | 135.91 |
| Eversource Energy | 81 | 60 | 68 |
Analysts expect Duke Energy’s stock to appreciate from the current price of $116.8 toward the $135.91 consensus, while Eversource Energy’s current price of $67.79 aligns closely with its $68 target consensus.
Analyst Opinions Comparison
This section compares analysts’ ratings and financial grades for Duke Energy Corporation and Eversource Energy:
Rating Comparison
Duke Energy Corporation Rating
- Rating: C+, considered Very Favorable by analysts.
- Discounted Cash Flow Score: 1, rated Very Unfavorable, indicating potential overvaluation risk.
- ROE Score: 3, Moderate status, showing decent profit generation efficiency.
- ROA Score: 3, Moderate rating, reflecting effective asset utilization.
- Debt To Equity Score: 2, Moderate level of financial risk.
- Overall Score: 2, Moderate overall financial standing.
Eversource Energy Rating
- Rating: C+, also considered Very Favorable by analysts.
- Discounted Cash Flow Score: 1, rated Very Unfavorable, indicating potential overvaluation risk.
- ROE Score: 3, Moderate status, indicating similar profit efficiency.
- ROA Score: 3, Moderate rating, similarly reflecting efficient asset use.
- Debt To Equity Score: 1, Very Unfavorable, indicating higher financial risk.
- Overall Score: 2, Moderate overall financial standing.
Which one is the best rated?
Both Duke Energy and Eversource Energy share the same overall rating of C+ and identical scores for discounted cash flow, ROE, ROA, and overall financial standing. Duke Energy has a stronger debt-to-equity score, suggesting a more favorable financial risk profile compared to Eversource.
Scores Comparison
Here is a comparison of the Altman Z-Score and Piotroski Score for Duke Energy Corporation and Eversource Energy:
Duke Energy Corporation Scores
- Altman Z-Score: 0.71, in distress zone indicating high bankruptcy risk.
- Piotroski Score: 6, assessed as average financial strength.
Eversource Energy Scores
- Altman Z-Score: 0.75, also in distress zone signaling similar bankruptcy risk.
- Piotroski Score: 6, likewise indicating average financial strength.
Which company has the best scores?
Both Duke Energy and Eversource Energy show Altman Z-Scores in the distress zone, implying elevated bankruptcy risk. Their Piotroski Scores are equal at 6, reflecting average financial health with no clear advantage for either company based on these metrics.
Grades Comparison
The following presents the most recent reliable grades for Duke Energy Corporation and Eversource Energy:
Duke Energy Corporation Grades
This table summarizes recent grades and actions from reputable financial institutions for Duke Energy Corporation.
| Grading Company | Action | New Grade | Date |
|---|---|---|---|
| UBS | Maintain | Neutral | 2025-12-17 |
| JP Morgan | Maintain | Neutral | 2025-12-11 |
| Mizuho | Maintain | Outperform | 2025-10-27 |
| Morgan Stanley | Maintain | Equal Weight | 2025-10-22 |
| Barclays | Maintain | Overweight | 2025-10-14 |
| UBS | Maintain | Neutral | 2025-10-10 |
| BMO Capital | Maintain | Outperform | 2025-10-10 |
| Scotiabank | Upgrade | Sector Outperform | 2025-10-03 |
| Jefferies | Downgrade | Hold | 2025-09-26 |
| Morgan Stanley | Maintain | Equal Weight | 2025-09-25 |
Overall, Duke Energy’s grades show a generally stable to positive trend, with multiple “Outperform” and “Overweight” ratings balanced by some “Neutral” and “Hold” opinions.
Eversource Energy Grades
This table presents recent grades and actions from established grading firms for Eversource Energy.
| Grading Company | Action | New Grade | Date |
|---|---|---|---|
| UBS | Maintain | Neutral | 2025-12-17 |
| JP Morgan | Maintain | Underweight | 2025-12-12 |
| Janney Montgomery Scott | Upgrade | Buy | 2025-11-24 |
| Scotiabank | Maintain | Sector Underperform | 2025-11-20 |
| Mizuho | Downgrade | Neutral | 2025-11-20 |
| Wells Fargo | Downgrade | Equal Weight | 2025-11-20 |
| UBS | Downgrade | Neutral | 2025-11-06 |
| BMO Capital | Maintain | Market Perform | 2025-11-06 |
| Scotiabank | Maintain | Sector Underperform | 2025-11-06 |
| Mizuho | Maintain | Outperform | 2025-10-27 |
Eversource Energy’s grades reflect more mixed signals, with several downgrades and underweight ratings, offset by some hold and outperform grades.
Which company has the best grades?
Duke Energy generally holds stronger and more consistent grades, including several “Outperform” and “Overweight” ratings, whereas Eversource Energy exhibits more downgrades and underweight opinions. Investors might interpret Duke Energy’s steadier grades as a sign of relative stability in analyst sentiment compared to Eversource.
Strengths and Weaknesses
Below is a comparative overview of Duke Energy Corporation (DUK) and Eversource Energy (ES) based on key criteria.
| Criterion | Duke Energy Corporation (DUK) | Eversource Energy (ES) |
|---|---|---|
| Diversification | Strong in Electric Utilities (26.8B USD) and Gas Utilities (2.3B USD) with additional renewables exposure | Focused on Electric Distribution (9.1B USD) and Transmission, Natural Gas Distribution, and Water segments |
| Profitability | Net margin 14.86% (favorable); ROIC 4.02% (unfavorable); ROE 9.0% (unfavorable) | Net margin 6.82% (neutral); ROIC 3.18% (unfavorable); ROE 5.4% (unfavorable) |
| Innovation | Moderate investment in Commercial Renewables (~484M USD) | Limited visible innovation investments; stable core utility operations |
| Global presence | Primarily U.S.-focused, strong regulated utilities base | U.S. regional utility with no significant international presence |
| Market Share | Large scale in electric utilities with infrastructure dominance | Smaller scale but solid regional market share in New England |
Key takeaways: Duke Energy leads in scale and diversification with growing profitability despite value destruction signals, while Eversource shows weaker profitability and declining returns with a more concentrated regional focus. Both companies face challenges in operational efficiency and capital use but maintain stable dividend yields.
Risk Analysis
The table below compares key risks for Duke Energy Corporation and Eversource Energy in 2026, highlighting financial and operational vulnerabilities.
| Metric | Duke Energy Corporation (DUK) | Eversource Energy (ES) |
|---|---|---|
| Market Risk | Low beta (0.49) limits volatility | Moderate beta (0.77) implies higher market sensitivity |
| Debt level | High debt-to-equity (1.7), moderate risk | Higher debt-to-equity (1.94), elevated risk |
| Regulatory Risk | Significant due to regulated utilities | Significant in Northeast states regulatory environment |
| Operational Risk | Exposure to diverse energy sources, infrastructure complexity | Focus on electric, gas, and water distribution, moderate complexity |
| Environmental Risk | Coal and nuclear generation pose transition risks | Renewable investments growing but legacy fossil assets remain |
| Geopolitical Risk | Limited, primarily US-focused | Limited, primarily US-focused |
Duke Energy and Eversource both face elevated financial leverage and regulatory risks given their utility sector exposure. Their Altman Z-Scores indicate distress zones, signaling heightened bankruptcy risk. Market volatility is less for Duke due to lower beta but both require caution due to operational and environmental transition challenges. Debt management and regulatory compliance remain critical for investment risk control.
Which Stock to Choose?
Duke Energy Corporation shows favorable income growth with a 29.92% revenue increase overall and strong profitability metrics, including a 14.86% net margin. However, its financial ratios reveal a slightly unfavorable profile due to high debt levels and weak liquidity, despite a stable rating of C+.
Eversource Energy’s income profile is mixed, with a 33.65% revenue growth but declining net income and margin over the period. Financial ratios are generally unfavorable, reflecting higher leverage and weaker profitability, though the company maintains a similar C+ rating as Duke Energy.
For risk-averse investors prioritizing stable income and stronger profitability, Duke Energy’s favorable income statement and slightly better moat trend might appear more appealing. Conversely, investors tolerant of higher risk and seeking growth could see potential in Eversource’s recent income improvements despite its weaker financial ratios and declining moat.
Disclaimer: Investment carries a risk of loss of initial capital. The past performance is not a reliable indicator of future results. Be sure to understand risks before making an investment decision.
Go Further
I encourage you to read the complete analyses of Duke Energy Corporation and Eversource Energy to enhance your investment decisions: