Investors seeking stable opportunities in the regulated electric utility sector often consider Duke Energy Corporation (DUK) and Evergy, Inc. (EVRG). Both companies operate in overlapping U.S. markets, delivering electricity through diverse generation sources while embracing renewable energy innovations. Duke, with its extensive infrastructure, contrasts with Evergy’s regional focus and growth potential. In this article, I will analyze their strengths to help you decide which stock best fits your portfolio.
Table of contents
Companies Overview
I will begin the comparison between Duke Energy Corporation and Evergy, Inc. by providing an overview of these two companies and their main differences.
Duke Energy Corporation Overview
Duke Energy Corporation operates as a major energy company in the US, serving about 8.2M customers across six states primarily in the Southeast and Midwest. It operates through three segments: Electric Utilities and Infrastructure, Gas Utilities and Infrastructure, and Commercial Renewables. Its electricity generation capacity is approximately 50,259 MW, utilizing diverse sources including coal, nuclear, natural gas, and renewables. Headquartered in Charlotte, NC, it has a market cap of around 90.8B USD.
Evergy, Inc. Overview
Evergy, Inc. is a regulated electric utility company focused on electricity generation, transmission, and distribution in Kansas and Missouri. It serves roughly 1.6M customers with a network comprising over 62,000 circuit miles of transmission and distribution lines. Evergy generates electricity from coal, natural gas, nuclear, hydroelectric, and renewable sources. Founded in 2017 and based in Kansas City, MO, Evergy has a market capitalization near 16.8B USD.
Key similarities and differences
Both companies operate in the regulated electric utility industry in the US, providing electricity generation and distribution services. However, Duke Energy has a significantly larger customer base and generation capacity, and a more diversified energy portfolio including a substantial commercial renewables segment. Evergy focuses primarily on Kansas and Missouri with a smaller scale and emphasizes transmission and distribution infrastructure. Their market caps and employee counts reflect these operational scale differences.
Income Statement Comparison
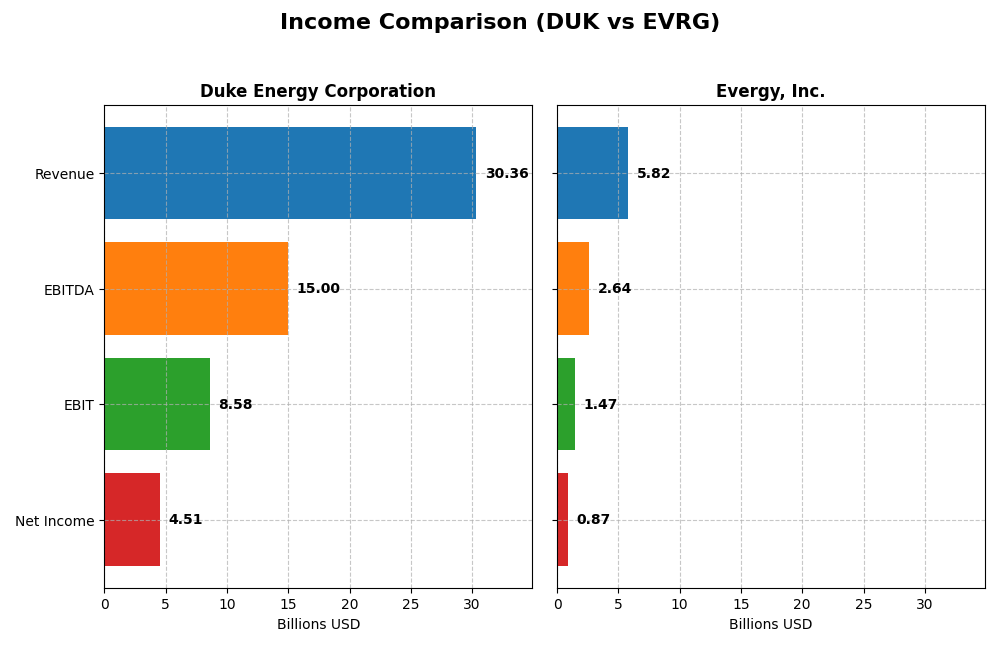
This table presents the key income statement metrics for Duke Energy Corporation and Evergy, Inc. for the fiscal year 2024, allowing a straightforward financial comparison.
| Metric | Duke Energy Corporation (DUK) | Evergy, Inc. (EVRG) |
|---|---|---|
| Market Cap | 90.8B | 16.8B |
| Revenue | 30.4B | 5.8B |
| EBITDA | 15.0B | 2.6B |
| EBIT | 8.6B | 1.5B |
| Net Income | 4.5B | 0.87B |
| EPS | 5.71 | 3.79 |
| Fiscal Year | 2024 | 2024 |
Income Statement Interpretations
Duke Energy Corporation
Duke Energy’s revenue grew steadily from 2020 to 2024, reaching $30.4B in 2024, with net income surging by over 227% across the period. Gross and EBIT margins remained strong, around 50% and 28%, respectively, reflecting operational efficiency. The latest year showed moderate revenue growth of 4.5%, with net margin stable at 14.9% and EPS up 5.2%, indicating consistent profitability improvements.
Evergy, Inc.
Evergy’s revenue increased moderately by 18.5% from 2020 to 2024, hitting $5.8B in 2024. Net income rose by 41%, supported by a favorable gross margin of 32.6% and an EBIT margin of 25.3%. The 2024 fiscal year saw a 6.2% revenue rise and a 12.5% improvement in net margin, while EPS grew nearly 20%, signaling enhanced earnings efficiency and margin expansion.
Which one has the stronger fundamentals?
Both Duke Energy and Evergy exhibit favorable income statement profiles with solid margin performance and growth. Duke shows higher absolute revenue and profit growth, with superior gross and EBIT margins, though it faces slightly higher interest expenses. Evergy demonstrates robust margin improvements and EPS growth but on a smaller scale. Overall, Duke leads in scale and consistent profitability gains, while Evergy excels in margin expansion and EPS growth rates.
Financial Ratios Comparison
The table below presents the most recent financial ratios for Duke Energy Corporation and Evergy, Inc., reflecting their fiscal year 2024 performance to facilitate a clear comparison.
| Ratios | Duke Energy Corporation (DUK) | Evergy, Inc. (EVRG) |
|---|---|---|
| ROE | 8.997% | 8.774% |
| ROIC | 4.017% | 4.524% |
| P/E | 18.44 | 16.23 |
| P/B | 1.66 | 1.42 |
| Current Ratio | 0.67 | 0.50 |
| Quick Ratio | 0.44 | 0.27 |
| D/E (Debt to Equity) | 1.70 | 1.41 |
| Debt-to-Assets | 45.7% | 43.6% |
| Interest Coverage | 2.34 | 2.57 |
| Asset Turnover | 0.163 | 0.180 |
| Fixed Asset Turnover | 0.244 | 0.234 |
| Payout ratio | 71.2% | 68.3% |
| Dividend yield | 3.86% | 4.21% |
Interpretation of the Ratios
Duke Energy Corporation
Duke Energy shows a mixed ratio profile with strong net margin (14.86%, favorable) and dividend yield (3.86%, favorable), but weak return on equity (9.0%) and return on invested capital (4.02%). Liquidity ratios like current ratio (0.67) and quick ratio (0.44) are below 1, indicating potential short-term pressure. The company pays dividends with a stable yield supported by free cash flow, but coverage risks exist given some unfavorable operating metrics.
Evergy, Inc.
Evergy displays favorable net margin (15.0%) and price-to-book ratio (1.42), alongside a higher dividend yield of 4.21%. However, return on equity (8.77%) and return on invested capital (4.52%) are weak. Liquidity remains tight with a current ratio of 0.5 and quick ratio of 0.27. Despite paying dividends, the firm faces challenges in asset turnover and debt management, reflecting some operational inefficiencies.
Which one has the best ratios?
Both Duke Energy and Evergy have slightly unfavorable global ratio evaluations due to liquidity and efficiency concerns. Evergy scores better on dividend yield and price-to-book ratio, while Duke Energy offers a stronger net margin. Neither company dominates clearly, as both present a balance of favorable and unfavorable metrics in their financial profiles.
Strategic Positioning
This section compares the strategic positioning of Duke Energy Corporation and Evergy, Inc. in terms of market position, key segments, and exposure to technological disruption:
Duke Energy Corporation
- Large market cap of 90.8B; operates in multiple U.S. states with diverse competition.
- Diversified segments: Electric Utilities, Gas Utilities, and Commercial Renewables.
- Invests in renewables including wind, solar, and battery storage; uses multiple energy sources.
Evergy, Inc.
- Smaller market cap of 16.8B; focused on Kansas and Missouri markets.
- Concentrated in Electric Utilities segment serving residential and commercial customers.
- Uses coal, hydro, landfill gas, uranium, natural gas, and renewables, with no noted storage.
Duke Energy Corporation vs Evergy, Inc. Positioning
Duke Energy has a diversified business model across electric, gas, and renewable segments with a broad geographic footprint, while Evergy focuses on a concentrated electric utility market in two states. Duke’s scale offers wider revenue streams, whereas Evergy’s focused approach targets a specific regional market.
Which has the best competitive advantage?
Both companies are currently shedding value with ROIC below WACC but show growing profitability trends. Their economic moats are rated slightly unfavorable, indicating limited sustainable competitive advantage based on current capital efficiency.
Stock Comparison
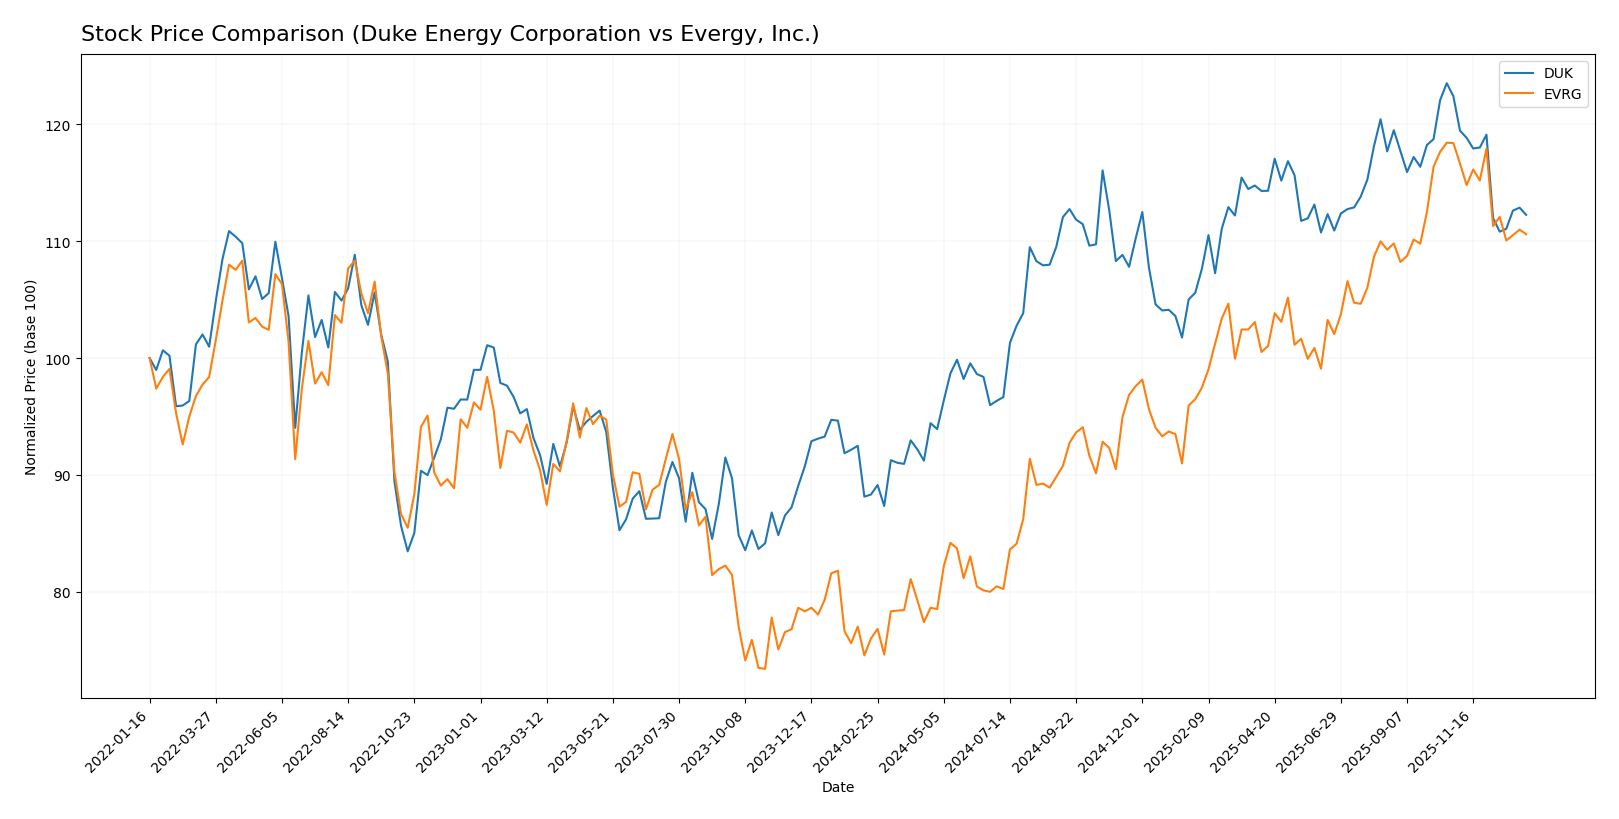
The past year has seen Duke Energy Corporation and Evergy, Inc. both experience significant bullish trends with notable price appreciations, although recent months indicate a deceleration and seller dominance in trading volume.
Trend Analysis
Duke Energy Corporation’s stock showed a strong bullish trend with a 27.12% price increase over the past 12 months, despite a recent 8.3% decline indicating deceleration and increased volatility.
Evergy, Inc. exhibited a more pronounced bullish trend, gaining 45.55% over the year, but also faced a recent 6.59% drop with decelerating momentum and lower volatility compared to Duke Energy.
Comparing both, Evergy delivered the highest market performance over the past year, with a larger overall price increase despite similar recent downward corrections.
Target Prices
The current analyst consensus presents a positive outlook for both Duke Energy Corporation and Evergy, Inc.
| Company | Target High | Target Low | Consensus |
|---|---|---|---|
| Duke Energy Corporation | 150 | 126 | 135.91 |
| Evergy, Inc. | 93 | 76 | 82.67 |
Analysts expect Duke Energy’s price to rise significantly above its current 116.8 USD, while Evergy also shows potential upside from 72.82 USD, reflecting moderate growth expectations.
Analyst Opinions Comparison
This section compares analysts’ ratings and grades for Duke Energy Corporation and Evergy, Inc.:
Rating Comparison
DUK Rating
- Rating: C+ rated as Very Favorable by analysts.
- Discounted Cash Flow Score: Score of 1, considered Very Unfavorable for valuation perspective.
- ROE Score: Score of 3, indicating Moderate efficiency in generating profits from equity.
- ROA Score: Score of 3, showing Moderate effectiveness in asset utilization.
- Debt To Equity Score: Score of 2, reflecting Moderate financial risk.
- Overall Score: Score of 2, representing Moderate overall financial standing.
EVRG Rating
- Rating: B- rated as Very Favorable by analysts.
- Discounted Cash Flow Score: Score of 1, considered Very Unfavorable for valuation perspective.
- ROE Score: Score of 3, indicating Moderate efficiency in generating profits from equity.
- ROA Score: Score of 3, showing Moderate effectiveness in asset utilization.
- Debt To Equity Score: Score of 2, reflecting Moderate financial risk.
- Overall Score: Score of 2, representing Moderate overall financial standing.
Which one is the best rated?
Evergy (EVRG) holds a higher rating of B- compared to Duke Energy’s (DUK) C+. Both have identical overall and financial metric scores, but EVRG’s superior letter grade indicates a comparatively better analyst rating.
Scores Comparison
Here is a comparison of the Altman Z-Score and Piotroski Score for Duke Energy Corporation and Evergy, Inc.:
Duke Energy Corporation Scores
- Altman Z-Score: 0.71, indicating financial distress zone.
- Piotroski Score: 6, classified as average financial strength.
Evergy, Inc. Scores
- Altman Z-Score: 0.82, indicating financial distress zone.
- Piotroski Score: 5, classified as average financial strength.
Which company has the best scores?
Both companies are in the financial distress zone based on Altman Z-Scores, with Evergy slightly higher. Duke Energy has a marginally better Piotroski Score (6 versus 5), indicating slightly stronger financial health.
Grades Comparison
Here is the comparison of recent analyst grades for Duke Energy Corporation and Evergy, Inc.:
Duke Energy Corporation Grades
This table summarizes recent grades and actions from leading financial institutions for Duke Energy Corporation.
| Grading Company | Action | New Grade | Date |
|---|---|---|---|
| UBS | Maintain | Neutral | 2025-12-17 |
| JP Morgan | Maintain | Neutral | 2025-12-11 |
| Mizuho | Maintain | Outperform | 2025-10-27 |
| Morgan Stanley | Maintain | Equal Weight | 2025-10-22 |
| Barclays | Maintain | Overweight | 2025-10-14 |
| UBS | Maintain | Neutral | 2025-10-10 |
| BMO Capital | Maintain | Outperform | 2025-10-10 |
| Scotiabank | Upgrade | Sector Outperform | 2025-10-03 |
| Jefferies | Downgrade | Hold | 2025-09-26 |
| Morgan Stanley | Maintain | Equal Weight | 2025-09-25 |
The grades for Duke Energy are predominantly neutral to outperform, with few downgrades and some recent upgrades indicating a steady to slightly positive analyst sentiment.
Evergy, Inc. Grades
Below is an overview of recent analyst grades and actions for Evergy, Inc.
| Grading Company | Action | New Grade | Date |
|---|---|---|---|
| Mizuho | Downgrade | Neutral | 2025-12-18 |
| UBS | Maintain | Buy | 2025-12-17 |
| Citigroup | Maintain | Buy | 2025-11-10 |
| Jefferies | Maintain | Buy | 2025-10-09 |
| Mizuho | Maintain | Outperform | 2025-08-08 |
| Mizuho | Maintain | Outperform | 2025-07-18 |
| Barclays | Maintain | Overweight | 2025-05-30 |
| Citigroup | Maintain | Buy | 2025-05-16 |
| UBS | Upgrade | Buy | 2025-04-28 |
| Barclays | Maintain | Overweight | 2025-04-22 |
Evergy has mostly buy and outperform ratings, with a recent downgrade to neutral, reflecting generally positive analyst views but some caution.
Which company has the best grades?
Evergy, Inc. has received a stronger consensus with more buy ratings compared to Duke Energy’s more mixed hold and outperform grades. This difference could influence investors seeking higher growth potential or more bullish analyst sentiment.
Strengths and Weaknesses
Below is a comparison of key strengths and weaknesses for Duke Energy Corporation (DUK) and Evergy, Inc. (EVRG), highlighting their diversification, profitability, innovation, global presence, and market share based on the latest available data.
| Criterion | Duke Energy Corporation (DUK) | Evergy, Inc. (EVRG) |
|---|---|---|
| Diversification | Strong diversification with Electric Utilities (~26.8B USD) and Gas Utilities (~2.3B USD) segments | Primarily focused on Electric Utility segment (~2.7B USD), less diversified |
| Profitability | Net margin 14.86% (favorable), but ROIC 4.02% below WACC of 4.8%; value slightly unfavorable | Net margin 15.0% (favorable), ROIC 4.52% below WACC 5.36%; value slightly unfavorable |
| Innovation | Moderate exposure to Commercial Renewables (~0.5B USD) segment, showing gradual growth | Limited visible innovation segments; focused on traditional electric utility |
| Global presence | Primarily US-based with regional infrastructure, limited international exposure | Mainly regional US electric utility presence |
| Market Share | Large market share in electric and gas utilities with stable revenue streams | Smaller market share relative to DUK, focused on electric utility in fewer regions |
Key takeaways: Both companies show solid profitability with favorable net margins but face challenges as their ROIC remains below WACC, indicating capital inefficiency. Duke Energy benefits from stronger diversification and renewable investments, whereas Evergy is more focused but maintains a slightly better ROIC. Both require cautious risk management given their slightly unfavorable value creation profiles.
Risk Analysis
The table below outlines the key risks associated with Duke Energy Corporation (DUK) and Evergy, Inc. (EVRG) based on their most recent financial and operational data from 2024.
| Metric | Duke Energy Corporation (DUK) | Evergy, Inc. (EVRG) |
|---|---|---|
| Market Risk | Low beta (0.49) suggests lower volatility | Moderate beta (0.646) indicates medium volatility |
| Debt level | High debt-to-equity ratio (1.7), interest coverage moderate (2.53) | High debt-to-equity ratio (1.41), interest coverage moderate (2.61) |
| Regulatory Risk | Significant due to regulated electric utilities in multiple states | Moderate regulatory exposure in Kansas and Missouri |
| Operational Risk | Diverse generation mix, aging coal and nuclear assets increase risk | Reliance on coal and natural gas with some renewables; operational efficiency concerns |
| Environmental Risk | Transition challenges from fossil fuels to renewables; large coal usage | Moderate exposure with ongoing renewable investments |
| Geopolitical Risk | Low, primarily domestic US operations | Low, focused on US Midwest region |
Both companies face significant risks from high leverage and operational challenges related to energy transition. Duke Energy’s larger scale and broader service territory increase regulatory complexity but also diversify risk. The most impactful risk for both is their substantial debt levels combined with moderate interest coverage, which could pressure financial stability if market conditions worsen.
In summary, investors should closely monitor debt management and regulatory developments as these factors are the most likely to influence future performance. Both companies currently reside in financial distress zones per Altman Z-scores, underscoring the importance of cautious risk management.
Which Stock to Choose?
Duke Energy Corporation (DUK) shows a favorable income evolution with a 29.92% revenue growth over 2020-2024 and strong net margin at 14.86%. Its financial ratios reveal mostly unfavorable metrics, including a high debt-to-equity ratio of 1.7 and weak liquidity, despite a favorable dividend yield of 3.86%. The company’s profitability is improving, but it is shedding value with ROIC below WACC. The overall rating is very favorable (C+), yet Altman Z-Score indicates financial distress.
Evergy, Inc. (EVRG) exhibits favorable income growth with 18.53% revenue increase over the same period and a solid net margin of 15.0%. Its financial ratios are slightly better balanced, with favorable price-to-book and dividend yield of 4.21%, though liquidity remains weak and debt levels are moderate. Like DUK, EVRG is shedding value with ROIC below WACC but shows a growing profitability trend. The company holds a very favorable rating (B-) and similarly faces financial distress per Altman Z-Score.
Investors focused on growth might find Evergy’s stronger recent income growth and slightly better valuation ratios more appealing, while those prioritizing dividend income and stability could see Duke Energy’s higher dividend yield as more attractive. Both companies present risks linked to financial distress and value destruction, suggesting a cautious approach depending on risk tolerance and investment strategy.
Disclaimer: Investment carries a risk of loss of initial capital. The past performance is not a reliable indicator of future results. Be sure to understand risks before making an investment decision.
Go Further
I encourage you to read the complete analyses of Duke Energy Corporation and Evergy, Inc. to enhance your investment decisions: