In the evolving energy sector, Duke Energy Corporation and Entergy Corporation stand out as key players in the regulated electric utility industry. Both companies serve millions of customers across multiple U.S. states, blending traditional power generation with growing renewable energy initiatives. Their strategic focus on infrastructure and innovation makes them natural competitors. In this article, I will analyze their strengths to help you decide which company offers the most compelling investment opportunity.
Table of contents
Companies Overview
I will begin the comparison between Duke Energy Corporation and Entergy Corporation by providing an overview of these two companies and their main differences.
Duke Energy Overview
Duke Energy Corporation operates as a major energy company in the US, focusing on electric and gas utilities and commercial renewables. It serves 8.2M customers across six states in the Southeast and Midwest, managing 50,259 MW of generation capacity. Its diversified energy mix includes coal, natural gas, nuclear, hydroelectric, and renewables, with 23 wind and 178 solar facilities, emphasizing a broad infrastructure footprint.
Entergy Overview
Entergy Corporation produces and distributes electricity mainly in Arkansas, Louisiana, Mississippi, and Texas, serving 3M utility customers. Its two main segments cover utility operations and wholesale commodities, including nuclear power plant management. Entergy’s generation capacity totals around 26,000 MW, with a significant 6,000 MW nuclear component, and it supplies energy to various retail and wholesale customers across its service areas.
Key similarities and differences
Both Duke Energy and Entergy operate in the regulated electric industry in the US, providing electricity and natural gas services with diversified energy portfolios including renewables and nuclear. Duke Energy has a larger customer base and generation capacity with a stronger presence in renewables, while Entergy focuses more on nuclear power and serves a smaller geographic area with fewer customers but a significant nuclear generation segment. Both emphasize regulated utility operations alongside wholesale energy activities.
Income Statement Comparison
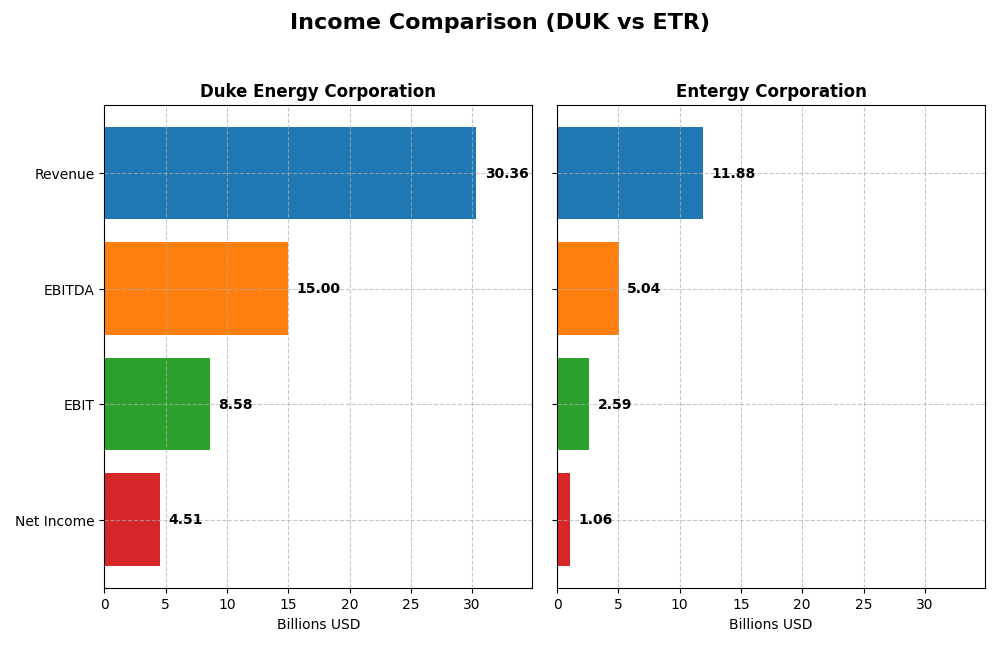
This table compares the key income statement metrics for Duke Energy Corporation and Entergy Corporation for the fiscal year 2024, highlighting their financial performance in revenue, profitability, and earnings per share.
| Metric | Duke Energy Corporation | Entergy Corporation |
|---|---|---|
| Market Cap | 90.8B | 41.8B |
| Revenue | 30.4B | 11.9B |
| EBITDA | 15.0B | 5.0B |
| EBIT | 8.6B | 2.6B |
| Net Income | 4.5B | 1.1B |
| EPS | 5.71 | 2.47 |
| Fiscal Year | 2024 | 2024 |
Income Statement Interpretations
Duke Energy Corporation
Duke Energy’s revenue showed a steady increase from $23.4B in 2020 to $30.4B in 2024, reflecting a favorable 29.92% growth over five years. Net income surged notably, rising from $1.38B in 2020 to $4.51B in 2024, with net margin improving significantly to 14.86%. In 2024, revenue growth slowed to 4.46%, while gross profit and EBIT margins expanded, indicating enhanced operational efficiency despite rising expenses.
Entergy Corporation
Entergy’s revenue increased from $10.1B in 2020 to $11.9B in 2024 but declined by 2.2% in the latest year, signaling recent challenges. Net income contracted over the period, falling from $1.41B in 2020 to $1.06B in 2024, with net margin dropping to 8.93%. The 2024 year was marked by decreases in EBIT and net income, reflecting weaker profitability and margin compression amid higher operating expenses.
Which one has the stronger fundamentals?
Duke Energy exhibits stronger fundamentals with overall favorable income statement metrics, including robust revenue and net income growth, improved margins, and positive EPS trends. In contrast, Entergy faces multiple unfavorable indicators, such as declining net income, shrinking margins, and negative recent growth rates. Duke’s financial profile suggests better resilience and profitability over the analyzed period.
Financial Ratios Comparison
The table below presents a side-by-side comparison of key financial ratios for Duke Energy Corporation (DUK) and Entergy Corporation (ETR) based on their latest fiscal year data ending 2024.
| Ratios | Duke Energy Corporation (DUK) | Entergy Corporation (ETR) |
|---|---|---|
| ROE | 8.997% | 7.019% |
| ROIC | 4.017% | 3.199% |
| P/E | 18.44 | 30.56 |
| P/B | 1.66 | 2.14 |
| Current Ratio | 0.67 | 0.72 |
| Quick Ratio | 0.44 | 0.43 |
| D/E | 1.70 | 1.91 |
| Debt-to-Assets | 45.7% | 44.6% |
| Interest Coverage | 2.34 | 2.30 |
| Asset Turnover | 0.16 | 0.18 |
| Fixed Asset Turnover | 0.24 | 0.25 |
| Payout ratio | 71.2% | 94.2% |
| Dividend yield | 3.86% | 3.08% |
Interpretation of the Ratios
Duke Energy Corporation
Duke Energy shows a mixed ratio profile with favorable net margin (14.86%) and dividend yield (3.86%), but unfavorable returns on equity (9.0%) and invested capital (4.02%), alongside weak liquidity ratios (current ratio 0.67). Debt levels and asset turnover also raise concerns. The company pays dividends, sustaining a solid yield, although coverage by free cash flow is limited, indicating some risk in maintaining distributions.
Entergy Corporation
Entergy’s ratios reflect moderate performance with a neutral net margin (8.93%) and dividend yield (3.08%), but unfavorable returns on equity (7.02%) and invested capital (3.2%), and a high price-to-earnings ratio (30.56). Liquidity and leverage ratios are similarly weak. It pays dividends supported by cash flow challenges, suggesting caution around payout sustainability and capital structure.
Which one has the best ratios?
Duke Energy’s ratio evaluation appears slightly more favorable overall, benefiting from a higher net margin and dividend yield, despite notable weaknesses in liquidity and returns. Entergy’s ratios are more unfavorable, particularly with a higher valuation and weaker returns. Both companies face challenges, but Duke’s metrics suggest a marginally better balance between profitability and shareholder returns.
Strategic Positioning
This section compares the strategic positioning of Duke Energy Corporation and Entergy Corporation, including market position, key segments, and exposure to disruption:
Duke Energy Corporation
- Leading regulated electric utility in Southeast and Midwest, facing moderate competitive pressure.
- Diversified segments: Electric Utilities, Gas Utilities, and Commercial Renewables driving growth and revenue.
- Moderate exposure via renewables and battery storage; traditional fuel mix includes coal, gas, and nuclear.
Entergy Corporation
- Regulated electric utility focused on Arkansas, Louisiana, Mississippi, Texas, with competitive pressure from wholesale markets.
- Two main segments: Utility operations and wholesale commodities, with emphasis on nuclear power plants.
- Exposure to technological disruption limited; operates nuclear and other power plants, including decommissioning activities.
Duke Energy Corporation vs Entergy Corporation Positioning
Duke Energy pursues a diversified approach with electric, gas, and renewables segments, providing multiple revenue streams. Entergy concentrates on utility and wholesale nuclear, focusing on fewer segments but with significant nuclear capacity. Diversification offers broader market exposure, while concentration may limit growth avenues.
Which has the best competitive advantage?
Duke Energy shows slightly unfavorable MOAT with growing ROIC, indicating improving profitability despite value destruction. Entergy faces very unfavorable MOAT with declining ROIC and worsening profitability, suggesting weaker competitive advantage relative to Duke Energy.
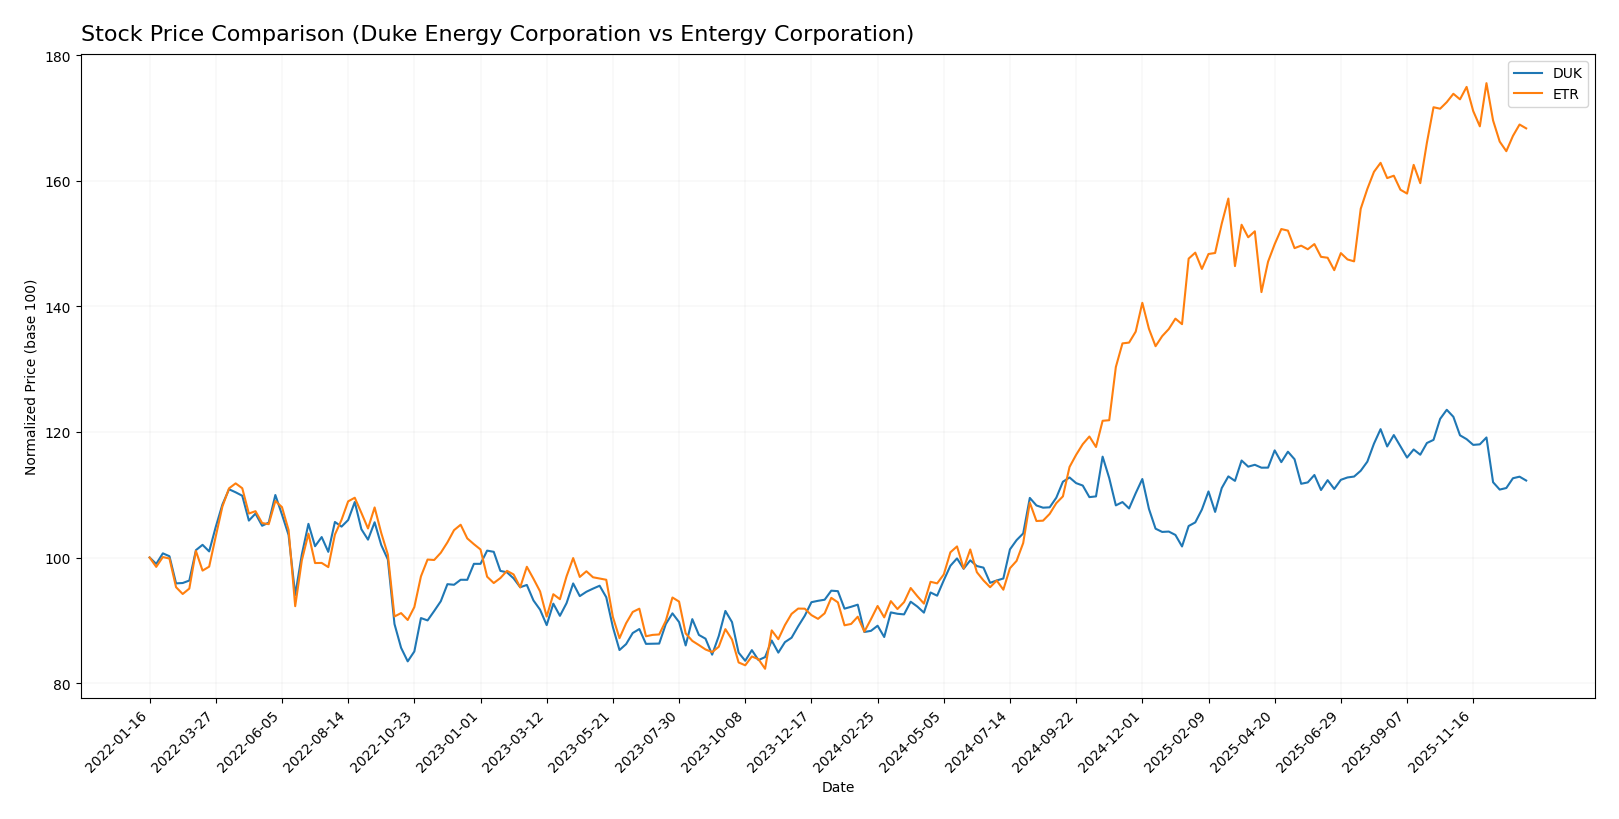
Stock Comparison
The stock prices of Duke Energy Corporation and Entergy Corporation have shown significant upward momentum over the past year, with both experiencing decelerating bullish trends despite recent short-term declines.
Trend Analysis
Duke Energy Corporation’s stock rose by 27.12% over the past 12 months, indicating a bullish trend with deceleration and a volatility measured by a 9.13 standard deviation. The stock recently declined by 8.3%, reflecting a negative short-term slope.
Entergy Corporation recorded an 86.74% increase over the same period, also marking a bullish trend but with deceleration and higher volatility at a 15.22 standard deviation. Its recent trend shows a 3.17% decrease and a mild negative slope.
Comparing these trends, Entergy’s stock has delivered the highest market performance over the last year, significantly outperforming Duke Energy despite both showing recent short-term downward movements.
Target Prices
The consensus target prices for Duke Energy Corporation and Entergy Corporation indicate moderate upside potential.
| Company | Target High | Target Low | Consensus |
|---|---|---|---|
| Duke Energy Corporation | 150 | 126 | 135.91 |
| Entergy Corporation | 115 | 91 | 103.17 |
Analyst targets suggest Duke Energy’s price could rise from $116.8 to about $136, while Entergy’s current price of $93.52 may increase to approximately $103, reflecting cautious optimism.
Analyst Opinions Comparison
This section compares analysts’ ratings and grades for Duke Energy Corporation and Entergy Corporation:
Rating Comparison
DUK Rating
- Rating: C+ with a very favorable status.
- Discounted Cash Flow Score: 1, indicating a very unfavorable valuation outlook.
- ROE Score: 3, moderate efficiency in generating profit from equity.
- ROA Score: 3, moderate asset utilization effectiveness.
- Debt To Equity Score: 2, moderate financial risk level.
- Overall Score: 2, moderate overall financial standing.
ETR Rating
- Rating: B- with a very favorable status.
- Discounted Cash Flow Score: 1, indicating a very unfavorable valuation outlook.
- ROE Score: 4, favorable efficiency in generating profit from equity.
- ROA Score: 3, moderate asset utilization effectiveness.
- Debt To Equity Score: 2, moderate financial risk level.
- Overall Score: 2, moderate overall financial standing.
Which one is the best rated?
Entergy Corporation holds a higher rating of B- compared to Duke Energy’s C+, supported by a stronger ROE score of 4 versus 3. Both share similar discounted cash flow, ROA, debt-to-equity, and overall scores, indicating moderate performance overall.
Scores Comparison
Here is a comparison of the Altman Z-Score and Piotroski Score for Duke Energy Corporation and Entergy Corporation:
Duke Energy Corporation Scores
- Altman Z-Score: 0.71, in distress zone indicating high bankruptcy risk
- Piotroski Score: 6, average financial strength
Entergy Corporation Scores
- Altman Z-Score: 1.04, also in distress zone showing significant financial distress risk
- Piotroski Score: 4, average financial strength
Which company has the best scores?
Based on the scores, Duke Energy has a lower Altman Z-Score indicating slightly greater distress, but a higher Piotroski Score than Entergy. Both companies are in the distress zone, with average Piotroski scores, showing moderate financial health levels.
Grades Comparison
Here is a comparison of the latest grades assigned to Duke Energy Corporation and Entergy Corporation by reputable grading firms:
Duke Energy Corporation Grades
The following table shows recent grades issued by recognized financial institutions for Duke Energy Corporation:
| Grading Company | Action | New Grade | Date |
|---|---|---|---|
| UBS | Maintain | Neutral | 2025-12-17 |
| JP Morgan | Maintain | Neutral | 2025-12-11 |
| Mizuho | Maintain | Outperform | 2025-10-27 |
| Morgan Stanley | Maintain | Equal Weight | 2025-10-22 |
| Barclays | Maintain | Overweight | 2025-10-14 |
| UBS | Maintain | Neutral | 2025-10-10 |
| BMO Capital | Maintain | Outperform | 2025-10-10 |
| Scotiabank | Upgrade | Sector Outperform | 2025-10-03 |
| Jefferies | Downgrade | Hold | 2025-09-26 |
| Morgan Stanley | Maintain | Equal Weight | 2025-09-25 |
Overall, Duke Energy’s grades are mixed with a slight tilt towards neutral and outperform ratings, indicating cautious optimism among analysts.
Entergy Corporation Grades
The table below presents recent grades given to Entergy Corporation by established grading companies:
| Grading Company | Action | New Grade | Date |
|---|---|---|---|
| Argus Research | Maintain | Buy | 2026-01-06 |
| UBS | Maintain | Buy | 2025-12-17 |
| Keybanc | Maintain | Overweight | 2025-12-12 |
| JP Morgan | Maintain | Overweight | 2025-12-11 |
| Citigroup | Maintain | Neutral | 2025-11-18 |
| Evercore ISI Group | Maintain | In Line | 2025-10-30 |
| Mizuho | Maintain | Outperform | 2025-10-27 |
| Morgan Stanley | Maintain | Equal Weight | 2025-10-22 |
| B of A Securities | Maintain | Neutral | 2025-10-16 |
| Keybanc | Maintain | Overweight | 2025-10-15 |
Entergy’s grades mainly lean towards buy and overweight, reflecting a more positive analyst sentiment compared to Duke Energy.
Which company has the best grades?
Entergy Corporation generally holds better grades than Duke Energy Corporation, with more buy and overweight ratings versus Duke’s mainly neutral and hold opinions. This suggests investors might perceive Entergy as having slightly stronger growth or value potential, affecting portfolio composition decisions accordingly.
Strengths and Weaknesses
Below is a comparison of key strengths and weaknesses for Duke Energy Corporation (DUK) and Entergy Corporation (ETR) based on the latest financial and operational data.
| Criterion | Duke Energy Corporation (DUK) | Entergy Corporation (ETR) |
|---|---|---|
| Diversification | Strong focus on Electric Utilities ($26.8B) and Gas Utilities ($2.3B), with some renewables exposure | Diverse electric customer base (Residential, Commercial, Industrial) with ~$9B utility revenue and additional segments |
| Profitability | Net margin 14.86% (favorable), ROIC 4.02% (unfavorable), shedding value but improving ROIC | Net margin 8.93% (neutral), ROIC 3.2% (unfavorable), shedding value with declining ROIC |
| Innovation | Moderate involvement in Commercial Renewables (~$500M revenue) | Limited direct renewable segment; focus remains on regulated utilities and wholesale commodities |
| Global presence | Primarily U.S.-based, regional focus on regulated utilities | U.S.-focused, with significant electricity and natural gas regulated services |
| Market Share | Large market share in electric utilities infrastructure | Strong regional utility presence, but smaller scale than Duke |
Key takeaways: Duke Energy shows better profitability metrics and a growing ROIC trend despite currently shedding value, supported by its strong electric utilities base and renewable initiatives. Entergy faces more challenges with declining profitability and ROIC, reflecting a less favorable investment profile, though both remain U.S.-centric utility players. Investors should weigh Duke’s improving fundamentals against Entergy’s more cautious outlook.
Risk Analysis
Below is a comparative table outlining key risk factors for Duke Energy Corporation (DUK) and Entergy Corporation (ETR) based on the most recent data from 2024:
| Metric | Duke Energy Corporation (DUK) | Entergy Corporation (ETR) |
|---|---|---|
| Market Risk | Low beta (0.49) indicates lower volatility | Moderate beta (0.65) suggests moderate volatility |
| Debt level | High debt-to-equity (1.7), moderate interest coverage (2.53) | Higher debt-to-equity (1.91), lower interest coverage (2.25) |
| Regulatory Risk | Significant due to regulated electric utilities in multiple states | High, with nuclear plant operations and regional regulatory exposure |
| Operational Risk | Diverse energy mix including renewables, but aging infrastructure risks | Exposure to nuclear decommissioning and fuel mix transition challenges |
| Environmental Risk | Moderate, transitioning to renewables but still reliant on fossil fuels and nuclear | Moderate to high, with nuclear operations and environmental compliance costs |
| Geopolitical Risk | Low, primarily US regional utility focus | Low, focused on US southern states |
In synthesis, both companies face moderate market and regulatory risks inherent to the regulated utilities sector. Duke Energy’s lower beta signals reduced market volatility, but its financial ratios show some liquidity and leverage concerns. Entergy’s higher debt and nuclear operational risks could impact financial stability. The most impactful risk for both remains regulatory changes affecting energy production and environmental compliance. Investors should monitor debt management and regulatory developments closely.
Which Stock to Choose?
Duke Energy Corporation (DUK) shows favorable income evolution with strong gross and EBIT margins and positive net margin growth of 0.5% in 2024. Its financial ratios reveal mixed signals: favorable net margin and dividend yield but unfavorable ROE and leverage ratios. The company carries moderate debt and holds a C+ rating, indicating a slightly unfavorable global ratio profile but favorable overall income statement performance.
Entergy Corporation (ETR) experienced an unfavorable income evolution marked by negative net income and EPS growth over the 2020-2024 period, despite a favorable gross margin. Its financial ratios are mostly unfavorable, with a high P/E ratio and moderate debt levels. ETR holds a B- rating, reflecting moderate overall scores but a generally unfavorable global ratio and income statement evaluation.
Considering ratings and financial assessments, DUK might appear more favorable for investors prioritizing income stability and improving profitability, while ETR could appeal to those with a tolerance for risk seeking potential growth despite recent earnings challenges. The choice depends on whether the investor values steadiness and income quality or is inclined toward a risk-tolerant profile.
Disclaimer: Investment carries a risk of loss of initial capital. The past performance is not a reliable indicator of future results. Be sure to understand risks before making an investment decision.
Go Further
I encourage you to read the complete analyses of Duke Energy Corporation and Entergy Corporation to enhance your investment decisions: