In the competitive landscape of regulated electric utilities, Duke Energy Corporation (DUK) and Edison International (EIX) stand out as key players delivering essential power services in distinct yet overlapping U.S. regions. Both companies emphasize innovation through renewable energy integration and infrastructure modernization, shaping the future of energy. This analysis will guide investors in discerning which company presents the most compelling opportunity for a balanced, forward-looking portfolio.
Table of contents
Companies Overview
I will begin the comparison between Duke Energy Corporation and Edison International by providing an overview of these two companies and their main differences.
Duke Energy Corporation Overview
Duke Energy Corporation operates as a major energy company in the US, serving approximately 8.2M customers across six states in the Southeast and Midwest. Its business spans electric utilities, gas utilities, and commercial renewables, with over 50,259 MW of generation capacity, including coal, natural gas, hydroelectric, nuclear, and renewable sources. The company focuses on regulated electric and gas infrastructure alongside renewable energy projects.
Edison International Overview
Edison International generates and distributes electricity to around 15M customers in Southern, Central, and Coastal California. It operates extensive transmission and distribution networks with approximately 70,000 circuit-miles of lines and 800 substations. The company provides energy solutions to various sectors, emphasizing regulated electric power delivery in California, supported by a long-standing presence since 1886.
Key similarities and differences
Both companies operate in the regulated electric utilities sector, focusing on electricity generation and distribution to large customer bases in specific US regions. Duke Energy has a more diversified energy portfolio including gas utilities and renewable energy projects across multiple states, while Edison International is concentrated on electric power delivery and infrastructure primarily within California. Their scale and geographical focus differ, with Duke serving fewer but broader regions and Edison serving a larger customer base within one state.
Income Statement Comparison
This table compares the key income statement metrics for Duke Energy Corporation and Edison International for the fiscal year 2024, providing a snapshot of their financial performance.

| Metric | Duke Energy Corporation (DUK) | Edison International (EIX) |
|---|---|---|
| Market Cap | 90.8B | 23.5B |
| Revenue | 30.4B | 17.6B |
| EBITDA | 15.0B | 6.4B |
| EBIT | 8.6B | 3.4B |
| Net Income | 4.5B | 1.5B |
| EPS | 5.71 | 3.33 |
| Fiscal Year | 2024 | 2024 |
Income Statement Interpretations
Duke Energy Corporation
Duke Energy’s revenue and net income have shown consistent growth from 2020 to 2024, with revenue rising from $23.4B to $30.4B and net income increasing sharply by over 200%. Margins remain strong, with a gross margin around 50% and a favorable EBIT margin near 28%. In 2024, revenue growth slowed to 4.5%, but profitability improved, supported by a 10% rise in EBIT and stable net margin expansion.
Edison International
Edison International experienced steady revenue growth from $13.6B in 2020 to $17.6B in 2024, with net income growing 77.5% overall. Margins improved moderately, with a gross margin of 41% and a net margin of 8.8% in 2024. The latest fiscal year saw a 7.7% revenue increase and nearly 10% EBIT growth, reflecting improved operating efficiency and a favorable trend in net margin and EPS growth.
Which one has the stronger fundamentals?
Both companies demonstrate favorable income statement fundamentals with positive revenue and net income growth. Duke Energy exhibits higher margins and a more pronounced net income increase, though it faces slightly higher interest expenses. Edison International shows slightly better operational expense control relative to revenue growth. Overall, both have strengths, with Duke offering stronger margin performance and Edison showing solid efficiency gains.
Financial Ratios Comparison
The table below presents a side-by-side comparison of key financial ratios for Duke Energy Corporation (DUK) and Edison International (EIX) based on the most recent fiscal year 2024 data.
| Ratios | Duke Energy Corporation (DUK) | Edison International (EIX) |
|---|---|---|
| ROE | 8.997% | 9.933% |
| ROIC | 4.017% | 3.609% |
| P/E | 18.44 | 19.93 |
| P/B | 1.66 | 1.98 |
| Current Ratio | 0.67 | 0.85 |
| Quick Ratio | 0.44 | 0.78 |
| D/E | 1.70 | 2.43 |
| Debt-to-Assets | 45.7% | 44.1% |
| Interest Coverage | 2.34 | 1.57 |
| Asset Turnover | 0.163 | 0.206 |
| Fixed Asset Turnover | 0.244 | 0.291 |
| Payout Ratio | 71.2% | 83.2% |
| Dividend Yield | 3.86% | 4.17% |
Interpretation of the Ratios
Duke Energy Corporation
Duke Energy shows a mixed financial profile with strong net margin (14.86%, favorable) and dividend yield (3.86%, favorable), but weak profitability ratios such as ROE (9.0%, unfavorable) and ROIC (4.02%, unfavorable). Liquidity is a concern with a current ratio of 0.67 and quick ratio of 0.44, both unfavorable. The company pays dividends with a stable yield supported by moderate payout, but high debt and low asset turnover pose risks.
Edison International
Edison International presents overall weaker ratios than Duke, with a neutral net margin (8.78%) and unfavorable ROE (9.93%) and ROIC (3.61%). Liquidity ratios are better than Duke but still unfavorable at 0.85 current ratio and 0.78 quick ratio. The dividend yield is slightly higher at 4.17%, indicating shareholder returns, yet interest coverage (1.84) and high debt-to-equity (2.43) ratios raise concerns about financial stability.
Which one has the best ratios?
Duke Energy has a slightly less unfavorable overall ratio profile compared to Edison International, with better net margin and dividend yield. However, both companies share weaknesses in profitability, liquidity, and asset efficiency. Duke’s lower debt level and stronger dividend coverage contrast with Edison’s higher leverage and weaker interest coverage, making Duke marginally more balanced in its financial ratios.
Strategic Positioning
This section compares the strategic positioning of Duke Energy Corporation and Edison International, including market position, key segments, and exposure to technological disruption:
Duke Energy Corporation
- Large market cap of 90.8B with moderate competitive pressure in regulated electric utilities.
- Diversified segments: Electric Utilities, Gas Utilities, and Commercial Renewables driving revenues.
- Exposure includes renewable energy projects and energy storage, indicating adaptation to tech disruption.
Edison International
- Smaller market cap of 23.5B, focused on regulated electric utilities in California.
- Concentrated mainly in Electric Utility segment serving 15M customers in California.
- Transmission and distribution focus with less explicit renewable or tech disruption exposure.
Duke Energy Corporation vs Edison International Positioning
Duke Energy shows a diversified business model across electric, gas, and renewables segments, providing multiple revenue streams. Edison International maintains a concentrated focus on electric utilities within California, which may limit segment diversification but offers regional specialization.
Which has the best competitive advantage?
Both companies show slightly unfavorable MOAT evaluations due to ROIC below WACC but with growing profitability trends. Duke Energy’s larger scale and diversified segments suggest a broader competitive base compared to Edison International’s regional concentration.
Stock Comparison
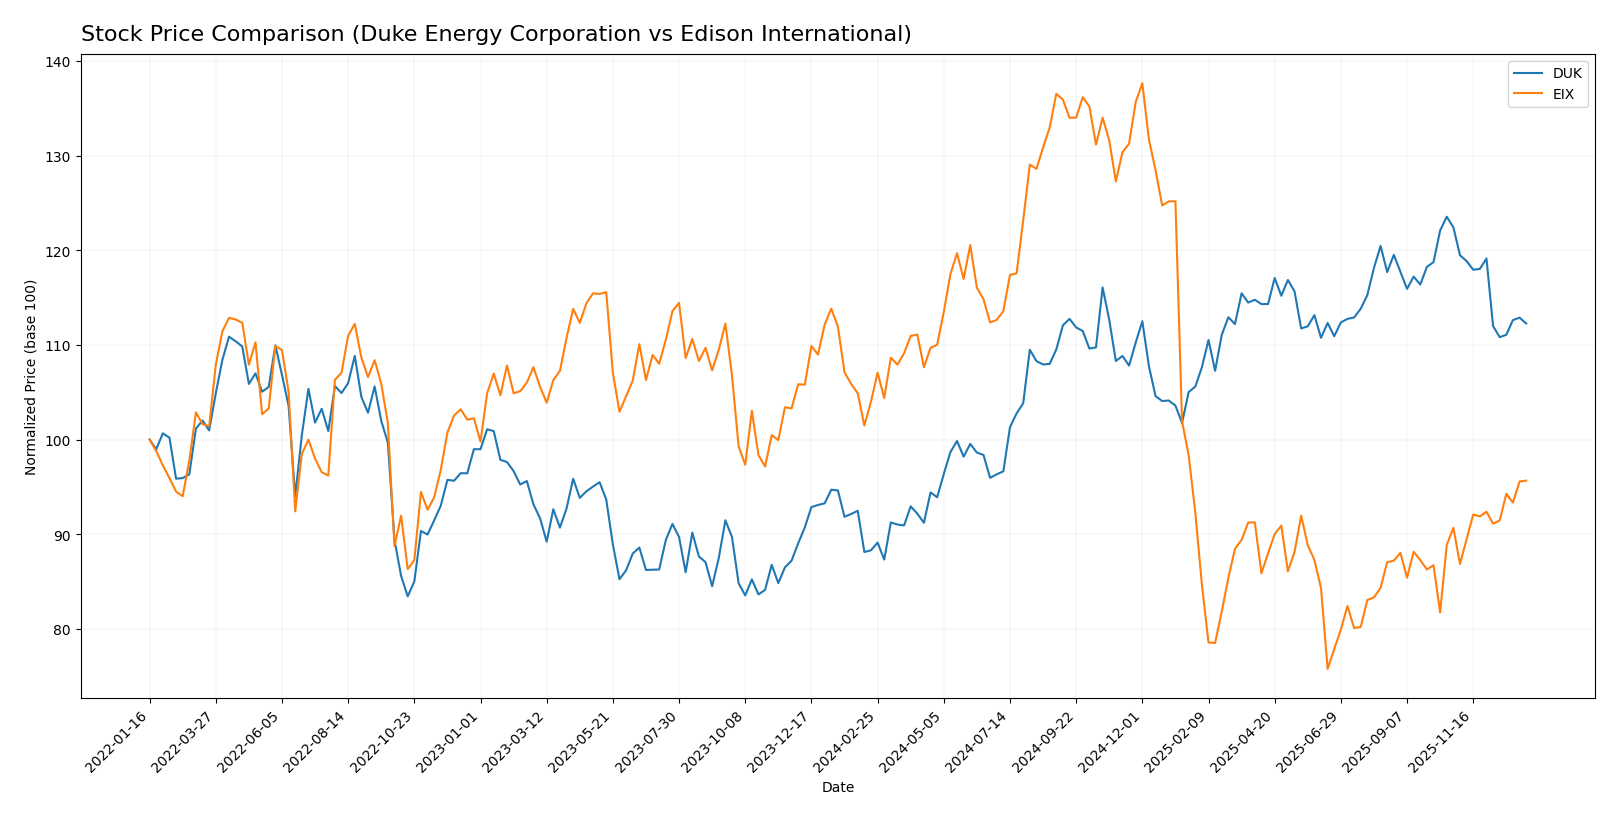
The past year has seen Duke Energy Corporation’s stock exhibit a strong bullish trend with decelerating gains, while Edison International’s shares faced a bearish trend overall but have shown recent signs of acceleration and recovery.
Trend Analysis
Duke Energy Corporation’s stock rose 27.12% over the past 12 months, indicating a bullish trend with deceleration in momentum. It reached a high of 128.53 and a low of 90.86, with notable volatility reflected in a 9.13 standard deviation.
Edison International’s stock declined 8.02% over the same period, marking a bearish trend with accelerating losses. Prices ranged between 48.32 and 87.75, accompanied by higher volatility at 12.11 standard deviation.
Comparing the two, Duke Energy delivered the highest market performance with a 27.12% gain, outperforming Edison’s 8.02% decline over the past year.
Target Prices
Analyst consensus provides a clear outlook for Duke Energy Corporation and Edison International.
| Company | Target High | Target Low | Consensus |
|---|---|---|---|
| Duke Energy Corporation | 150 | 126 | 135.91 |
| Edison International | 70 | 56 | 62 |
The target consensus indicates moderate upside potential for both stocks compared to their current prices: Duke Energy at 116.8 and Edison International at 60.99. Analysts expect steady performance within the utilities sector.
Analyst Opinions Comparison
This section compares analysts’ ratings and grades for Duke Energy Corporation and Edison International:
Rating Comparison
DUK Rating
- Rating: C+ indicating a very favorable overall evaluation.
- Discounted Cash Flow Score: 1, marked as very unfavorable for both companies.
- ROE Score: 3, considered moderate efficiency in generating profit.
- ROA Score: 3, moderate effectiveness in utilizing assets.
- Debt To Equity Score: 2, moderate financial risk indication.
- Overall Score: 2, categorized as moderate financial standing.
EIX Rating
- Rating: B+ indicating a very favorable overall evaluation.
- Discounted Cash Flow Score: 1, marked as very unfavorable for both companies.
- ROE Score: 5, very favorable efficiency in generating profit.
- ROA Score: 4, favorable effectiveness in utilizing assets.
- Debt To Equity Score: 1, very unfavorable, indicating higher financial risk.
- Overall Score: 3, also moderate but higher than DUK.
Which one is the best rated?
Edison International holds a superior rating (B+) compared to Duke Energy’s C+, with higher ROE and ROA scores. However, Edison’s debt-to-equity score indicates greater financial risk, balancing the overall moderate scores.
Scores Comparison
Here is a comparison of the Altman Z-Score and Piotroski Score for Duke Energy Corporation and Edison International:
Duke Energy Corporation Scores
- Altman Z-Score: 0.71, indicating financial distress.
- Piotroski Score: 6, reflecting average financial strength.
Edison International Scores
- Altman Z-Score: 0.72, indicating financial distress.
- Piotroski Score: 6, reflecting average financial strength.
Which company has the best scores?
Both Duke Energy and Edison International show similar financial health with Altman Z-Scores in the distress zone and identical Piotroski Scores of 6, indicating average financial strength for each.
Grades Comparison
The grades assigned by various reputable financial institutions for Duke Energy Corporation and Edison International are as follows:
Duke Energy Corporation Grades
The table below summarizes recent official grades from recognized grading companies for Duke Energy Corporation:
| Grading Company | Action | New Grade | Date |
|---|---|---|---|
| UBS | Maintain | Neutral | 2025-12-17 |
| JP Morgan | Maintain | Neutral | 2025-12-11 |
| Mizuho | Maintain | Outperform | 2025-10-27 |
| Morgan Stanley | Maintain | Equal Weight | 2025-10-22 |
| Barclays | Maintain | Overweight | 2025-10-14 |
| UBS | Maintain | Neutral | 2025-10-10 |
| BMO Capital | Maintain | Outperform | 2025-10-10 |
| Scotiabank | Upgrade | Sector Outperform | 2025-10-03 |
| Jefferies | Downgrade | Hold | 2025-09-26 |
| Morgan Stanley | Maintain | Equal Weight | 2025-09-25 |
Overall, Duke Energy’s grades reflect a generally neutral to moderately positive outlook, with several firms maintaining or upgrading to outperform or overweight ratings.
Edison International Grades
The following table shows recent grades for Edison International from established grading companies:
| Grading Company | Action | New Grade | Date |
|---|---|---|---|
| Morgan Stanley | Maintain | Underweight | 2025-12-17 |
| JP Morgan | Maintain | Neutral | 2025-12-12 |
| UBS | Maintain | Buy | 2025-12-02 |
| Ladenburg Thalmann | Maintain | Neutral | 2025-10-30 |
| Barclays | Maintain | Overweight | 2025-10-29 |
| Jefferies | Maintain | Hold | 2025-10-22 |
| Morgan Stanley | Maintain | Underweight | 2025-10-22 |
| Barclays | Maintain | Overweight | 2025-10-21 |
| Jefferies | Downgrade | Hold | 2025-10-02 |
| JP Morgan | Maintain | Neutral | 2025-09-25 |
Edison International’s grades present a mixed view, with some strong buy signals from UBS but also underweight ratings from Morgan Stanley, indicating varied analyst opinions.
Which company has the best grades?
Edison International holds a consensus “Buy” rating with a higher number of buy recommendations, while Duke Energy has a consensus “Hold” with more hold recommendations. This suggests Edison International has received relatively more favorable grades, potentially attracting investors seeking growth, whereas Duke Energy’s ratings imply a more cautious stance reflecting stability or moderate performance expectations.
Strengths and Weaknesses
Below is a comparative overview of key strengths and weaknesses for Duke Energy Corporation (DUK) and Edison International (EIX) based on their latest financial and operational data.
| Criterion | Duke Energy Corporation (DUK) | Edison International (EIX) |
|---|---|---|
| Diversification | Strong in electric utilities ($26.8B) and gas infrastructure ($2.32B), with commercial renewables growing | Focused on electric utility ($10.6B) and competitive power generation, less diversified |
| Profitability | Net margin 14.86% (favorable), ROIC 4.02% (unfavorable), growing ROIC trend but still shedding value | Net margin 8.78% (neutral), ROIC 3.61% (unfavorable), ROIC growing but value is still being destroyed |
| Innovation | Moderate investments in renewables segment and infrastructure upgrades | Limited data on innovation; dependent on competitive power generation and electric utilities |
| Global presence | Primarily US-focused but with some commercial renewables exposure | Mainly US market with electric utility focus, limited global footprint |
| Market Share | Large presence in electric and gas utilities markets | Significant player in electric utilities, smaller scale compared to DUK |
Key takeaway: Both companies show improving profitability trends but are currently value destroyers with unfavorable ROIC relative to WACC. Duke Energy benefits from stronger diversification and higher net margins, while Edison International faces higher leverage and weaker liquidity ratios. Caution and further monitoring of operational improvements are advised before investment.
Risk Analysis
The following table summarizes key risks for Duke Energy Corporation (DUK) and Edison International (EIX) based on their latest financial data and market conditions in 2026.
| Metric | Duke Energy Corporation (DUK) | Edison International (EIX) |
|---|---|---|
| Market Risk | Low beta (0.49) suggests moderate market volatility exposure | Moderate beta (0.83) indicates higher market sensitivity |
| Debt level | High debt-to-equity ratio (1.7), moderate interest coverage (2.53) | Higher debt-to-equity (2.43), weaker interest coverage (1.84) |
| Regulatory Risk | Significant due to energy sector regulations in multiple states | High, with California’s strict energy policies and regulations |
| Operational Risk | Diverse energy mix including coal, gas, nuclear, renewables reduces risk | Large infrastructure in California with potential wildfire liability |
| Environmental Risk | Exposure from fossil fuel operations, but growing renewables portfolio | High due to wildfire risks and regulatory environmental requirements |
| Geopolitical Risk | Low, primarily US-focused operations | Low, US domestic operations only |
Duke Energy’s greatest risks stem from its high leverage and operational complexity across fuel types, while Edison International faces elevated regulatory and environmental risks linked to California’s unique challenges, including wildfire liabilities. Both show financial distress signals per Altman Z-Scores, underlining caution despite stable dividend yields.
Which Stock to Choose?
Duke Energy Corporation (DUK) shows a generally favorable income statement with 71% positive indicators including solid gross and EBIT margins and strong net margin growth over 2020-2024. However, its financial ratios are slightly unfavorable overall, with high debt levels and low liquidity. The company’s rating stands at C+ with moderate overall scores, while its MOAT analysis indicates value destruction despite improving profitability.
Edison International (EIX) presents a favorable income statement with 79% positive metrics, including good revenue and net income growth, though its financial ratios are more unfavorable than DUK’s, featuring higher leverage and weaker interest coverage. EIX’s rating is higher at B+ with some very favorable scores in ROE and ROA, but its MOAT evaluation similarly signals value destruction alongside rising profitability.
For investors, those prioritizing income statement strength and moderate risk might find DUK more aligned with their profile, while investors focused on higher equity returns and potentially greater volatility could see EIX as more appealing. Both companies show improving profitability but carry financial and valuation risks that warrant cautious analysis.
Disclaimer: Investment carries a risk of loss of initial capital. The past performance is not a reliable indicator of future results. Be sure to understand risks before making an investment decision.
Go Further
I encourage you to read the complete analyses of Duke Energy Corporation and Edison International to enhance your investment decisions: