Home > Comparison > Utilities > XEL vs DTE
The strategic rivalry between Xcel Energy Inc. and DTE Energy Company shapes the utilities sector’s evolution. Xcel operates a diversified, multi-state regulated electric and natural gas model, emphasizing renewable integration. DTE focuses on a concentrated, Michigan-centric electric and gas utility with substantial industrial and energy trading operations. This analysis probes their contrasting growth and capital allocation strategies to identify which trajectory offers superior risk-adjusted returns for diversified portfolios.
Table of contents
Companies Overview
Xcel Energy Inc. and DTE Energy Company are key players in the regulated electric utility sector, each commanding significant market influence.
Xcel Energy Inc.: Renewable-Focused Utility Leader
Xcel Energy operates as a regulated electric and natural gas utility, serving approximately 3.7M electric and 2.1M gas customers across multiple states. Its core revenue stems from generating and distributing electricity from diverse sources including coal, nuclear, natural gas, and renewables. In 2026, Xcel emphasizes expanding renewable generation facilities, leveraging its diverse energy mix to balance reliability with sustainability.
DTE Energy Company: Integrated Utility with Industrial Edge
DTE Energy serves 2.3M electric and 1.3M gas customers primarily in southeastern Michigan. Its revenue derives from electricity generation using fossil fuels, nuclear, and renewables, plus a robust gas distribution network. DTE also operates industrial projects supplying metallurgical coke and power services, focusing in 2026 on optimizing its energy trading and industrial segments to enhance operational resilience and market reach.
Strategic Collision: Similarities & Divergences
Both companies prioritize regulated electric utilities with natural gas operations but diverge in scale and industrial exposure. Xcel pursues a broader geographic footprint and renewable expansion, while DTE leverages industrial projects and energy trading for diversification. Their primary battleground is the transition to cleaner energy amid regulatory pressures. These differences shape distinct investment profiles: Xcel as a growth-oriented utility, DTE as a diversified energy operator with industrial ties.
Income Statement Comparison
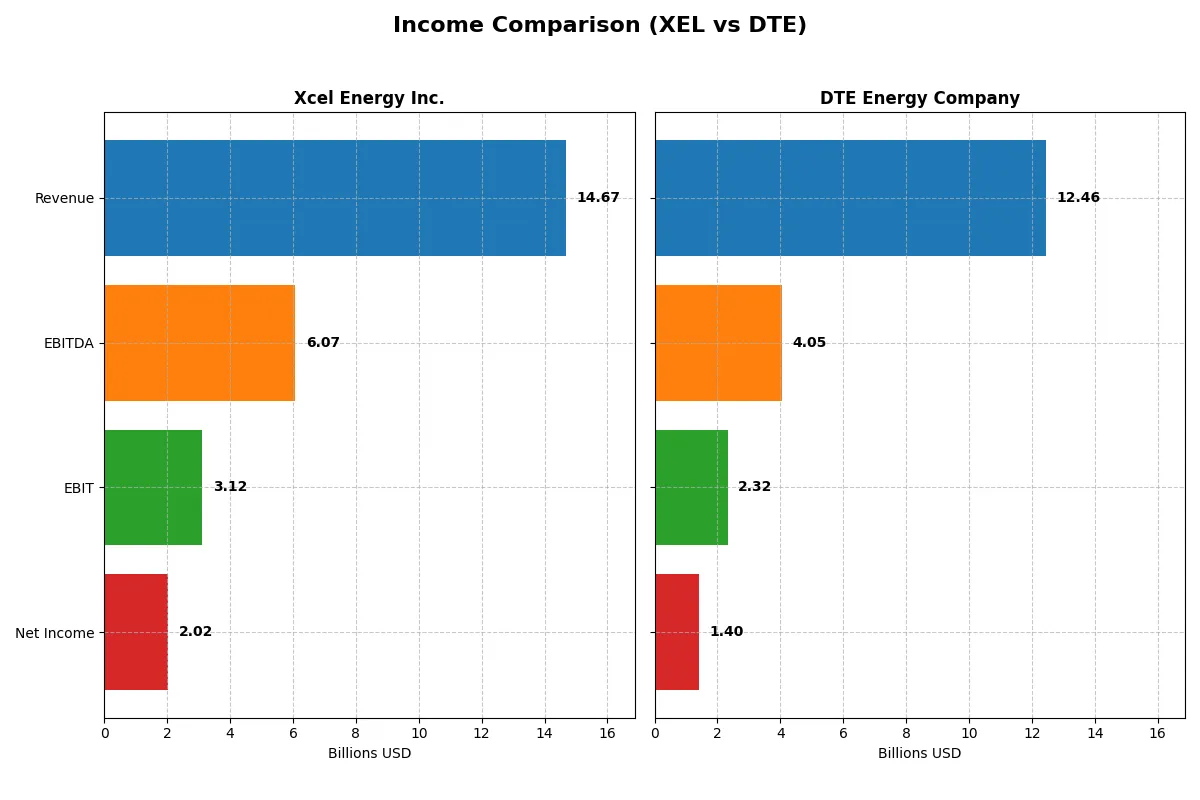
This table dissects the core profitability and scalability of both corporate engines to reveal who dominates the bottom line:
| Metric | Xcel Energy Inc. (XEL) | DTE Energy Company (DTE) |
|---|---|---|
| Revenue | 14.7B | 12.5B |
| Cost of Revenue | 11.1B | 8.1B |
| Operating Expenses | 686M | 2.2B |
| Gross Profit | 3.6B | 4.3B |
| EBITDA | 6.1B | 4.1B |
| EBIT | 3.1B | 2.3B |
| Interest Expense | 1.3B | 951M |
| Net Income | 2.0B | 1.4B |
| EPS | 3.44 | 6.78 |
| Fiscal Year | 2025 | 2024 |
Income Statement Analysis: The Bottom-Line Duel
This income statement comparison reveals how efficiently each company converts revenue into profit, exposing the true power of their corporate engines.
Xcel Energy Inc. Analysis
Xcel Energy’s revenue grew consistently, hitting $14.7B in 2025 with net income rising to $2.02B. Its gross margin contracted sharply in 2025 but remains healthy overall at 24.3%. EBIT margin improved to 21.2%, indicating robust operational efficiency. The company shows strong momentum with 9.1% revenue growth and a 14.7% EBIT increase in the latest year.
DTE Energy Company Analysis
DTE’s revenue declined slightly to $12.5B in 2024, with net income steady at $1.4B. The firm maintains a superior gross margin of 34.8%, reflecting cost control, but EBIT margin stands lower at 18.6%. Recent year-on-year revenue and EBIT fell modestly, signaling pressure on growth despite a slight net margin improvement to 11.3%.
Margin Power vs. Revenue Momentum
Xcel Energy outpaces DTE in net income growth and operational efficiency, driven by expanding EBIT margins and solid revenue gains. Meanwhile, DTE shows stronger gross margins but faces headwinds in top-line and EBIT expansion. For investors, Xcel’s profile offers a more attractive blend of growth and margin improvement over time.
Financial Ratios Comparison
These vital ratios act as a diagnostic tool to expose the underlying fiscal health, valuation premiums, and capital efficiency of the companies compared:
| Ratios | Xcel Energy Inc. (XEL) | DTE Energy Company (DTE) |
|---|---|---|
| ROE | 9.9% | 12.0% |
| ROIC | 3.6% | 4.5% |
| P/E | 21.5 | 17.8 |
| P/B | 1.95 | 2.14 |
| Current Ratio | 0.67 | 0.71 |
| Quick Ratio | 0.57 | 0.46 |
| D/E | 1.55 | 1.99 |
| Debt-to-Assets | 43.1% | 47.6% |
| Interest Coverage | 2.14 | 2.20 |
| Asset Turnover | 0.19 | 0.26 |
| Fixed Asset Turnover | 0.23 | 0.40 |
| Payout Ratio | 82.2% | 57.8% |
| Dividend Yield | 3.83% | 3.24% |
| Fiscal Year | 2025 | 2024 |
Efficiency & Valuation Duel: The Vital Signs
Ratios act as a company’s DNA, unveiling hidden risks and operational strengths essential for informed investment decisions.
Xcel Energy Inc.
Xcel Energy shows a favorable net margin of 13.76%, signaling decent profitability, but its ROE and ROIC are zero, indicating weak capital efficiency. The P/E ratio at 21.48 suggests a neutral valuation. The company offers a 3.83% dividend yield, reflecting steady shareholder returns amid mixed operational metrics.
DTE Energy Company
DTE posts an 11.25% net margin and a neutral ROE of 11.98%, demonstrating better profitability and capital use than Xcel. Its P/E of 17.84 is also neutral but comparatively lower, indicating a less stretched valuation. The 3.24% dividend yield supports consistent shareholder rewards despite some unfavorable leverage ratios.
Balanced Profitability vs. Valuation Stretch
DTE balances profitability and valuation with a stronger ROE and lower P/E, while Xcel offers higher margins but lacks capital efficiency. Investors seeking moderate risk with steady dividends may lean toward DTE, whereas Xcel fits those prioritizing margin strength despite efficiency concerns.
Which one offers the Superior Shareholder Reward?
I compare Xcel Energy Inc. (XEL) and DTE Energy Company (DTE) on dividends, payout ratios, and buybacks for 2024–2025. XEL yields 3.8% with a payout ratio near 82%, signaling strong dividend coverage but limited free cash flow cushion. Its buyback activity appears modest, implying a conservative capital return strategy. DTE offers a slightly higher 3.2% yield and a 58% payout ratio, leaving more room for reinvestment or buybacks. However, DTE’s free cash flow is negative, pressuring buybacks and dividend sustainability despite a robust buyback program historically. I find XEL’s higher payout and stable dividend more reliable, but DTE’s aggressive buybacks hint at a potentially higher total return if cash flow recovers. Given current metrics and sustainability, I judge XEL offers a superior, more dependable shareholder reward in 2026.
Comparative Score Analysis: The Strategic Profile
The radar chart reveals the fundamental DNA and trade-offs of Xcel Energy Inc. and DTE Energy Company, highlighting their distinct financial strengths and weaknesses:
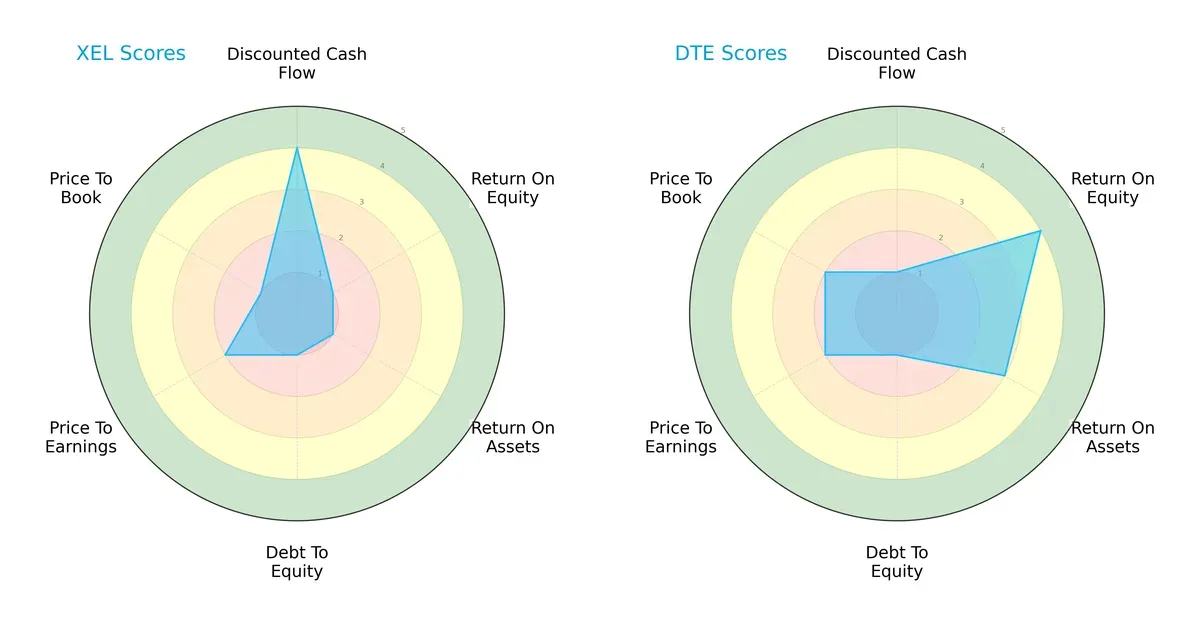
Xcel Energy leans heavily on a strong discounted cash flow (DCF) score of 4 but suffers across return on equity (ROE), return on assets (ROA), debt-to-equity, and valuation metrics, indicating reliance on cash flow rather than operational efficiency. In contrast, DTE Energy shows superior ROE (4) and ROA (3) scores, reflecting better profitability and asset utilization, though it has a weak DCF score of 1. Both firms face challenges with debt levels (score 1), but DTE presents a more balanced profile with modest valuation scores compared to Xcel’s uneven performance.
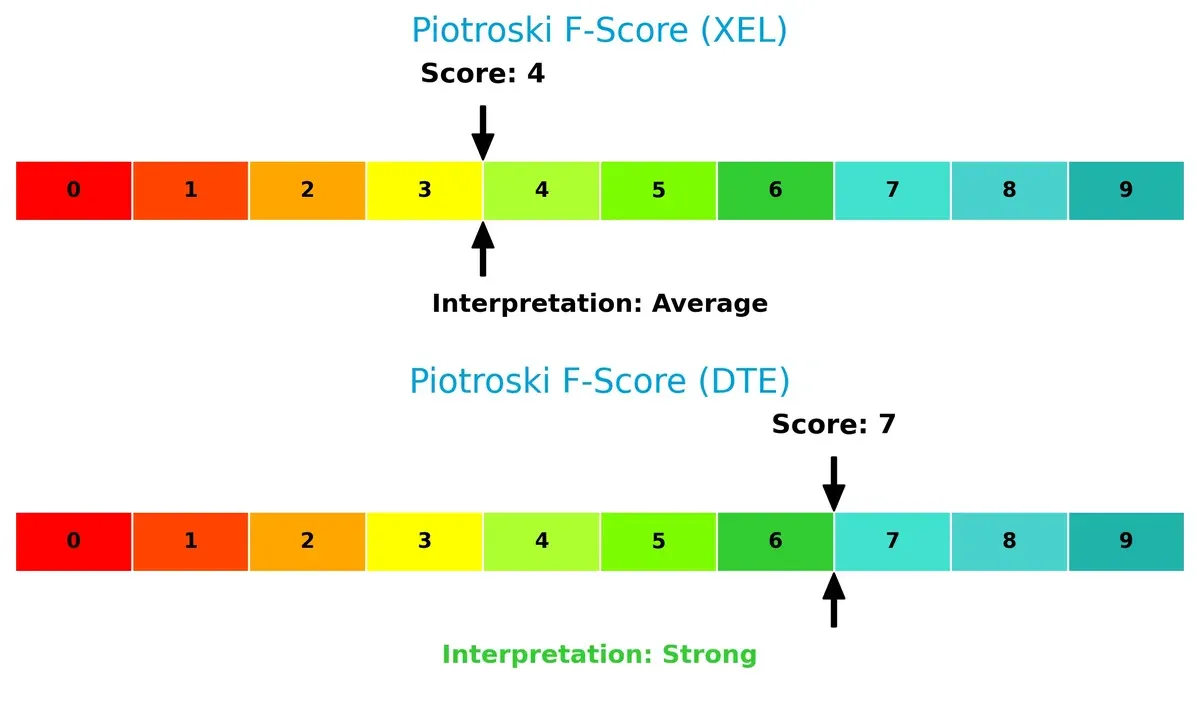
Financial Health: Quality of Operations
DTE Energy demonstrates stronger internal financial health with a Piotroski F-Score of 7, indicating robust profitability, liquidity, and operational efficiency. Xcel Energy’s score of 4 flags potential red flags in internal metrics, suggesting room for improvement in financial quality and operational resilience:
How are the two companies positioned?
This section dissects XEL and DTE’s operational DNA by comparing their revenue distribution and internal strengths and weaknesses. The goal is to confront their economic moats to reveal which model delivers the most resilient, sustainable competitive advantage today.
Revenue Segmentation: The Strategic Mix
This visual comparison dissects how Xcel Energy Inc. and DTE Energy Company diversify their income streams and where their primary sector bets lie:
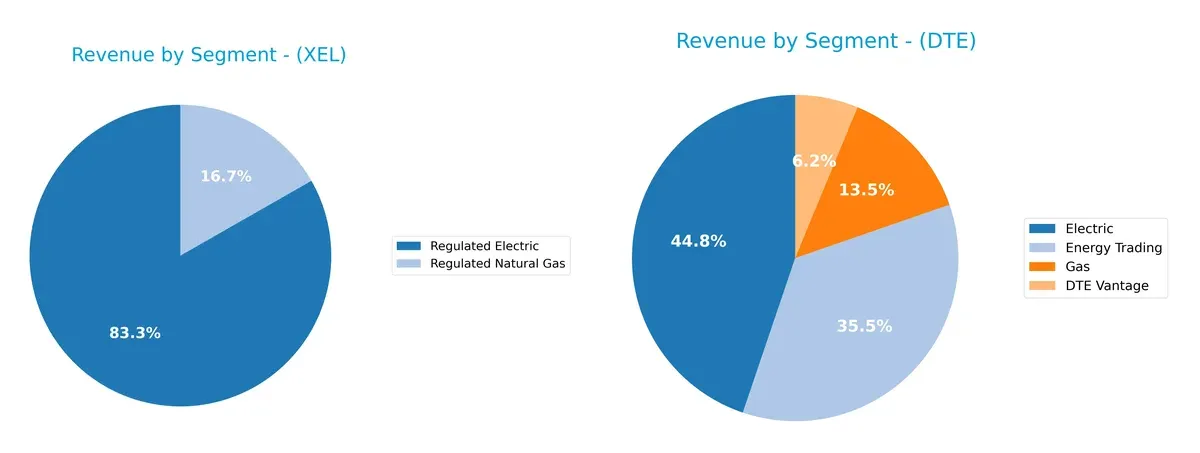
Xcel Energy anchors its revenue in Regulated Electric, with $22.3B in 2024, complemented by a $4.5B Regulated Natural Gas segment. This concentration signals a stable, regulated utility model with limited diversification. DTE Energy pivots more diversely, balancing $5.8B Electric, $1.7B Gas, and a strong $4.6B Energy Trading segment in 2023. DTE’s mix implies exposure to market volatility but offers growth through energy trading and innovation platforms like DTE Vantage.
Strengths and Weaknesses Comparison
This table compares the Strengths and Weaknesses of Xcel Energy Inc. and DTE Energy Company:
Xcel Energy Inc. Strengths
- Higher net margin at 13.76%
- Favorable dividend yield of 3.83%
- Lower debt-to-equity and debt-to-assets ratios indicating conservative leverage
DTE Energy Company Strengths
- Favorable net margin at 11.25%
- WACC at 5.11% indicates reasonable capital cost
- Diversified segments including Energy Trading and DTE Vantage
Xcel Energy Inc. Weaknesses
- Zero ROE and ROIC, signaling lack of capital efficiency
- Unfavorable liquidity ratios with zero current and quick ratios
- Low asset and fixed asset turnover ratios
DTE Energy Company Weaknesses
- Unfavorable debt-to-equity ratio at 1.99 and weak liquidity ratios
- Low ROIC at 4.53%, below WACC
- Unfavorable asset and fixed asset turnover ratios
Xcel Energy’s strengths lie in profitability and conservative leverage, but its zero returns on equity and capital signal operational challenges. DTE shows segment diversification and moderate profitability but faces higher leverage and liquidity risks. Both companies exhibit similar operational efficiency weaknesses that may affect capital allocation.
The Moat Duel: Analyzing Competitive Defensibility
A structural moat shields long-term profits from relentless competition erosion. Let’s dissect the key competitive advantages of these utility giants:
Xcel Energy Inc.: Diverse Energy Portfolio Moat
Xcel leverages a broad energy mix spanning renewables and fossil fuels, creating intangible asset strength. Its stable 13.8% net margin reflects operational resilience. Expansion into renewables in 2026 could widen its moat, but declining ROIC signals caution.
DTE Energy Company: Infrastructure Scale and Efficiency Moat
DTE’s moat lies in vast transmission assets and efficient capital use. Unlike Xcel, it shows improving ROIC trends despite currently shedding value. This signals operational optimization, with opportunities to grow through energy trading and renewables in Michigan.
Verdict: Diverse Energy Mix vs. Infrastructure Efficiency
Xcel’s broader energy portfolio offers wider market exposure but faces pressure from declining capital returns. DTE’s deeper moat stems from improving ROIC and infrastructure scale, positioning it better to defend market share amid sector shifts.
Which stock offers better returns?
The past year shows significant gains for both stocks, with Xcel Energy Inc. sharply outperforming DTE Energy Company despite recent short-term pullbacks.
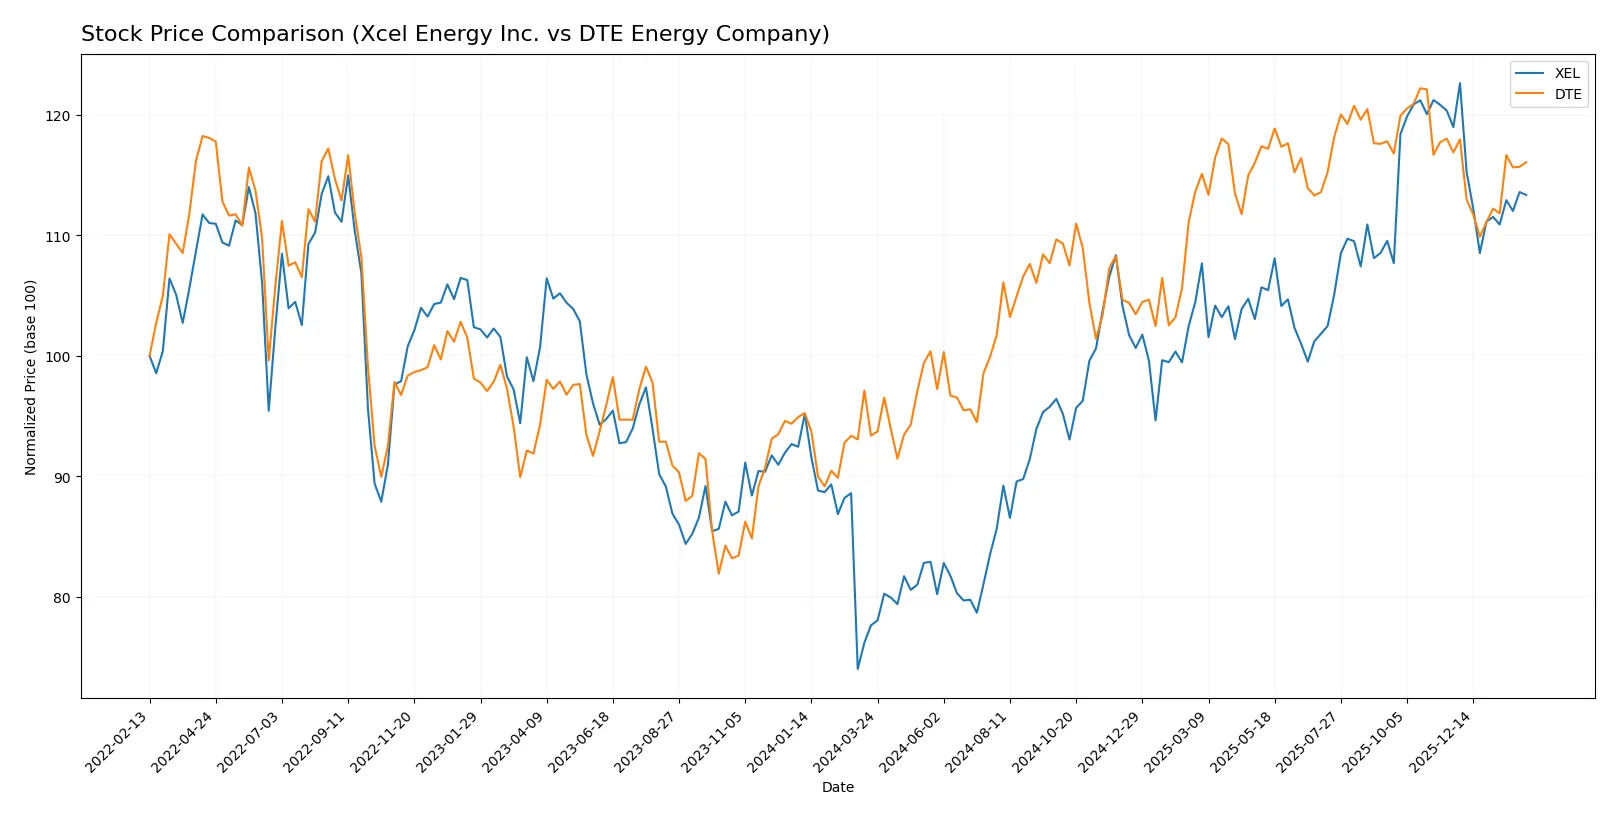
Trend Comparison
Xcel Energy Inc. posts a 46% price increase over 12 months, signaling a strong bullish trend with decelerating momentum and a high of 82.11, but recent months reveal a moderate 4.7% decline.
DTE Energy Company rises 24% over the same period, also bullish but with greater volatility and decelerating gains; recent price movement is nearly flat with a slight 0.7% dip.
Xcel Energy delivers the highest market return overall, though both stocks show slowing momentum and recent short-term weakness.
Target Prices
Analysts present a confident target consensus for both Xcel Energy Inc. and DTE Energy Company.
| Company | Target Low | Target High | Consensus |
|---|---|---|---|
| Xcel Energy Inc. | 81 | 95 | 88 |
| DTE Energy Company | 141 | 152 | 146.75 |
The target consensus for Xcel Energy suggests a 16% upside from its current 75.9 price. DTE’s consensus implies about 9% potential gain from 134.82. Analysts expect moderate appreciation for both utilities.

Don’t Let Luck Decide Your Entry Point
Optimize your entry points with our advanced ProRealTime indicators. You’ll get efficient buy signals with precise price targets for maximum performance. Start outperforming now!
How do institutions grade them?
The following tables summarize the latest institutional grades for Xcel Energy Inc. and DTE Energy Company:
Xcel Energy Inc. Grades
This table shows recent grades from leading financial institutions for Xcel Energy Inc.:
| Grading Company | Action | New Grade | Date |
|---|---|---|---|
| Barclays | Maintain | Overweight | 2026-01-15 |
| UBS | Maintain | Neutral | 2025-12-17 |
| Keybanc | Maintain | Overweight | 2025-12-12 |
| JP Morgan | Maintain | Overweight | 2025-12-11 |
| Barclays | Maintain | Overweight | 2025-11-05 |
| Citigroup | Maintain | Buy | 2025-11-03 |
| UBS | Maintain | Neutral | 2025-10-31 |
| Mizuho | Maintain | Outperform | 2025-10-27 |
| Jefferies | Maintain | Buy | 2025-10-16 |
| Keybanc | Maintain | Overweight | 2025-10-15 |
DTE Energy Company Grades
This table displays recent institutional grades for DTE Energy Company:
| Grading Company | Action | New Grade | Date |
|---|---|---|---|
| Morgan Stanley | Maintain | Overweight | 2026-02-02 |
| Jefferies | Maintain | Buy | 2026-01-28 |
| Mizuho | Maintain | Outperform | 2026-01-26 |
| Wells Fargo | Maintain | Overweight | 2026-01-20 |
| Barclays | Maintain | Equal Weight | 2026-01-15 |
| BMO Capital | Maintain | Market Perform | 2025-12-24 |
| UBS | Maintain | Buy | 2025-12-17 |
| Jefferies | Upgrade | Buy | 2025-12-11 |
| JP Morgan | Maintain | Neutral | 2025-12-11 |
| B of A Securities | Maintain | Buy | 2025-11-05 |
Which company has the best grades?
Xcel Energy consistently receives “Overweight” and “Buy” ratings, while DTE Energy shows a wider range from “Equal Weight” to “Buy.” Xcel’s higher concentration of positive grades suggests stronger institutional confidence, potentially attracting investors seeking more consensus-driven support.
Risks specific to each company
The following categories identify critical pressure points and systemic threats that confront Xcel Energy Inc. and DTE Energy Company in the 2026 market environment:
1. Market & Competition
Xcel Energy Inc.
- Serves 3.7M electricity and 2.1M gas customers across multiple states, offering renewable and traditional energy.
DTE Energy Company
- Serves 2.3M electricity and 1.3M gas customers primarily in Michigan, with diverse energy generation assets.
2. Capital Structure & Debt
Xcel Energy Inc.
- Favorable debt-to-equity ratio; interest coverage neutral at 2.32x, indicating moderate debt risk.
DTE Energy Company
- Unfavorable debt-to-equity at 1.99; interest coverage neutral at 2.44x, showing higher leverage concerns.
3. Stock Volatility
Xcel Energy Inc.
- Beta at 0.476 suggests low market volatility relative to S&P 500.
DTE Energy Company
- Beta at 0.484 also indicates low volatility, closely tracking Xcel’s risk profile.
4. Regulatory & Legal
Xcel Energy Inc.
- Operates in multiple states with complex regulatory environments, increasing compliance costs and risks.
DTE Energy Company
- Focused in Michigan, regulatory risk is more concentrated but potentially more volatile due to state policies.
5. Supply Chain & Operations
Xcel Energy Inc.
- Diverse fuel sources and renewable infrastructure reduce supply chain disruption risk.
DTE Energy Company
- Heavy reliance on fossil fuels and large asset base exposes it to operational inflexibility risks.
6. ESG & Climate Transition
Xcel Energy Inc.
- Strong push towards renewables and sustainable projects; aligns with global climate goals.
DTE Energy Company
- Transition underway but still significant fossil fuel dependence; faces pressure to accelerate ESG efforts.
7. Geopolitical Exposure
Xcel Energy Inc.
- Primarily US domestic exposure, minimizing geopolitical risks but sensitive to national energy policies.
DTE Energy Company
- Also US-focused, but regional economic shifts in Michigan could pose localized geopolitical challenges.
Which company shows a better risk-adjusted profile?
Xcel Energy’s strongest risk lies in regulatory complexity across multiple states, while DTE’s main risk is its high leverage and fossil fuel dependence. Xcel offers a better risk-adjusted profile due to its more balanced capital structure and proactive ESG transition. DTE’s distress-level Altman Z-score underlines financial fragility despite stronger profitability metrics. This contrast suggests Xcel’s diversified operations and lower debt provide more resilience in 2026’s volatile utility market.
Final Verdict: Which stock to choose?
Xcel Energy Inc. (XEL) stands out for its robust revenue growth and consistent profitability, making it a cash generator in a capital-intensive sector. Its main point of vigilance is the declining return on invested capital, which signals caution on long-term value creation. XEL suits portfolios targeting aggressive growth with an appetite for cyclical risks.
DTE Energy Company (DTE) leverages a stable operational moat through improving returns on capital despite currently shedding value. Its strategic advantage lies in disciplined capital allocation and relatively stronger profitability metrics. DTE offers better downside protection, fitting well in Growth at a Reasonable Price (GARP) or income-focused portfolios seeking moderate volatility.
If you prioritize dynamic growth and can tolerate some uncertainty in capital efficiency, Xcel Energy appears the compelling choice due to its top-line momentum and earnings expansion. However, if you seek more stability and improving capital returns with a conservative risk profile, DTE outshines with its solid operational improvement and defensive qualities. Each fits distinct investor profiles balancing growth and safety.
Disclaimer: Investment carries a risk of loss of initial capital. The past performance is not a reliable indicator of future results. Be sure to understand risks before making an investment decision.
Go Further
I encourage you to read the complete analyses of Xcel Energy Inc. and DTE Energy Company to enhance your investment decisions: