WEC Energy Group, Inc. and DTE Energy Company are two prominent players in the regulated electric utilities sector, both serving large customer bases in the United States with a mix of traditional and renewable energy sources. Their market overlap and commitment to innovation in energy generation and distribution make them natural competitors. In this article, I will carefully analyze their strengths and risks to determine which company presents the most compelling investment opportunity for your portfolio.
Table of contents
Companies Overview
I will begin the comparison between WEC Energy Group and DTE Energy Company by providing an overview of these two companies and their main differences.
WEC Overview
WEC Energy Group, Inc. operates as a regulated electric and natural gas utility company in the United States. It provides a broad range of energy services including electricity generation from diverse sources such as coal, natural gas, and renewables, alongside natural gas distribution and electric transmission. Headquartered in Milwaukee, Wisconsin, WEC manages extensive infrastructure including over 35,000 miles of both overhead and underground distribution lines and serves millions of customers.
DTE Overview
DTE Energy Company is a Michigan-based utility engaged in electricity generation, distribution, and natural gas services. It supplies power to about 2.3 million electricity customers and 1.3 million natural gas customers, operating various generation assets including fossil fuel, nuclear, hydroelectric, and renewables. DTE also provides industrial products and energy trading services, managing thousands of miles of pipelines and distribution infrastructure throughout southeastern Michigan.
Key similarities and differences
Both WEC and DTE operate in the regulated electric utility sector with integrated natural gas services, providing energy through a mix of fossil fuels and renewables. WEC’s operations span multiple states with a larger employee base and broader infrastructure, while DTE focuses primarily on Michigan with additional industrial and energy trading segments. Each company manages extensive distribution networks but differs in scale and diversification of ancillary services.
Income Statement Comparison
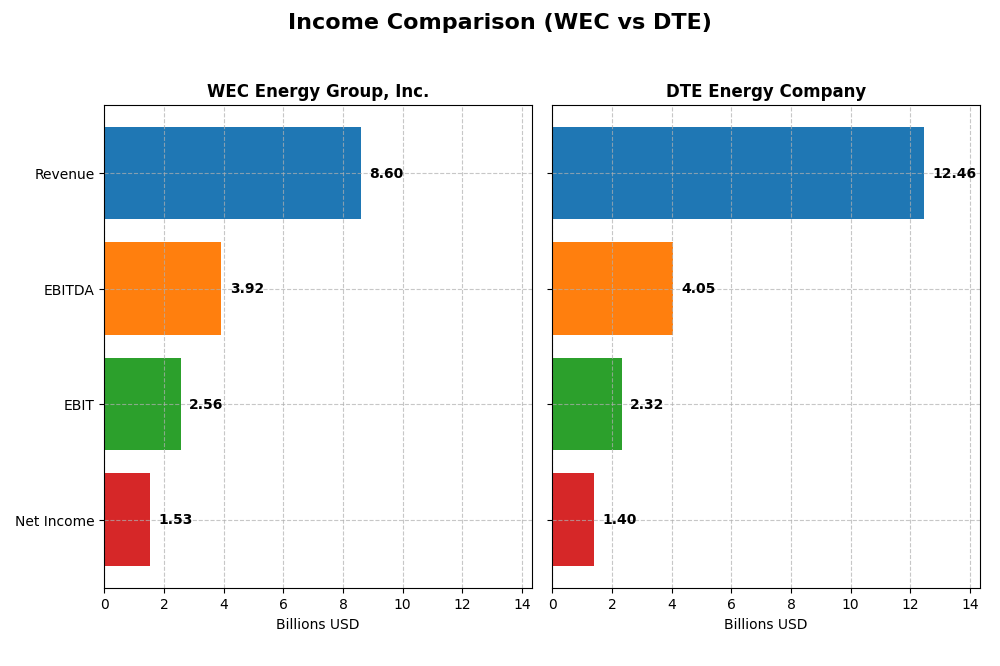
The table below compares key income statement metrics for WEC Energy Group, Inc. and DTE Energy Company for the fiscal year 2024.
| Metric | WEC Energy Group, Inc. | DTE Energy Company |
|---|---|---|
| Market Cap | 33.5B | 27.0B |
| Revenue | 8.60B | 12.46B |
| EBITDA | 3.92B | 4.05B |
| EBIT | 2.56B | 2.32B |
| Net Income | 1.53B | 1.40B |
| EPS | 4.81 | 6.78 |
| Fiscal Year | 2024 | 2024 |
Income Statement Interpretations
WEC Energy Group, Inc.
WEC Energy Group showed an overall revenue growth of 18.76% from 2020 to 2024, with net income increasing by 27.25% over the same period. Gross and EBIT margins remained favorable, at 44.02% and 29.79% respectively, indicating operational efficiency. In 2024, revenue slightly declined by 3.3%, but net income grew 14.45%, reflecting improved margins and cost management.
DTE Energy Company
DTE Energy experienced a 9.05% revenue growth from 2020 to 2024, with net income growth remaining modest at 2.41%. Gross margin held favorably at 34.82%, although EBIT margin was lower at 18.63%. The 2024 fiscal year saw a 2.26% revenue decrease and a slight EBIT decline, while net margin growth and EPS growth were neutral, signaling stable but constrained profitability.
Which one has the stronger fundamentals?
WEC displays stronger fundamentals with a higher percentage of favorable income statement metrics, including superior margin expansion and robust net income growth over the period. Conversely, DTE’s income statement shows mixed results with fewer favorable indicators and a declining net margin trend. Overall, WEC’s income growth and margin improvements suggest more consistent financial strength.
Financial Ratios Comparison
The table below provides a side-by-side comparison of key financial ratios for WEC Energy Group, Inc. (WEC) and DTE Energy Company (DTE) based on their most recent fiscal year data from 2024.
| Ratios | WEC Energy Group, Inc. | DTE Energy Company |
|---|---|---|
| ROE | 12.3% | 12.0% |
| ROIC | 4.14% | 4.65% |
| P/E | 19.46 | 17.80 |
| P/B | 2.39 | 2.14 |
| Current Ratio | 0.60 | 0.71 |
| Quick Ratio | 0.43 | 0.46 |
| D/E (Debt-to-Equity) | 1.64 | 1.99 |
| Debt-to-Assets | 42.9% | 47.6% |
| Interest Coverage | 2.64 | 2.20 |
| Asset Turnover | 0.18 | 0.26 |
| Fixed Asset Turnover | 0.25 | 0.40 |
| Payout Ratio | 69.1% | 57.7% |
| Dividend Yield | 3.55% | 3.24% |
Interpretation of the Ratios
WEC Energy Group, Inc.
WEC Energy Group shows a mixed ratio profile with a favorable net margin of 17.77% and a solid dividend yield of 3.55%. However, concerns arise from its low current and quick ratios (0.6 and 0.43) and elevated debt-to-equity ratio of 1.64, indicating liquidity and leverage challenges. The company maintains a neutral ROE at 12.3%, but ROIC is unfavorable at 4.14%. Dividends appear sustainable given the payout trend, yet free cash flow coverage suggests caution.
DTE Energy Company
DTE Energy exhibits a favorable net margin of 11.27% and a dividend yield of 3.24%, reflecting steady shareholder returns. Liquidity remains a concern with a current ratio of 0.71 and quick ratio of 0.46, while leverage is marked by a debt-to-equity ratio of 1.99. ROE stands neutral at 12.0% with an unfavorable ROIC of 4.65%. Dividend payments are consistent, but cash flow metrics imply potential risks in coverage and capital allocation.
Which one has the best ratios?
Both WEC Energy Group and DTE Energy Company have comparable favorable ratios at 21.43% and equal neutral and unfavorable ratio percentages, resulting in a slightly unfavorable overall profile for each. WEC’s stronger net margin and dividend yield contrast with DTE’s marginally higher asset turnover and ROIC, but liquidity and leverage weaknesses are evident in both. Neither company distinctly outperforms the other in ratio strength.
Strategic Positioning
This section compares the strategic positioning of WEC and DTE, including market position, key segments, and exposure to technological disruption:
WEC
- Market position and competitive pressure: A larger market cap of 33.5B in regulated electric utilities with moderate beta 0.573.
- Key segments and business drivers: Diverse segments including Wisconsin, Illinois, Other States, Electric Transmission, and Non-Utility Energy Infrastructure.
- Exposure to technological disruption: Operates multiple energy sources including coal, natural gas, renewables, and electric transmission.
DTE
- Market cap of 27.0B in regulated electric utilities with lower beta 0.484, indicating less volatility.
- Diversified operations across Electric, Gas, DTE Vantage, Energy Trading, and Power & Industrial Projects.
- Generates electricity from fossil fuels, nuclear, hydroelectric, wind, and operates energy trading and industrial projects.
WEC vs DTE Positioning
WEC has a regionally diversified utility business with significant natural gas and electric infrastructure, while DTE combines utility services with energy trading and industrial projects. Both face regulated market pressures but differ in segment focus and operational scope.
Which has the best competitive advantage?
Both WEC and DTE show slightly unfavorable MOATs, shedding value but with growing ROIC trends. Neither currently demonstrates a strong competitive advantage based on ROIC versus WACC evaluations.
Stock Comparison
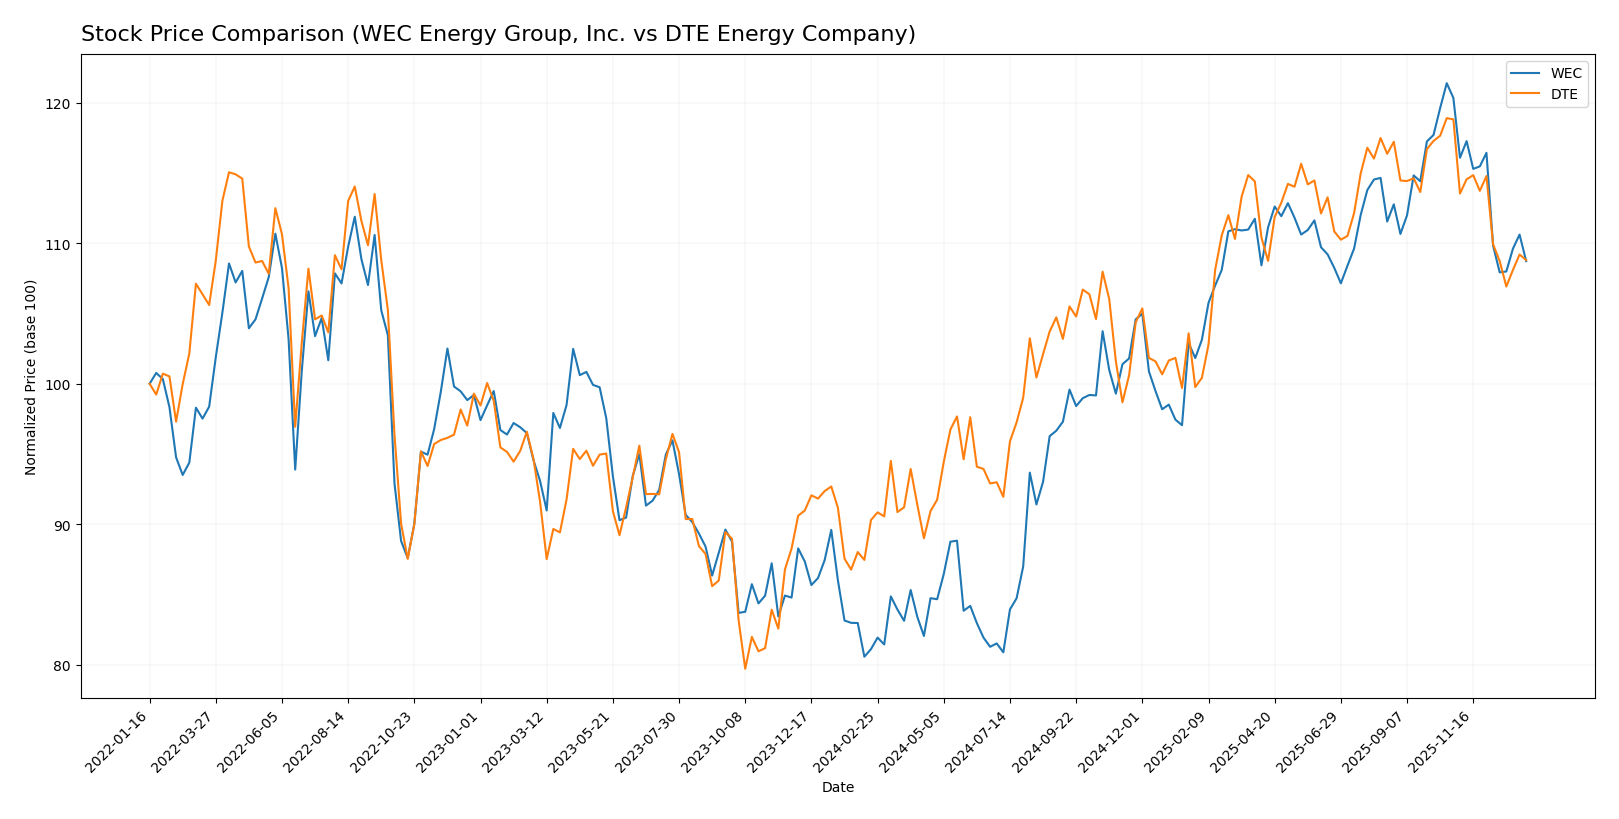
The past year has seen a marked bullish trend for both WEC Energy Group, Inc. and DTE Energy Company, with WEC showing a stronger price appreciation but both stocks experiencing recent downward pressure in late 2025 to early 2026.
Trend Analysis
WEC Energy Group, Inc. exhibited a bullish trend over the past 12 months with a 34.05% price increase, accompanied by decelerating momentum and a standard deviation of 11.44. The stock ranged between 77.85 and 116.84, though recent weeks showed a 9.65% decline.
DTE Energy Company also posted a bullish trend for the year, with a 20.49% gain and deceleration in trend acceleration. Its price fluctuated from 106.25 to 141.95, but similarly fell 8.42% in the recent quarter ending January 2026.
Comparing the two, WEC delivered the highest market performance with a 34.05% rise versus DTE’s 20.49%, despite both stocks facing short-term downward trends in late 2025 and early 2026.
Target Prices
The target price consensus for WEC Energy Group, Inc. and DTE Energy Company reflects optimistic analyst expectations.
| Company | Target High | Target Low | Consensus |
|---|---|---|---|
| WEC Energy Group, Inc. | 136 | 105 | 122.67 |
| DTE Energy Company | 157 | 138 | 148.29 |
Analysts see upside potential with WEC’s consensus target about 17% above its current price of $104.65, while DTE’s consensus target suggests roughly 14% appreciation from $129.89. This indicates generally positive outlooks for both utilities.
Analyst Opinions Comparison
This section compares analysts’ ratings and financial scores for WEC Energy Group, Inc. (WEC) and DTE Energy Company (DTE):
Rating Comparison
WEC Rating
- Rating: B- indicating a very favorable overall evaluation.
- Discounted Cash Flow Score: 1, considered very unfavorable for valuation.
- ROE Score: 4, a favorable indicator of efficient profit generation.
- ROA Score: 4, favorable for effective asset utilization.
- Debt To Equity Score: 2, moderate financial risk with some leverage.
- Overall Score: 3, a moderate overall financial standing.
DTE Rating
- Rating: C indicating a very favorable overall evaluation.
- Discounted Cash Flow Score: 1, considered very unfavorable for valuation.
- ROE Score: 3, moderate efficiency in profit generation.
- ROA Score: 2, moderate asset utilization efficiency.
- Debt To Equity Score: 1, very unfavorable indicating higher financial risk.
- Overall Score: 2, moderate overall financial standing but lower than WEC.
Which one is the best rated?
Based strictly on the provided data, WEC holds a higher overall score and stronger profitability and asset use scores than DTE. Both share a very favorable rating status, but WEC’s ratings and scores suggest a comparatively stronger financial profile.
Scores Comparison
Here is a comparison of the Altman Z-Score and Piotroski Score for both companies:
WEC Scores
- Altman Z-Score: 1.14, in distress zone indicating high bankruptcy risk.
- Piotroski Score: 6, average financial strength.
DTE Scores
- Altman Z-Score: 1.03, in distress zone indicating high bankruptcy risk.
- Piotroski Score: 7, strong financial strength.
Which company has the best scores?
DTE has a slightly lower Altman Z-Score but both remain in the distress zone, indicating financial risk. However, DTE outperforms WEC on the Piotroski Score, showing stronger overall financial health according to this metric.
Grades Comparison
Here is a comparison of recent professional grades for WEC Energy Group, Inc. and DTE Energy Company:
WEC Energy Group, Inc. Grades
The following table summarizes recent grades assigned by reputable financial institutions for WEC Energy Group, Inc.:
| Grading Company | Action | New Grade | Date |
|---|---|---|---|
| B of A Securities | Maintain | Neutral | 2025-12-31 |
| UBS | Maintain | Neutral | 2025-12-17 |
| Barclays | Maintain | Underweight | 2025-12-16 |
| Keybanc | Maintain | Overweight | 2025-12-12 |
| JP Morgan | Maintain | Neutral | 2025-12-11 |
| Scotiabank | Maintain | Sector Outperform | 2025-10-31 |
| BMO Capital | Maintain | Market Perform | 2025-10-21 |
| Barclays | Maintain | Equal Weight | 2025-10-21 |
| Keybanc | Maintain | Overweight | 2025-10-15 |
| UBS | Maintain | Neutral | 2025-10-10 |
WEC’s grades show a stable pattern with most institutions maintaining a neutral or hold stance, while a few suggest overweight or sector outperform ratings.
DTE Energy Company Grades
The following table presents recent grades assigned by verified grading firms for DTE Energy Company:
| Grading Company | Action | New Grade | Date |
|---|---|---|---|
| BMO Capital | Maintain | Market Perform | 2025-12-24 |
| UBS | Maintain | Buy | 2025-12-17 |
| JP Morgan | Maintain | Neutral | 2025-12-11 |
| Jefferies | Upgrade | Buy | 2025-12-11 |
| B of A Securities | Maintain | Buy | 2025-11-05 |
| Scotiabank | Maintain | Sector Perform | 2025-10-31 |
| Morgan Stanley | Maintain | Overweight | 2025-10-22 |
| Barclays | Maintain | Equal Weight | 2025-10-14 |
| UBS | Maintain | Buy | 2025-10-10 |
| Scotiabank | Downgrade | Sector Perform | 2025-10-03 |
DTE’s grades indicate a generally positive outlook with multiple buy and overweight ratings, alongside stable sector perform assessments.
Which company has the best grades?
DTE Energy Company has received more favorable grades overall, including multiple buy ratings and upgrades, compared to WEC Energy Group’s predominantly neutral and hold grades. This suggests a more optimistic analyst sentiment toward DTE, potentially reflecting investor interest in growth or value opportunities.
Strengths and Weaknesses
Below is a comparison of key strengths and weaknesses for WEC Energy Group, Inc. (WEC) and DTE Energy Company (DTE) based on their latest financial and operational data.
| Criterion | WEC Energy Group, Inc. (WEC) | DTE Energy Company (DTE) |
|---|---|---|
| Diversification | Moderate: Revenue mainly from Wisconsin (6.33B) and Illinois (1.6B), limited non-utility segment (0.69B). | High: Diverse segments including Electric (5.82B), Gas (1.75B), Energy Trading (4.61B), and DTE Vantage (0.81B). |
| Profitability | Net margin 17.77% (favorable), ROE 12.3% (neutral), ROIC 4.14% (unfavorable, below WACC 5.3%). | Net margin 11.27% (favorable), ROE 12% (neutral), ROIC 4.65% (unfavorable, below WACC 5.08%). |
| Innovation | Moderate focus with stable infrastructure investments, but limited growth in non-utility innovation. | Stronger innovation presence via DTE Vantage and Energy Trading segments supporting growth. |
| Global presence | Primarily regional (Midwest USA), limited international footprint. | Also regional with no major global exposure, focused on US energy markets. |
| Market Share | Strong in Wisconsin and Illinois utility markets, steady revenue growth. | Leading in Michigan with diversified energy offerings and expanding trading operations. |
Key takeaways: Both WEC and DTE show growing profitability but currently operate with ROIC below their cost of capital, indicating value destruction despite improving trends. DTE benefits from greater diversification and innovation, while WEC has a concentrated but stable market presence. Caution is advised given their slightly unfavorable overall financial efficiency.
Risk Analysis
Below is a risk comparison table for WEC Energy Group, Inc. (WEC) and DTE Energy Company (DTE) based on their most recent financial and operational data from 2024.
| Metric | WEC Energy Group, Inc. | DTE Energy Company |
|---|---|---|
| Market Risk | Beta 0.573 (low volatility) | Beta 0.484 (lower volatility) |
| Debt level | Debt-to-Equity 1.64 (unfavorable) | Debt-to-Equity 1.99 (unfavorable) |
| Regulatory Risk | Moderate (regulated utility sector) | Moderate (regulated utility sector) |
| Operational Risk | Aging infrastructure, asset turnover low | Aging infrastructure, slightly better asset turnover |
| Environmental Risk | Exposure to fossil fuels, transition risks | Similar fossil fuel exposure, increasing renewables |
| Geopolitical Risk | Low (US-based operations) | Low (US-based operations) |
The most impactful and likely risks for both companies stem from high debt levels and operational challenges related to aging infrastructure and transitioning energy sources. Both are in the distress zone per Altman Z-Score, indicating financial vulnerability, despite having stable market risk profiles. Environmental transition pressures remain a significant medium-term concern.
Which Stock to Choose?
WEC Energy Group, Inc. shows a slightly unfavorable global ratios opinion despite favorable net margin and dividend yield. Its income statement is strongly favorable with positive growth in earnings and margins. The company carries moderate debt with neutral interest coverage and a B- rating reflecting moderate overall scores but very favorable rating status.
DTE Energy Company also presents a slightly unfavorable ratios profile with favorable net margin but unfavorable debt-to-equity and limited liquidity. Its income statement evaluation is unfavorable overall, with declining net margin and EPS growth. The firm has a C rating with moderate overall scores and very favorable rating status, alongside a strong Piotroski score but distress zone Altman Z-Score.
Investors prioritizing growth and stable profitability might find WEC more favorable given its stronger income statement and moderate rating. Conversely, those focusing on financial strength and efficiency could interpret DTE’s strong Piotroski score as a positive sign despite its income challenges. Both companies show value destruction per MOAT analysis but with improving profitability trends.
Disclaimer: Investment carries a risk of loss of initial capital. The past performance is not a reliable indicator of future results. Be sure to understand risks before making an investment decision.
Go Further
I encourage you to read the complete analyses of WEC Energy Group, Inc. and DTE Energy Company to enhance your investment decisions: