In the evolving utilities sector, The Southern Company (SO) and DTE Energy Company (DTE) stand out as key players with overlapping markets and innovative energy strategies. Both focus on regulated electric services and renewable energy development, addressing growing demand for sustainable power. Comparing these giants reveals insights into their operational strengths and growth potential. Join me as we analyze which company presents a more compelling opportunity for your investment portfolio in 2026.
Table of contents
Companies Overview
I will begin the comparison between The Southern Company and DTE Energy Company by providing an overview of these two companies and their main differences.
The Southern Company Overview
The Southern Company operates primarily in the regulated electric industry, focusing on the generation, transmission, and distribution of electricity. It serves around 8.7M electric and gas utility customers across several states and manages a diverse portfolio of power generation assets including renewable energy projects. Headquartered in Atlanta, Georgia, it also offers natural gas distribution and digital wireless communications services.
DTE Energy Company Overview
DTE Energy Company is a utility firm serving approximately 2.3M electric and 1.3M natural gas customers mainly in southeastern Michigan. Its operations include electricity generation from fossil-fuel, hydroelectric, nuclear, and renewable sources, alongside extensive natural gas distribution infrastructure. Founded in 1903 and based in Detroit, Michigan, DTE also provides industrial energy services and engages in energy trading activities.
Key similarities and differences
Both companies operate in the regulated electric utility sector and manage a mix of traditional and renewable energy assets. The Southern Company is larger by market cap and customer base, with a broader geographic reach and additional gas pipeline investments. DTE Energy has a more concentrated regional presence with diversified segments including industrial energy services and energy trading, reflecting slightly different business models within the same industry.
Income Statement Comparison
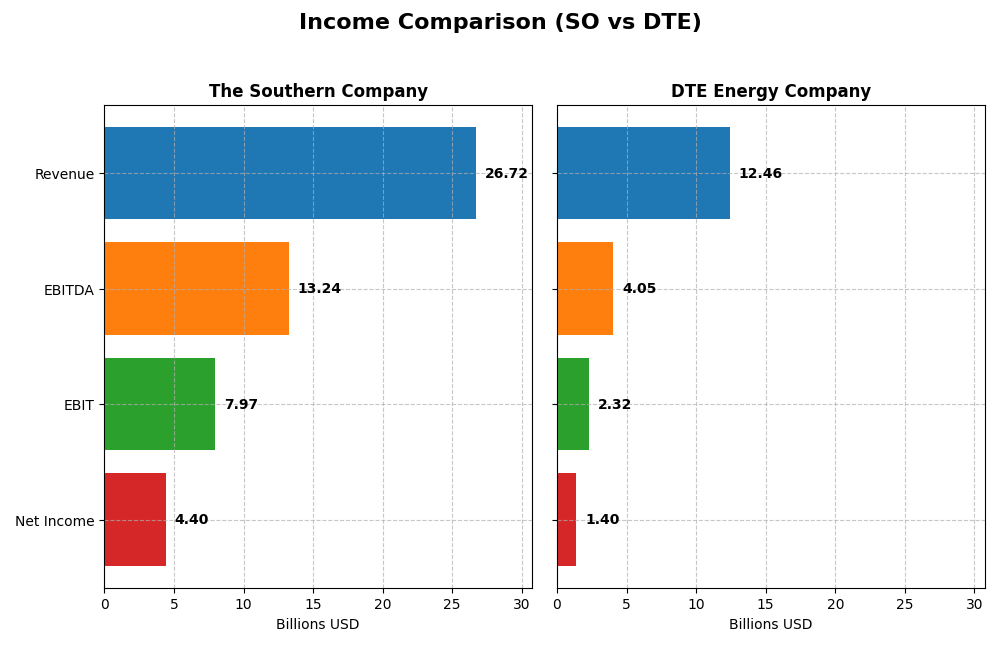
The table below presents a side-by-side comparison of key income statement metrics for The Southern Company and DTE Energy Company for the fiscal year 2024.
| Metric | The Southern Company (SO) | DTE Energy Company (DTE) |
|---|---|---|
| Market Cap | 95.7B | 27.0B |
| Revenue | 26.7B | 12.5B |
| EBITDA | 13.2B | 4.1B |
| EBIT | 7.97B | 2.32B |
| Net Income | 4.40B | 1.40B |
| EPS | 4.02 | 6.78 |
| Fiscal Year | 2024 | 2024 |
Income Statement Interpretations
The Southern Company
From 2020 to 2024, The Southern Company showed a 31.16% growth in revenue and a 40.43% increase in net income, reflecting solid expansion. Margins remained favorable, with a gross margin near 50% and an EBIT margin around 30%. In 2024, revenue growth slowed to 5.83%, but gross profit and EBIT margins improved, supporting a positive overall performance.
DTE Energy Company
DTE Energy experienced moderate revenue growth of 9.05% over the 2020-2024 period, but net income growth was limited to 2.41%, with a slight net margin decline. Margins held steady with a 34.82% gross margin and an 18.63% EBIT margin. However, 2024 showed a 2.26% revenue drop and a marginal EBIT decline, indicating some recent operational challenges.
Which one has the stronger fundamentals?
The Southern Company demonstrates stronger fundamentals, benefiting from higher and improving margins, robust net income growth, and a favorable income statement evaluation of 71.43% favorable metrics. In contrast, DTE Energy’s fundamentals appear weaker, with an unfavorable overall income statement opinion and lower growth rates, reflecting more operational and margin pressures.
Financial Ratios Comparison
The table below presents a side-by-side comparison of key financial ratios for The Southern Company (SO) and DTE Energy Company (DTE) based on their most recent fiscal year data ending 2024.
| Ratios | The Southern Company (SO) | DTE Energy Company (DTE) |
|---|---|---|
| ROE | 13.3% | 12.0% |
| ROIC | 4.3% | 4.6% |
| P/E | 20.5 | 17.8 |
| P/B | 2.72 | 2.14 |
| Current Ratio | 0.67 | 0.71 |
| Quick Ratio | 0.46 | 0.46 |
| D/E (Debt/Equity) | 2.00 | 1.99 |
| Debt-to-Assets | 45.7% | 47.6% |
| Interest Coverage | 2.58 | 2.20 |
| Asset Turnover | 0.18 | 0.26 |
| Fixed Asset Turnover | 0.25 | 0.40 |
| Payout Ratio | 67.1% | 57.7% |
| Dividend Yield | 3.27% | 3.24% |
Interpretation of the Ratios
The Southern Company
The Southern Company shows a mix of strong and weak ratios. Its net margin and dividend yield are favorable, supporting profitability and shareholder income. However, concerns arise from unfavorable leverage, liquidity ratios, and asset efficiency, indicating operational challenges. The company pays dividends with a 3.27% yield, suggesting steady shareholder returns but caution is warranted due to some financial weaknesses.
DTE Energy Company
DTE Energy’s ratios reveal a balanced but slightly unfavorable position. It has favorable net margin and WACC, but like its peer, it struggles with liquidity and asset turnover ratios. DTE also pays dividends with a 3.24% yield, reflecting consistent income for investors. The presence of unfavorable leverage and coverage ratios highlights potential risks in financial stability and operational efficiency.
Which one has the best ratios?
Both companies share a similar profile with slightly unfavorable global ratio evaluations, each having 21.43% favorable and 42.86% unfavorable ratios. The Southern Company excels more in net margin, while DTE shows better fixed asset turnover. Overall, neither stands out decisively, as both face challenges in liquidity and leverage metrics alongside moderate profitability.
Strategic Positioning
This section compares the strategic positioning of SO and DTE, including Market position, Key segments, and Exposure to technological disruption:
SO
- Large market cap at 95.7B with broad geographic service area in several states; faces regulated electric industry competition.
- Diverse revenue streams: electric utilities, Southern Company Gas operations, renewable assets, and gas marketing services.
- Operates multiple generation types including fossil fuel, nuclear, hydro, wind, solar, and battery storage facilities.
DTE
- Smaller market cap of 27B, focused on southeastern Michigan with regulated electric utility competition.
- Key segments include electric and gas utilities, energy trading, and industrial projects.
- Generates electricity via fossil fuel, nuclear, hydroelectric, wind, plus active energy trading.
SO vs DTE Positioning
SO exhibits a more diversified business model across multiple states and energy sources, while DTE concentrates on Michigan with significant energy trading activity. SO’s broader asset base offers scale, whereas DTE’s specialized trading segment adds revenue complexity.
Which has the best competitive advantage?
Both SO and DTE are currently shedding value with ROIC below WACC, but both show growing ROIC trends. Neither has a clearly strong moat; they share a slightly unfavorable moat status indicating limited competitive advantages.
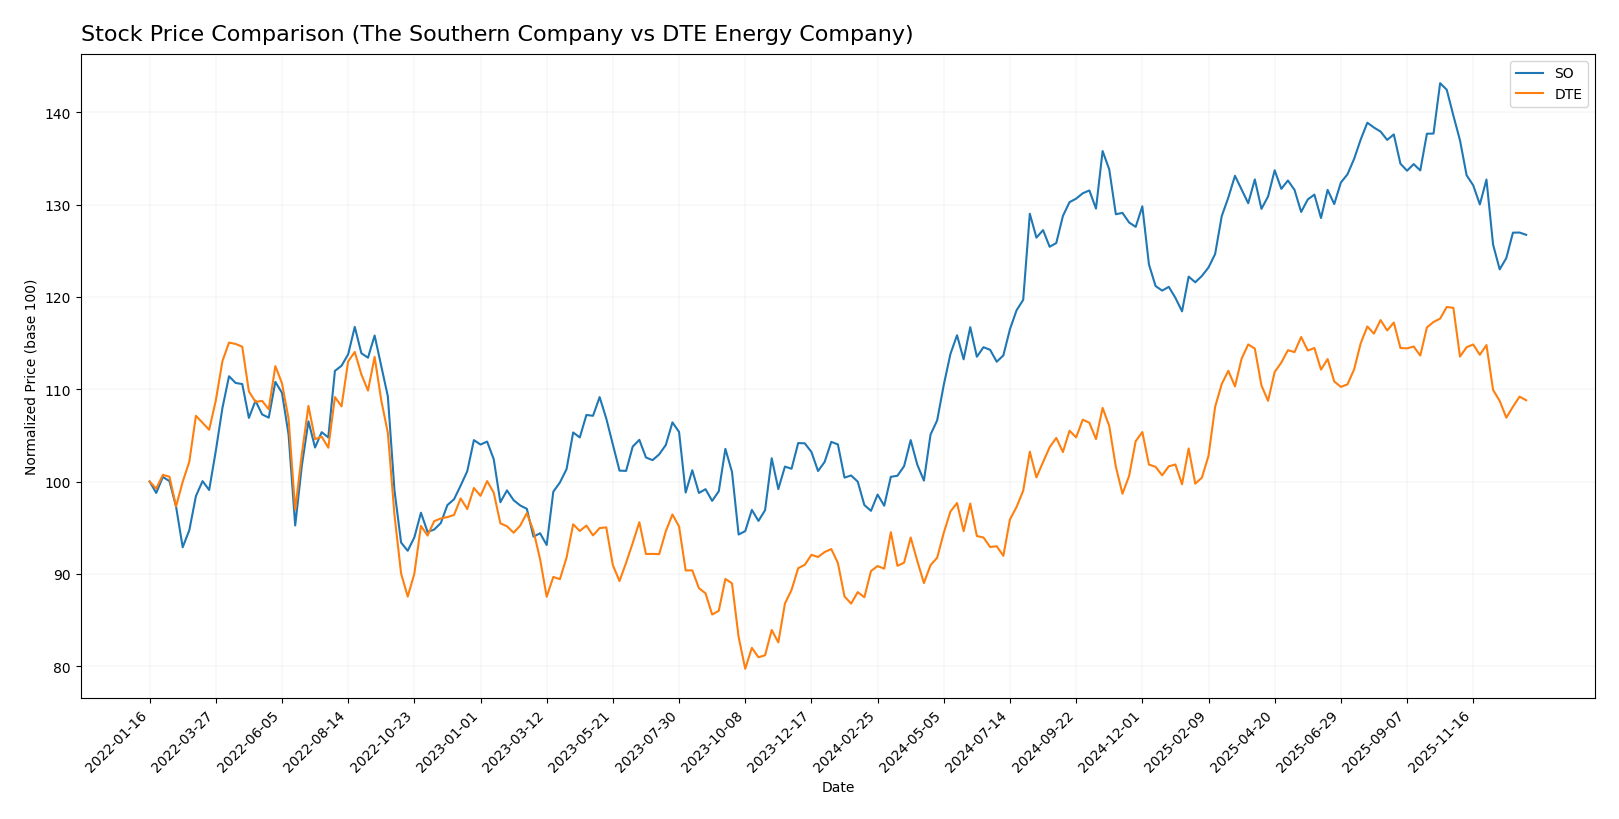
Stock Comparison
The stock price chart highlights significant bullish trends over the past 12 months for both The Southern Company and DTE Energy Company, with notable deceleration in momentum and recent downward corrections in trading dynamics.
Trend Analysis
The Southern Company exhibited a 30.88% price increase over the past year, indicating a bullish trend with decelerating momentum. The stock fluctuated between a low of 66.48 and a high of 98.29, with a recent 9.25% decline signaling a short-term bearish correction.
DTE Energy Company showed a 20.49% price increase over the same period, also reflecting a bullish trend with deceleration. Its price ranged from 106.25 to 141.95, followed by a recent 8.42% decrease, suggesting a short-term bearish phase.
Comparatively, The Southern Company delivered the highest market performance with a stronger overall price gain, despite both stocks experiencing recent downward trends and seller-dominant trading behavior.
Target Prices
Analysts present a clear target price consensus for both The Southern Company and DTE Energy Company.
| Company | Target High | Target Low | Consensus |
|---|---|---|---|
| The Southern Company | 103 | 76 | 93.1 |
| DTE Energy Company | 157 | 138 | 148.29 |
The Southern Company’s consensus target price of 93.1 suggests a moderate upside from its current 87.01 USD, while DTE Energy’s consensus of 148.29 indicates a significant potential increase above the current 129.89 USD stock price. Both show favorable analyst expectations.
Analyst Opinions Comparison
This section compares analysts’ ratings and grades for The Southern Company and DTE Energy Company:
Rating Comparison
The Southern Company Rating
- Rating: B-, considered very favorable overall
- Discounted Cash Flow Score: Moderate at 3
- ROE Score: Favorable at 4
- ROA Score: Moderate at 3
- Debt To Equity Score: Very unfavorable at 1
- Overall Score: Moderate at 3
DTE Energy Company Rating
- Rating: C, considered very favorable overall
- Discounted Cash Flow Score: Very unfavorable at 1
- ROE Score: Moderate at 3
- ROA Score: Moderate at 2
- Debt To Equity Score: Very unfavorable at 1
- Overall Score: Moderate at 2
Which one is the best rated?
Based strictly on the provided data, The Southern Company holds a higher rating (B-) and scores better on discounted cash flow, ROE, ROA, and overall score compared to DTE Energy Company, which has a lower rating (C) and weaker DCF and overall scores.
Scores Comparison
Here is a comparison of the Altman Z-Score and Piotroski Score for both companies:
SO Scores
- Altman Z-Score: 0.98, indicating financial distress.
- Piotroski Score: 6, classified as average financial strength.
DTE Scores
- Altman Z-Score: 1.03, also indicating financial distress.
- Piotroski Score: 7, classified as strong financial strength.
Which company has the best scores?
DTE shows a slightly higher Altman Z-Score but still in distress, and a stronger Piotroski Score than SO. Based on these scores alone, DTE exhibits better financial health.
Grades Comparison
Here is a comparison of the recent grades assigned to The Southern Company and DTE Energy Company by recognized grading firms:
The Southern Company Grades
The following table summarizes recent grades from major financial institutions for The Southern Company:
| Grading Company | Action | New Grade | Date |
|---|---|---|---|
| UBS | Maintain | Neutral | 2025-12-17 |
| JP Morgan | Maintain | Neutral | 2025-12-15 |
| Jefferies | Maintain | Neutral | 2025-12-15 |
| RBC Capital | Maintain | Sector Perform | 2025-12-12 |
| Keybanc | Maintain | Underweight | 2025-12-12 |
| Mizuho | Maintain | Neutral | 2025-12-11 |
| Barclays | Maintain | Equal Weight | 2025-11-20 |
| Jefferies | Downgrade | Neutral | 2025-11-05 |
| Ladenburg Thalmann | Downgrade | Neutral | 2025-10-17 |
| Keybanc | Maintain | Underweight | 2025-10-15 |
The grades for The Southern Company mostly indicate a neutral or hold stance, with some underweight ratings and recent downgrades from buy to neutral.
DTE Energy Company Grades
The following table summarizes recent grades from major financial institutions for DTE Energy Company:
| Grading Company | Action | New Grade | Date |
|---|---|---|---|
| BMO Capital | Maintain | Market Perform | 2025-12-24 |
| UBS | Maintain | Buy | 2025-12-17 |
| JP Morgan | Maintain | Neutral | 2025-12-11 |
| Jefferies | Upgrade | Buy | 2025-12-11 |
| B of A Securities | Maintain | Buy | 2025-11-05 |
| Scotiabank | Maintain | Sector Perform | 2025-10-31 |
| Morgan Stanley | Maintain | Overweight | 2025-10-22 |
| Barclays | Maintain | Equal Weight | 2025-10-14 |
| UBS | Maintain | Buy | 2025-10-10 |
| Scotiabank | Downgrade | Sector Perform | 2025-10-03 |
DTE Energy Company’s grades tend to be more positive, with multiple buy ratings, an upgrade from hold to buy, and several sector outperform or overweight stances.
Which company has the best grades?
DTE Energy Company consistently receives stronger grades, with numerous buy recommendations and upgrades, compared to The Southern Company’s predominantly neutral and underweight ratings. This suggests DTE may be viewed more favorably by analysts, potentially reflecting greater confidence or growth prospects.
Strengths and Weaknesses
Below is a comparison of key strengths and weaknesses between The Southern Company (SO) and DTE Energy Company (DTE) based on their recent financial and operational data.
| Criterion | The Southern Company (SO) | DTE Energy Company (DTE) |
|---|---|---|
| Diversification | Moderate, with revenue mainly from gas distribution (3.9B) and electric utilities (~23B USD) | More diversified, including electric (5.8B), gas (1.75B), energy trading (4.6B), and DTE Vantage (0.8B USD) |
| Profitability | Net margin 16.47% (favorable), ROIC 4.25% (unfavorable), ROE 13.25% (neutral) | Net margin 11.27% (favorable), ROIC 4.65% (unfavorable), ROE 12.0% (neutral) |
| Innovation | Limited data on innovation; traditional utility focus with growing ROIC trend | Moderate innovation focus via DTE Vantage and energy trading segments with growing ROIC trend |
| Global presence | Primarily US-focused operations | Primarily US-focused with notable energy trading activities |
| Market Share | Large regional utility with substantial electric and gas market share | Strong regional presence with diversified energy services and trading footprint |
Key takeaways: Both SO and DTE show slightly unfavorable MOATs with value destruction but improving profitability. DTE benefits from greater diversification and energy trading, while SO has a larger scale in electric utilities. Both have room to improve capital efficiency and liquidity ratios.
Risk Analysis
Below is a comparison of key risks facing The Southern Company (SO) and DTE Energy Company (DTE) as of 2024:
| Metric | The Southern Company (SO) | DTE Energy Company (DTE) |
|---|---|---|
| Market Risk | Moderate, beta 0.447 indicates lower volatility | Moderate, beta 0.484 indicates moderate volatility |
| Debt Level | High leverage: Debt-to-Equity ~2.0 (unfavorable) | High leverage: Debt-to-Equity ~1.99 (unfavorable) |
| Regulatory Risk | Significant in regulated electric utilities | Significant in regulated electric utilities |
| Operational Risk | Complex asset base with nuclear, gas, renewables | Diverse generation mix with fossil, nuclear, renewables |
| Environmental Risk | Exposure to fossil fuel regulations; growing renewables | Similar exposure, expanding renewables portfolio |
| Geopolitical Risk | Low direct exposure, mostly US-focused | Low direct exposure, mostly US-focused |
The most critical risks are high debt levels for both companies, raising financial risk despite stable market positions. Regulatory changes on emissions and energy policies remain impactful, especially as both firms transition to renewables. Operational complexity adds moderate risk, but geographic concentration limits geopolitical concerns.
Which Stock to Choose?
The Southern Company (SO) shows a favorable income evolution with 31.16% revenue growth over 2020-2024 and a 16.47% net margin. Its financial ratios are slightly unfavorable overall, with concerns on leverage and liquidity. Profitability is moderate, with a 13.25% ROE and value destruction indicated by ROIC below WACC. SO’s rating is very favorable (B-), but Altman Z-Score signals financial distress.
DTE Energy Company (DTE) presents an unfavorable income evolution, marked by a slight revenue decline recently and a net margin of 11.25%. Financial ratios also appear slightly unfavorable, with moderate profitability and ROIC below WACC, signaling value destruction. Its rating matches SO’s in favorability (C), while its Altman Z-Score suggests similar financial distress but a stronger Piotroski score.
Investors seeking growth might find SO’s favorable income growth and solid rating appealing, while those valuing financial strength could view DTE’s stronger Piotroski score as an indicator of resilience despite its less robust income trend. Both companies show value destruction by ROIC, implying caution is warranted.
Disclaimer: Investment carries a risk of loss of initial capital. The past performance is not a reliable indicator of future results. Be sure to understand risks before making an investment decision.
Go Further
I encourage you to read the complete analyses of The Southern Company and DTE Energy Company to enhance your investment decisions: