Public Service Enterprise Group Incorporated (PEG) and DTE Energy Company (DTE) are two prominent players in the regulated electric utility sector in the United States. Both companies serve millions of customers with a mix of traditional and renewable energy sources, reflecting strong commitments to innovation and sustainability. Their overlapping markets and strategic approaches make them compelling candidates for comparison. In this article, I will help you determine which company presents the most attractive investment opportunity.
Table of contents
Companies Overview
I will begin the comparison between Public Service Enterprise Group Incorporated and DTE Energy Company by providing an overview of these two companies and their main differences.
Public Service Enterprise Group Incorporated Overview
Public Service Enterprise Group Incorporated (PEG) operates as an energy company primarily in the Northeastern and Mid-Atlantic United States. It focuses on electricity transmission and distribution, gas services, solar generation projects, and energy efficiency programs. The company manages extensive infrastructure, including 25,000 circuit miles of electric transmission and 18,000 miles of gas mains, positioning itself as a key regulated electric utility in its region.
DTE Energy Company Overview
DTE Energy Company (DTE) serves southeastern Michigan with electricity and natural gas to millions of residential, commercial, and industrial customers. Its operations include fossil-fuel, nuclear, hydroelectric, and renewable power generation, along with significant natural gas distribution infrastructure. DTE also provides industrial services and engages in energy trading, reflecting a diversified approach in the utilities sector.
Key similarities and differences
Both PEG and DTE operate in the regulated electric utility industry and provide electricity and natural gas to residential and commercial customers. However, PEG’s operations are concentrated in the Northeastern and Mid-Atlantic U.S., while DTE focuses on southeastern Michigan. PEG invests notably in solar projects and energy efficiency, whereas DTE has a broader portfolio including fossil-fuel and nuclear generation, industrial products, and energy trading activities.
Income Statement Comparison
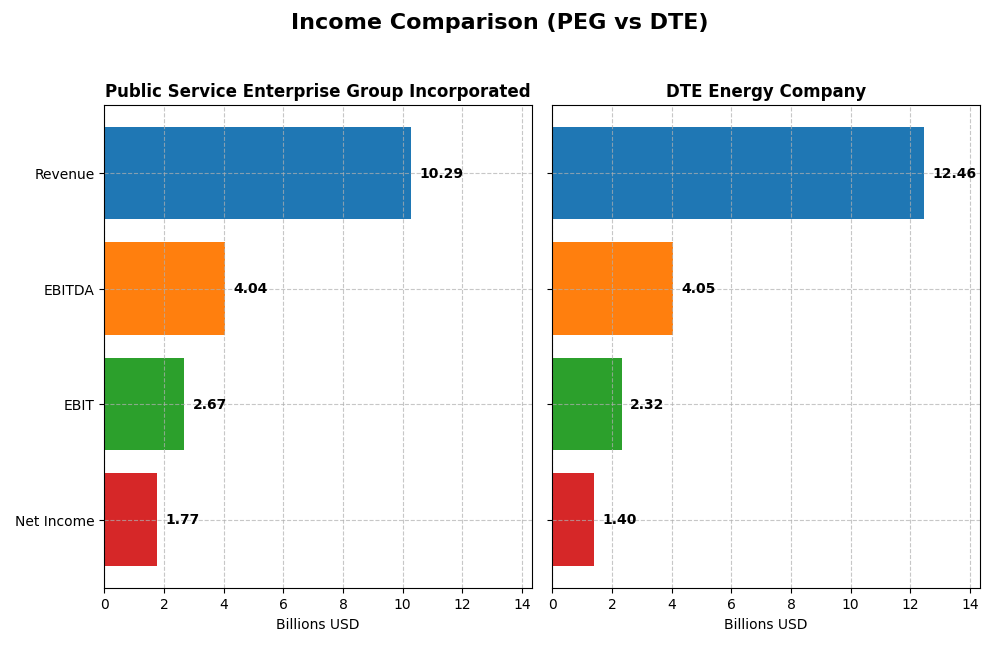
The table below compares the key income statement metrics for Public Service Enterprise Group Incorporated and DTE Energy Company for the fiscal year 2024.
| Metric | Public Service Enterprise Group Incorporated (PEG) | DTE Energy Company (DTE) |
|---|---|---|
| Market Cap | 39.3B | 27.0B |
| Revenue | 10.3B | 12.5B |
| EBITDA | 4.04B | 4.05B |
| EBIT | 2.67B | 2.32B |
| Net Income | 1.77B | 1.40B |
| EPS | 3.56 | 6.78 |
| Fiscal Year | 2024 | 2024 |
Income Statement Interpretations
Public Service Enterprise Group Incorporated
Public Service Enterprise Group Incorporated showed moderate revenue growth of 7.15% over 2020-2024 but faced an overall net income decline of 7%. Its gross margin remained favorable at 34.41%, with a solid EBIT margin of 25.91%. However, 2024 saw an 8.4% revenue drop and a 29% EBIT decline, reflecting weakening profitability and margin contraction.
DTE Energy Company
DTE Energy Company experienced a favorable 9.05% revenue increase over the five years and a slight net income growth of 2.4%. It maintained a steady gross margin of 34.82% and an EBIT margin of 18.63%. The 2024 fiscal year showed a small revenue decrease of 2.3% and a minor EBIT decline of 1.5%, but net margin and EPS growth remained stable or slightly improved.
Which one has the stronger fundamentals?
While both companies face recent revenue and earnings headwinds, DTE Energy displays more consistent top-line growth and steadier profitability margins. Public Service Enterprise Group’s sharper declines in net income and EBIT in 2024 contrast with DTE’s more moderate decreases and neutral to slightly positive margin trends. Overall, DTE exhibits comparatively stronger income statement fundamentals over the analyzed period.
Financial Ratios Comparison
The table below presents the most recent financial ratios for Public Service Enterprise Group Incorporated (PEG) and DTE Energy Company (DTE) as of fiscal year 2024, providing a snapshot of key profitability, liquidity, leverage, and efficiency metrics.
| Ratios | Public Service Enterprise Group Incorporated (PEG) | DTE Energy Company (DTE) |
|---|---|---|
| ROE | 11.0% | 12.0% |
| ROIC | 4.4% | 4.6% |
| P/E | 23.7 | 17.8 |
| P/B | 2.61 | 2.14 |
| Current Ratio | 0.65 | 0.71 |
| Quick Ratio | 0.48 | 0.46 |
| D/E | 1.42 | 1.99 |
| Debt-to-Assets | 41.9% | 47.6% |
| Interest Coverage | 2.80 | 2.20 |
| Asset Turnover | 0.19 | 0.26 |
| Fixed Asset Turnover | 0.26 | 0.40 |
| Payout ratio | 67.5% | 57.7% |
| Dividend yield | 2.84% | 3.24% |
Interpretation of the Ratios
Public Service Enterprise Group Incorporated
Public Service Enterprise Group shows a mixed ratio profile with strong net margin at 17.22% but unfavorable returns on invested capital (4.4%) and weak liquidity indicated by a current ratio of 0.65. Leverage appears high with a debt-to-equity ratio of 1.42. Dividend yield is favorable at 2.84%, suggesting consistent shareholder returns with a manageable payout risk.
DTE Energy Company
DTE Energy exhibits favorable net margin at 11.27% and a slightly better return on invested capital (4.65%) than its peer, yet liquidity remains a concern with a current ratio of 0.71. Debt levels are high with a debt-to-equity ratio of 1.99. The dividend yield of 3.24% is attractive, reflecting stable shareholder remuneration, though coverage may warrant monitoring.
Which one has the best ratios?
Both companies face similar challenges with liquidity and high leverage, reflected in unfavorable current and quick ratios and debt metrics. While Public Service Enterprise Group has a higher net margin, DTE Energy provides a higher dividend yield and slightly better asset turnover. Overall, their ratio profiles are comparably slightly unfavorable, with neither company distinctly outperforming across all key financial metrics.
Strategic Positioning
This section compares the strategic positioning of PEG and DTE, including market position, key segments, and exposure to technological disruption:
Public Service Enterprise Group Incorporated (PEG)
- Leading regulated electric utility in Northeastern and Mid-Atlantic US; faces standard regulated sector competition.
- Key segments include electric transmission, gas distribution, and solar projects; business driven by regulated services and energy efficiency.
- Moderate exposure via investments in solar generation and energy efficiency programs; traditional infrastructure dominates.
DTE Energy Company (DTE)
- Regional utility focused on southeastern Michigan with diverse competitors in electric and gas markets.
- Operates electric generation, gas distribution, energy trading, and industrial projects; business driven by multi-commodity energy services.
- Exposure includes renewable assets and energy trading; diverse energy sources reduce disruption risk.
PEG vs DTE Positioning
PEG’s approach centers on regulated electric and gas services in a defined geographic region with incremental renewable investments. DTE pursues a broader energy portfolio including power generation, gas, trading, and industrial projects, reflecting a more diversified strategy with varied revenue streams.
Which has the best competitive advantage?
Both PEG and DTE show slightly unfavorable MOATs due to ROIC below WACC but display growing profitability trends. DTE’s wider diversification and stronger ROIC growth suggest a modestly better competitive advantage under current evaluations.
Stock Comparison
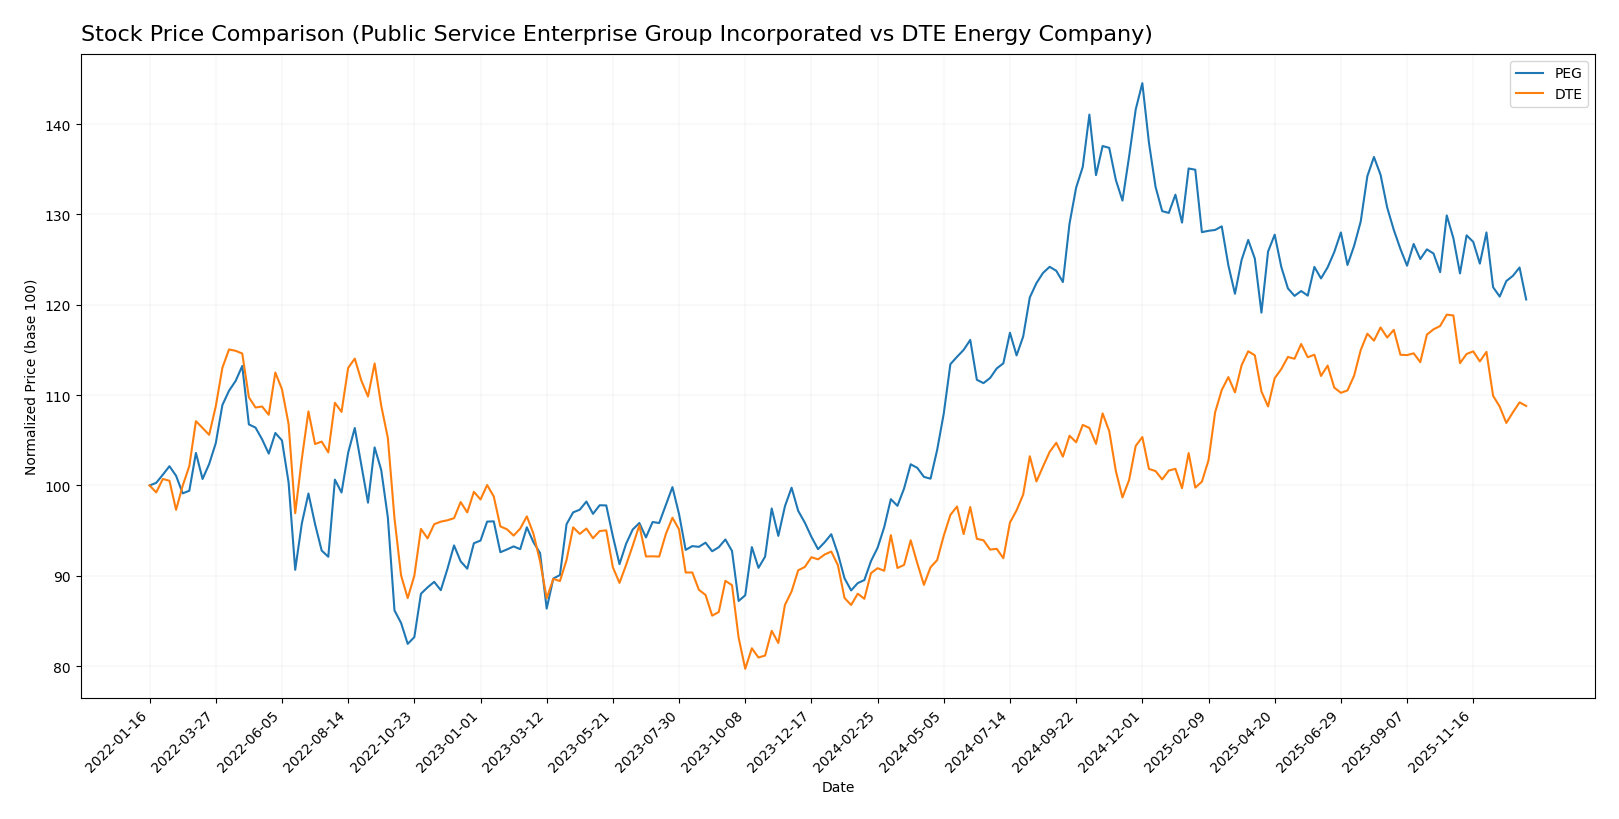
The stock prices of Public Service Enterprise Group Incorporated (PEG) and DTE Energy Company (DTE) show significant bullish gains over the past 12 months, with notable deceleration in upward momentum and recent downward corrections in trading dynamics.
Trend Analysis
Public Service Enterprise Group Incorporated (PEG) exhibited a bullish trend over the past year with a 31.59% price increase, showing deceleration in momentum and a recent moderate decline of -5.33% from October 2025 to January 2026.
DTE Energy Company (DTE) also followed a bullish trajectory with a 20.49% rise over the last 12 months, decelerating similarly and experiencing a sharper recent fall of -8.42% within the same recent period.
Comparing the two, PEG delivered the highest market performance over the past year with a larger percentage gain despite both stocks facing recent seller dominance and downward pressure.
Target Prices
Analysts present a clear consensus on target prices for Public Service Enterprise Group and DTE Energy Company.
| Company | Target High | Target Low | Consensus |
|---|---|---|---|
| Public Service Enterprise Group Incorporated | 98 | 83 | 89 |
| DTE Energy Company | 157 | 138 | 148.29 |
The target consensus for Public Service Enterprise Group is notably above its current price of 78.68 USD, indicating potential upside. Similarly, DTE Energy’s consensus target of 148.29 USD suggests room for growth from its current price of 129.89 USD.
Analyst Opinions Comparison
This section compares analysts’ ratings and grades for Public Service Enterprise Group Incorporated (PEG) and DTE Energy Company (DTE):
Rating Comparison
PEG Rating
- Rating: B-, classified as Very Favorable by analysts.
- Discounted Cash Flow Score: 1, indicating a Very Unfavorable valuation view.
- ROE Score: 4, rated Favorable for profit generation efficiency.
- ROA Score: 4, Favorable for effective asset utilization.
- Debt To Equity Score: 2, Moderate financial risk level.
- Overall Score: 3, Moderate overall financial standing.
DTE Rating
- Rating: C, also considered Very Favorable by analysts.
- Discounted Cash Flow Score: 1, showing a Very Unfavorable valuation.
- ROE Score: 3, seen as Moderate for generating shareholder returns.
- ROA Score: 2, Moderate for asset use effectiveness.
- Debt To Equity Score: 1, Very Unfavorable due to higher financial risk.
- Overall Score: 2, Moderate but lower overall standing than PEG.
Which one is the best rated?
PEG holds a better rating (B-) and higher overall score (3) compared to DTE’s rating (C) and overall score (2). PEG also scores more favorably on ROE, ROA, and debt management, indicating stronger financial metrics based on the provided data.
Scores Comparison
Here is a comparison of the financial scores for Public Service Enterprise Group Incorporated (PEG) and DTE Energy Company (DTE):
PEG Scores
- Altman Z-Score: 1.32, in distress zone indicating high bankruptcy risk.
- Piotroski Score: 7, classified as strong financial health.
DTE Scores
- Altman Z-Score: 1.03, in distress zone indicating high bankruptcy risk.
- Piotroski Score: 7, classified as strong financial health.
Which company has the best scores?
Both PEG and DTE are in the Altman Z-Score distress zone, signifying high bankruptcy risk. They share the same Piotroski Score of 7, reflecting equally strong financial health based on that metric.
Grades Comparison
Here is the grades comparison for Public Service Enterprise Group Incorporated and DTE Energy Company:
Public Service Enterprise Group Incorporated Grades
The table below shows recent grades and rating actions from several well-known grading companies for Public Service Enterprise Group Incorporated:
| Grading Company | Action | New Grade | Date |
|---|---|---|---|
| Ladenburg Thalmann | Buy | Buy | 2026-01-07 |
| UBS | Maintain | Buy | 2025-12-17 |
| JP Morgan | Maintain | Overweight | 2025-12-12 |
| Jefferies | Upgrade | Buy | 2025-11-06 |
| TD Cowen | Maintain | Buy | 2025-11-05 |
| BMO Capital | Maintain | Market Perform | 2025-11-04 |
| Barclays | Maintain | Equal Weight | 2025-10-21 |
| BMO Capital | Maintain | Market Perform | 2025-10-20 |
| Morgan Stanley | Maintain | Overweight | 2025-09-25 |
| BMO Capital | Maintain | Market Perform | 2025-08-06 |
The grades for Public Service Enterprise Group show a generally positive trend with multiple upgrades and sustained buy ratings from reputable firms.
DTE Energy Company Grades
The table below displays recent grades and rating actions from reliable grading companies for DTE Energy Company:
| Grading Company | Action | New Grade | Date |
|---|---|---|---|
| BMO Capital | Maintain | Market Perform | 2025-12-24 |
| UBS | Maintain | Buy | 2025-12-17 |
| JP Morgan | Maintain | Neutral | 2025-12-11 |
| Jefferies | Upgrade | Buy | 2025-12-11 |
| B of A Securities | Maintain | Buy | 2025-11-05 |
| Scotiabank | Maintain | Sector Perform | 2025-10-31 |
| Morgan Stanley | Maintain | Overweight | 2025-10-22 |
| Barclays | Maintain | Equal Weight | 2025-10-14 |
| UBS | Maintain | Buy | 2025-10-10 |
| Scotiabank | Downgrade | Sector Perform | 2025-10-03 |
The grades for DTE Energy Company are mixed, with some upgrades but also a recent downgrade, reflecting a more cautious stance overall.
Which company has the best grades?
Public Service Enterprise Group Incorporated has received stronger and more consistent buy and overweight ratings compared to DTE Energy Company’s mixed ratings, which include several hold and sector perform grades. This suggests that investors might interpret PEG’s outlook as more favorable, potentially impacting portfolio positioning.
Strengths and Weaknesses
Below is a comparison table highlighting key strengths and weaknesses of Public Service Enterprise Group Incorporated (PEG) and DTE Energy Company (DTE) based on recent financial and operational data.
| Criterion | Public Service Enterprise Group (PEG) | DTE Energy Company (DTE) |
|---|---|---|
| Diversification | Moderate diversification across electric, gas distribution, and transmission segments with steady revenues. | Well-diversified in electric, gas, energy trading, and renewable segments. |
| Profitability | Net margin strong at 17.22%, but ROIC (4.4%) below WACC (5.37%) indicating value destruction. | Net margin moderate at 11.27%, ROIC (4.65%) also below WACC (5.08%), value destruction but improving. |
| Innovation | Limited data on innovation; traditional utility focus with stable revenue streams. | Significant growth in energy trading and renewable ventures (DTE Vantage), indicating innovation. |
| Global presence | Primarily US-focused utility operations; no significant global footprint. | US-based with a focus on the Midwest; no major global presence but expanding energy trading. |
| Market Share | Strong regional presence in New Jersey and surrounding areas. | Strong market share in Michigan with growing influence in energy trading markets. |
Key takeaways: Both PEG and DTE are slightly unfavorable in value creation as their ROICs lag behind WACCs despite growing profitability. DTE shows more innovation and diversification, especially in energy trading, while PEG maintains steady core utility revenues. Investors should weigh growth potential against current value destruction risks.
Risk Analysis
Below is a comparative table of key risks for Public Service Enterprise Group Incorporated (PEG) and DTE Energy Company (DTE) based on the most recent 2024 data:
| Metric | Public Service Enterprise Group (PEG) | DTE Energy Company (DTE) |
|---|---|---|
| Market Risk | Beta 0.61 (moderate volatility) | Beta 0.48 (lower volatility) |
| Debt Level | Debt/Equity 1.42 (unfavorable) | Debt/Equity 1.99 (unfavorable) |
| Regulatory Risk | Moderate (regulated electric utility) | Moderate (regulated electric) |
| Operational Risk | Moderate (large infrastructure) | Moderate (diverse generation) |
| Environmental Risk | Exposure to fossil and renewables mix | Exposure to fossil and renewables |
| Geopolitical Risk | Low (US-focused operations) | Low (US-focused operations) |
The most significant risks for both PEG and DTE are elevated debt levels and operational complexities tied to large utility infrastructures. Both companies remain in the regulated electric sector, facing regulatory and environmental challenges. Their Altman Z-Scores place them in the distress zone, signaling caution due to financial stress despite strong operational scores. These factors require careful risk management for investors.
Which Stock to Choose?
Public Service Enterprise Group Incorporated (PEG) shows a declining income trend with a negative net margin growth of -24.5% last year and an unfavorable global income statement opinion. Its financial ratios are slightly unfavorable overall, reflecting moderate profitability and elevated debt levels. The company has a very favorable rating of B- but its Altman Z-Score places it in the distress zone, though its Piotroski Score indicates strong fundamentals.
DTE Energy Company (DTE) experienced a milder income decline with a -2.26% revenue drop last year, displaying a less unfavorable global income statement outlook. Its financial ratios share the slightly unfavorable status, with moderate profitability and higher debt-to-equity risk. DTE holds a very favorable rating of C and similarly falls in the distress zone by Altman Z-Score, while also maintaining a strong Piotroski Score.
Considering ratings and comprehensive financial evaluations, PEG’s stronger rating and solid profitability metrics might appeal to investors seeking some quality exposure, whereas DTE’s steadier income performance and modest growth could attract those favoring more stability. Thus, the choice between these stocks may appear contingent on whether an investor prioritizes potential quality or relative income resilience.
Disclaimer: Investment carries a risk of loss of initial capital. The past performance is not a reliable indicator of future results. Be sure to understand risks before making an investment decision.
Go Further
I encourage you to read the complete analyses of Public Service Enterprise Group Incorporated and DTE Energy Company to enhance your investment decisions: