In the evolving landscape of regulated electric utilities, DTE Energy Company and PPL Corporation stand out as key players shaping the sector’s future. Both companies serve millions of customers with a mix of traditional and renewable energy sources, reflecting their commitment to innovation and sustainability. Given their market overlap and strategic initiatives, this article will help you determine which company presents the most compelling investment opportunity for your portfolio.
Table of contents
Companies Overview
I will begin the comparison between DTE Energy Company and PPL Corporation by providing an overview of these two companies and their main differences.
DTE Energy Company Overview
DTE Energy Company operates in the regulated electric industry, serving approximately 2.3M electricity customers and 1.3M natural gas customers mainly in southeastern Michigan. Its Electric segment generates power using fossil fuels, nuclear, hydroelectric, wind, and other renewables. The Gas segment manages an extensive pipeline network and storage capacity. Founded in 1903 and headquartered in Detroit, DTE focuses on utility operations with a market cap of about 27B USD.
PPL Corporation Overview
PPL Corporation is a utility holding company providing electricity and natural gas services in the US and UK, with a customer base exceeding 2.7M across Kentucky, Pennsylvania, and southwestern Virginia. It operates two main segments: Kentucky Regulated and Pennsylvania Regulated, generating electricity from coal, gas, hydro, and solar sources. Founded in 1920 and based in Allentown, PPL has a market cap near 26B USD and emphasizes regulated utility services.
Key similarities and differences
Both DTE and PPL operate within the regulated electric utility sector, focusing on electricity and natural gas delivery. Each company manages generation assets spanning fossil fuels and renewable sources, but DTE has a broader energy mix including nuclear and wind, while PPL includes solar and coal generation. Customer bases differ in size and geography, with DTE concentrated in Michigan and PPL spread across multiple states and the UK. Their market caps are comparable, though PPL employs more staff.
Income Statement Comparison
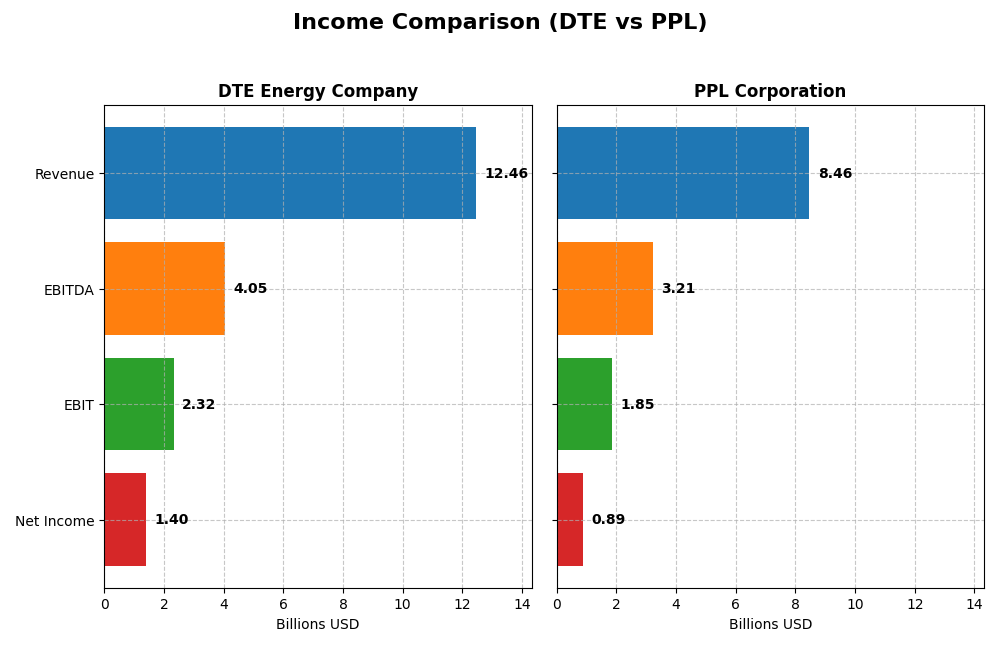
The table below presents a side-by-side comparison of key income statement metrics for DTE Energy Company and PPL Corporation for the fiscal year 2024.
| Metric | DTE Energy Company | PPL Corporation |
|---|---|---|
| Market Cap | 27B | 25.6B |
| Revenue | 12.46B | 8.46B |
| EBITDA | 4.05B | 3.21B |
| EBIT | 2.32B | 1.85B |
| Net Income | 1.40B | 888M |
| EPS | 6.78 | 1.20 |
| Fiscal Year | 2024 | 2024 |
Income Statement Interpretations
DTE Energy Company
DTE Energy’s revenue showed a modest overall growth of 9.05% from 2020 to 2024, but declined by 2.26% in the latest year. Net income grew slightly overall by 2.41%, with a stable net margin around 11.25%. The 2024 fiscal year saw a slight drop in EBIT and revenue, while net margins and EPS remained relatively steady, suggesting margin resilience despite top-line pressure.
PPL Corporation
PPL’s revenue increased significantly by 54.59% over the five-year period, with a 1.8% rise in 2024. Net income declined sharply overall by 39.55%, though net margin improved to 10.49%. The latest year posted strong EBIT growth of 16.6% and a 20% EPS increase, reflecting operational efficiency gains despite the challenging net income trend over the long term.
Which one has the stronger fundamentals?
PPL exhibits stronger recent earnings momentum and margin improvement, supported by a favorable 57.14% score in income statement metrics. However, its long-term net income decline and margin contraction are concerning. DTE shows steadier net income growth and stable margins but faces slight revenue and EBIT declines recently, resulting in a more cautious, unfavorable overall income statement view.
Financial Ratios Comparison
Below is a comparison of key financial ratios for DTE Energy Company and PPL Corporation based on their most recent fiscal year data available for 2024.
| Ratios | DTE Energy Company | PPL Corporation |
|---|---|---|
| ROE | 12.0% | 6.3% |
| ROIC | 4.6% | 3.6% |
| P/E | 17.8 | 27.0 |
| P/B | 2.14 | 1.70 |
| Current Ratio | 0.71 | 0.86 |
| Quick Ratio | 0.46 | 0.71 |
| D/E | 1.99 | 1.19 |
| Debt-to-Assets | 47.6% | 40.9% |
| Interest Coverage | 2.20 | 2.36 |
| Asset Turnover | 0.26 | 0.21 |
| Fixed Asset Turnover | 0.40 | 0.26 |
| Payout Ratio | 57.7% | 84.1% |
| Dividend Yield | 3.24% | 3.12% |
Interpretation of the Ratios
DTE Energy Company
DTE shows a mixed ratio profile with favorable net margin (11.27%) and dividend yield (3.24%), but concerns arise from its low current (0.71) and quick ratios (0.46), high debt-to-equity (1.99), and weak asset turnovers. Return on equity is neutral at 12.0%, while return on invested capital is unfavorable at 4.65%. The company pays dividends with a stable yield, indicating shareholder returns are supported but caution is needed due to financial leverage and liquidity.
PPL Corporation
PPL’s ratios present more unfavorable aspects, including a lower return on equity (6.31%) and return on invested capital (3.59%). The net margin (10.49%) and dividend yield (3.12%) are favorable, but liquidity ratios remain weak (current ratio 0.86, quick ratio 0.71). The price-to-earnings ratio is high at 26.97, which is unfavorable. PPL also pays dividends, but its higher leverage and valuation metrics suggest riskier financial conditions compared to peers.
Which one has the best ratios?
DTE holds a slightly unfavorable overall ratio assessment, with 21.43% favorable and 42.86% unfavorable ratios, while PPL faces a more unfavorable profile with 21.43% favorable and 57.14% unfavorable. DTE’s stronger returns and dividend yield contrast with PPL’s higher leverage and valuation risks, making DTE’s ratios relatively more balanced despite some liquidity and efficiency weaknesses.
Strategic Positioning
This section compares the strategic positioning of DTE Energy Company and PPL Corporation, covering market position, key segments, and exposure to technological disruption:
DTE Energy Company
- Strong presence in southeastern Michigan with 2.3M electric and 1.3M gas customers, facing regulated utility competition.
- Diverse business drivers: Electric, Gas, Energy Trading, and Industrial Projects with integrated energy supply and services.
- Utilizes a mix of fossil-fuel, nuclear, hydroelectric, wind, and renewables, with moderate risk from energy market shifts.
PPL Corporation
- Operates in US and UK, serving 2.3M electric and gas customers across Kentucky, Pennsylvania, and Rhode Island regions.
- Concentrated on regulated electricity segments in Kentucky, Pennsylvania, and Rhode Island, focusing on regional utilities.
- Generates electricity from coal, gas, hydro, and solar, with exposure to regulatory and technological changes in both US and UK markets.
DTE Energy Company vs PPL Corporation Positioning
DTE pursues a diversified strategy across electric, gas, trading, and industrial services, offering multiple revenue streams. PPL focuses on regulated regional electricity markets, concentrating its business but with geographic spread across two countries.
Which has the best competitive advantage?
Both companies exhibit slightly unfavorable moats due to ROIC below WACC but show improving profitability trends. Neither currently demonstrates a strong competitive advantage based on value creation metrics.
Stock Comparison
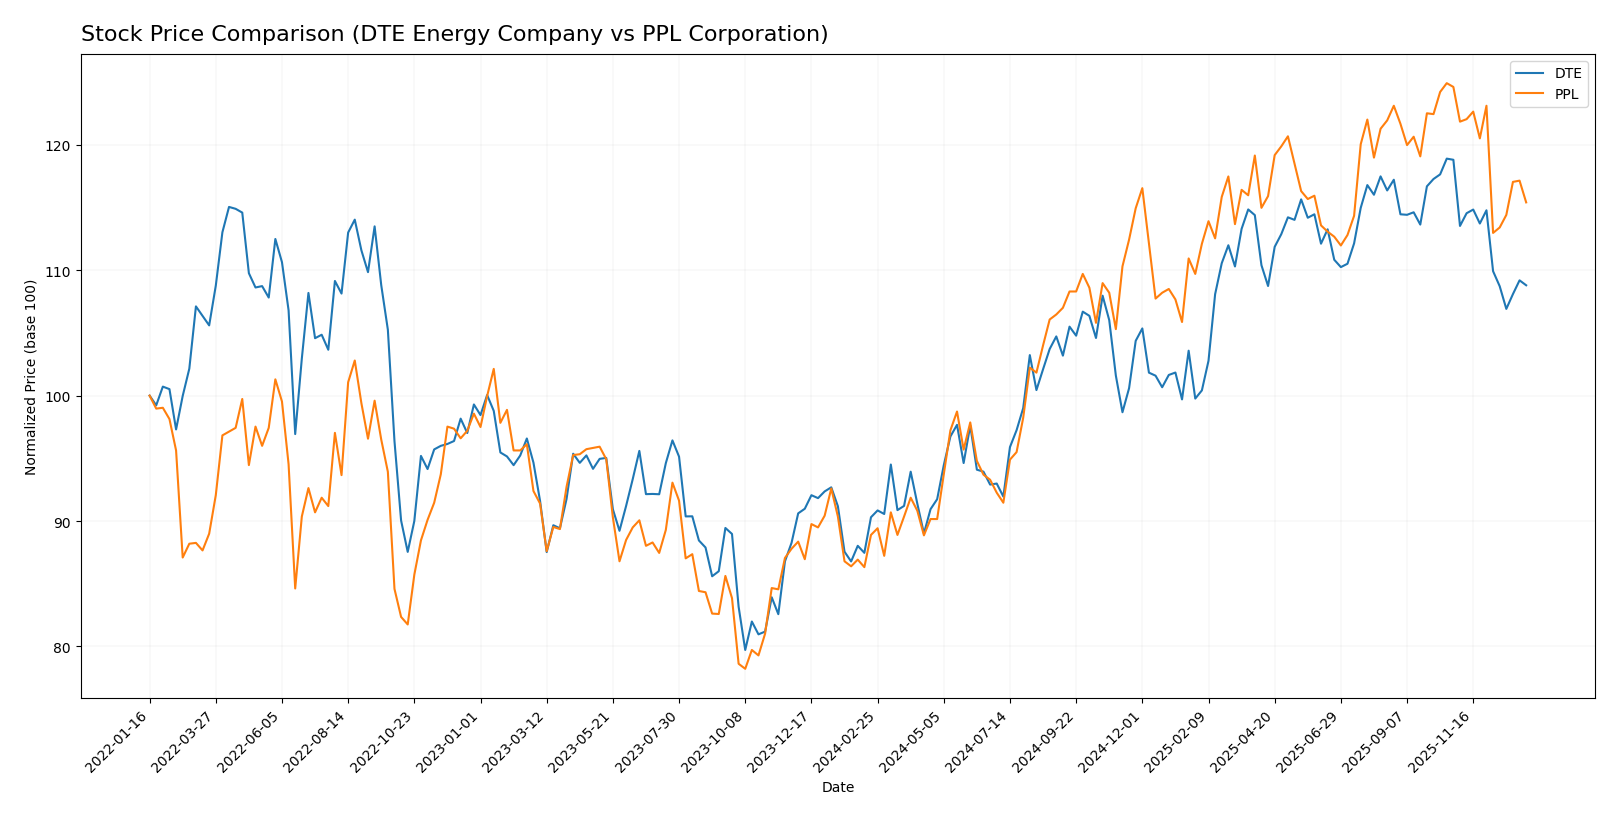
The past year has seen notable bullish trends for both DTE Energy Company and PPL Corporation, with DTE showing a 20.49% price increase and PPL a stronger 29.84% gain, although recent months reveal a downward correction in both stocks.
Trend Analysis
DTE Energy Company’s stock has exhibited a bullish trend over the past 12 months with a 20.49% price rise, though this growth is decelerating. The stock reached a high of 141.95 and a low of 106.25, with volatility indicated by a 10.2 standard deviation.
PPL Corporation also experienced a bullish trend over the same period, delivering a 29.84% price increase with decelerating momentum. The stock’s price ranged from 26.14 to 37.44, showing lower volatility at 3.24 standard deviation.
Comparing the two, PPL Corporation outperformed DTE Energy with a higher overall price increase of 29.84% versus 20.49%, indicating superior market performance over the past year.
Target Prices
The current analyst consensus provides clear target price ranges for DTE Energy Company and PPL Corporation.
| Company | Target High | Target Low | Consensus |
|---|---|---|---|
| DTE Energy Company | 157 | 138 | 148.29 |
| PPL Corporation | 45 | 36 | 41.29 |
Analysts expect DTE’s stock to appreciate from its current price of $129.89 toward the consensus target of $148.29, indicating a moderate upside. PPL’s consensus target of $41.29 also suggests potential gains over the current $34.59 price.
Analyst Opinions Comparison
This section compares analysts’ ratings and financial grades for DTE Energy Company and PPL Corporation:
Rating Comparison
DTE Rating
- Rating: C, considered very favorable by analysts.
- Discounted Cash Flow Score: 1, rated very unfavorable indicating concerns.
- ROE Score: 3, moderate status reflecting decent profitability from equity.
- ROA Score: 2, moderate score indicating average asset utilization efficiency.
- Debt To Equity Score: 1, very unfavorable pointing to higher financial risk.
PPL Rating
- Rating: C+, also considered very favorable by analysts.
- Discounted Cash Flow Score: 1, similarly very unfavorable.
- ROE Score: 3, moderate status showing comparable equity profitability.
- ROA Score: 3, moderate but higher than DTE, indicating better asset use.
- Debt To Equity Score: 2, moderate indicating relatively stronger balance sheet.
Which one is the best rated?
PPL holds a slightly better rating of C+ compared to DTE’s C, with notably higher ROA and debt-to-equity scores. Both share moderate overall scores, but PPL’s financial metrics suggest a marginally stronger standing based on provided data.
Scores Comparison
Here is a comparison of the Altman Z-Score and Piotroski Score for DTE Energy Company and PPL Corporation:
DTE Scores
- Altman Z-Score: 1.03, indicating financial distress zone
- Piotroski Score: 7, reflecting strong financial health
PPL Scores
- Altman Z-Score: 0.97, indicating financial distress zone
- Piotroski Score: 6, reflecting average financial health
Which company has the best scores?
DTE has a slightly higher Altman Z-Score and a stronger Piotroski Score than PPL. Both are in the distress zone, but DTE shows better financial strength based on these scores.
Grades Comparison
Here is a detailed comparison of the latest grades assigned to DTE Energy Company and PPL Corporation by reputable grading firms:
DTE Energy Company Grades
This table shows recent grades assigned by recognized financial institutions for DTE Energy Company:
| Grading Company | Action | New Grade | Date |
|---|---|---|---|
| BMO Capital | Maintain | Market Perform | 2025-12-24 |
| UBS | Maintain | Buy | 2025-12-17 |
| JP Morgan | Maintain | Neutral | 2025-12-11 |
| Jefferies | Upgrade | Buy | 2025-12-11 |
| B of A Securities | Maintain | Buy | 2025-11-05 |
| Scotiabank | Maintain | Sector Perform | 2025-10-31 |
| Morgan Stanley | Maintain | Overweight | 2025-10-22 |
| Barclays | Maintain | Equal Weight | 2025-10-14 |
| UBS | Maintain | Buy | 2025-10-10 |
| Scotiabank | Downgrade | Sector Perform | 2025-10-03 |
DTE’s grades mainly cluster around “Buy” and “Hold” ratings, with several firms maintaining positive stances and one recent upgrade. There is a slight downgrade from “Sector Outperform” to “Sector Perform” by Scotiabank.
PPL Corporation Grades
This table presents recent grades assigned by recognized financial institutions for PPL Corporation:
| Grading Company | Action | New Grade | Date |
|---|---|---|---|
| UBS | Maintain | Neutral | 2025-12-17 |
| Wells Fargo | Maintain | Overweight | 2025-12-12 |
| JP Morgan | Maintain | Overweight | 2025-12-11 |
| BMO Capital | Maintain | Outperform | 2025-10-21 |
| B of A Securities | Maintain | Buy | 2025-10-16 |
| Barclays | Maintain | Equal Weight | 2025-10-14 |
| UBS | Maintain | Neutral | 2025-10-10 |
| Morgan Stanley | Maintain | Overweight | 2025-09-25 |
| Barclays | Maintain | Equal Weight | 2025-07-01 |
| Morgan Stanley | Maintain | Overweight | 2025-06-18 |
PPL’s grades are generally positive, with several “Overweight” and “Buy” ratings sustained over recent months and no downgrades reported.
Which company has the best grades?
PPL Corporation holds a stronger consensus with multiple “Overweight” and “Outperform” ratings compared to DTE Energy Company’s mix of “Buy” and “Hold” grades. This suggests a more favorable outlook from analysts, which could influence investors’ confidence and portfolio positioning accordingly.
Strengths and Weaknesses
Below is a comparison of key strengths and weaknesses for DTE Energy Company and PPL Corporation based on recent financial and operational data.
| Criterion | DTE Energy Company | PPL Corporation |
|---|---|---|
| Diversification | Diverse segments: Electric (5.8B), Gas (1.7B), Energy Trading (4.6B), plus innovative DTE Vantage (0.8B) | Primarily regulated utilities in Kentucky (3.6B), Pennsylvania (2.9B), Rhode Island (2.0B); less diversified product mix |
| Profitability | Net margin 11.27% (favorable); ROIC 4.65% (unfavorable below WACC 5.08%) | Net margin 10.49% (favorable); ROIC 3.59% (unfavorable below WACC 5.5%) |
| Innovation | Growth in ROIC trend +34% suggests improving operational efficiency and innovation | ROIC trend +19%, showing some improvement but less pronounced |
| Global presence | Mainly U.S. based with focus on energy trading and renewables | U.S. focused, with historic UK operations divested; limited global footprint |
| Market Share | Strong presence in energy trading and multiple energy segments | Strong regional utility market share, especially in Kentucky and Pennsylvania |
Key takeaways: Both companies are shedding value relative to their capital costs but show improving profitability trends. DTE’s stronger diversification and higher ROIC growth suggest better adaptability, whereas PPL’s focus remains on regulated utilities with stable but slower improvements. Investors should weigh diversification and innovation against regional concentration risks.
Risk Analysis
Below is a comparative table of key risks for DTE Energy Company and PPL Corporation based on the most recent data from 2024:
| Metric | DTE Energy Company | PPL Corporation |
|---|---|---|
| Market Risk | Low beta (0.48) indicates lower volatility versus market | Moderate beta (0.72) suggests medium market sensitivity |
| Debt level | High debt-to-equity (1.99), unfavorable leverage ratios | Moderate debt-to-equity (1.19), still unfavorable but less risky |
| Regulatory Risk | Significant due to utility sector regulations and environmental mandates | Similar regulatory exposure in US and UK utility markets |
| Operational Risk | Complex operations with fossil fuel and renewable mix, potential for asset inefficiencies | Diverse generation sources, operational complexity in two countries |
| Environmental Risk | Exposure to fossil fuel regulations and transition risks | Coal and gas generation pose transition and compliance risks |
| Geopolitical Risk | Primarily US-focused, limited geopolitical risk | Exposure to UK market adds moderate geopolitical uncertainty |
In summary, the most impactful risks for both companies are their high financial leverage and regulatory environment in the utility sector. DTE’s higher debt ratio and distress-zone Altman Z-score accentuate financial vulnerability, while PPL faces additional geopolitical risk from UK operations. Caution is advised due to potential regulatory changes and the financial strain these companies carry.
Which Stock to Choose?
DTE Energy Company shows a mixed income evolution with a slight revenue decline last year but overall growth since 2020. Its financial ratios are slightly unfavorable, reflecting moderate profitability (ROE 12%) and high debt levels (debt-to-equity 1.99). The company has a very favorable rating but faces challenges in liquidity and asset turnover.
PPL Corporation exhibits favorable income growth recently, with solid gross and EBIT margins, despite a negative net income trend over the longer term. Its financial ratios are generally unfavorable, including lower ROE (6.31%) and moderate debt (debt-to-equity 1.19). The rating is very favorable, though liquidity ratios remain below ideal levels.
Considering ratings and income statement evaluations, DTE might appear more suitable for investors prioritizing stronger profitability and a slightly better return on equity. Conversely, PPL could be of interest to those focusing on recent income growth and potentially lower leverage, though its lower profitability may signal higher risk. Both companies show value destruction per MOAT analyses but with improving profitability trends.
Disclaimer: Investment carries a risk of loss of initial capital. The past performance is not a reliable indicator of future results. Be sure to understand risks before making an investment decision.
Go Further
I encourage you to read the complete analyses of DTE Energy Company and PPL Corporation to enhance your investment decisions: