DTE Energy Company and Pinnacle West Capital Corporation are two prominent players in the regulated electric utility sector, serving millions of customers across Michigan and Arizona, respectively. Both companies combine traditional energy generation with growing renewable initiatives, highlighting their innovation in a shifting energy landscape. By comparing their market positions, strategies, and operational strengths, I will help you determine which stock stands out as the most compelling investment opportunity today.
Table of contents
Companies Overview
I will begin the comparison between DTE Energy Company and Pinnacle West Capital Corporation by providing an overview of these two companies and their main differences.
DTE Energy Company Overview
DTE Energy Company operates in the regulated electric industry, serving approximately 2.3 million customers in southeastern Michigan. Its mission focuses on generating and distributing electricity through a mix of fossil-fuel, nuclear, hydroelectric, and renewable sources. Additionally, it provides natural gas services to about 1.3 million customers and engages in energy trading and industrial projects, positioning itself as a diversified utility provider.
Pinnacle West Capital Corporation Overview
Pinnacle West Capital Corporation, via its subsidiary Arizona Public Service Company, serves roughly 1.3 million customers primarily in Arizona. The company generates, transmits, and distributes electricity using coal, nuclear, gas, oil, and solar facilities. It operates extensive overhead and underground transmission and distribution lines and maintains significant regulated generation capacity, emphasizing a comprehensive electric utility service within its regional market.
Key similarities and differences
Both companies operate in the regulated electric utility sector with a focus on electricity generation and distribution. DTE Energy serves a larger customer base and offers additional gas services and energy trading, while Pinnacle West concentrates on electric services with a notable presence in renewable energy and solar power. They differ in geographic focus, with DTE in Michigan and Pinnacle West in Arizona, reflecting regional infrastructure and energy mix variations.
Income Statement Comparison
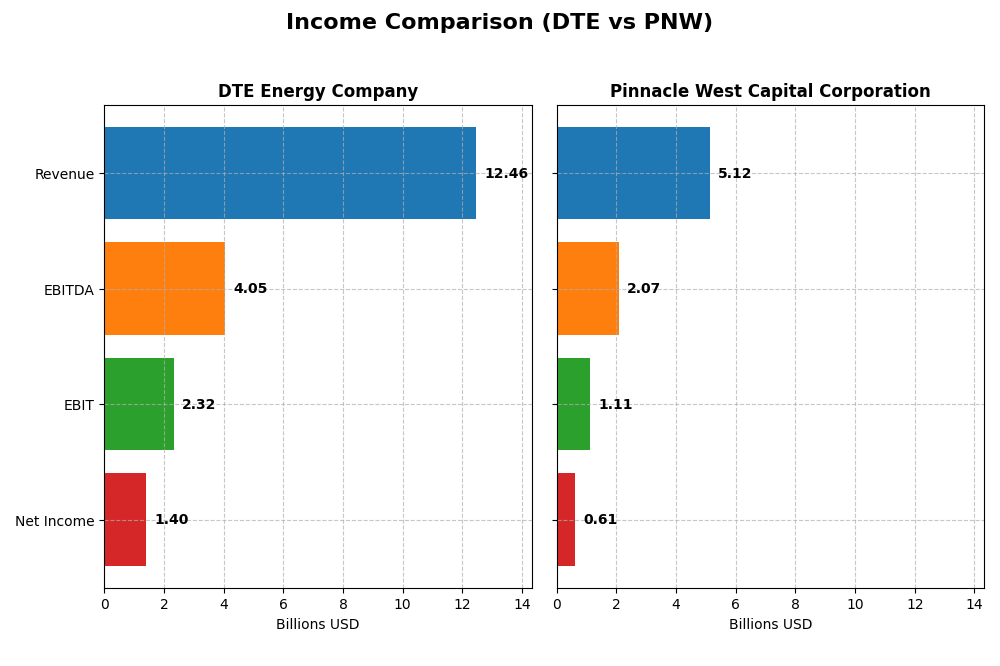
Below is a side-by-side comparison of key income statement metrics for DTE Energy Company and Pinnacle West Capital Corporation for the fiscal year 2024.
| Metric | DTE Energy Company | Pinnacle West Capital Corporation |
|---|---|---|
| Market Cap | 27B | 11B |
| Revenue | 12.5B | 5.1B |
| EBITDA | 4.1B | 2.1B |
| EBIT | 2.3B | 1.1B |
| Net Income | 1.4B | 609M |
| EPS | 6.78 | 5.35 |
| Fiscal Year | 2024 | 2024 |
Income Statement Interpretations
DTE Energy Company
DTE Energy’s revenue showed a modest overall increase of 9.05% from 2020 to 2024, but it experienced a slight decline of 2.26% in the most recent year. Net income grew slightly by 2.41% overall, with a neutral 0.15% EPS growth last year. Margins remain stable, with favorable gross and EBIT margins near 35% and 19%, respectively, though net margin growth was slightly negative.
Pinnacle West Capital Corporation
Pinnacle West demonstrated strong revenue growth of 42.88% over the period, accelerating 9.13% in 2024. Net income increased 10.58% overall, supported by an 18.82% EPS rise last year. Margins are robust, with a favorable gross margin above 41% and EBIT margin near 22%. Despite this, net margin declined by 22.6% over the full period, though it improved 11.22% in 2024.
Which one has the stronger fundamentals?
Pinnacle West exhibits stronger fundamentals with broad favorable income statement metrics, including superior growth in revenue, net income, and EPS, alongside solid margins. DTE Energy shows mixed signals, with stable margins but weaker recent revenue trends and some unfavorable margin growth. Overall, Pinnacle West’s income statement reflects more consistent positive momentum and profitability enhancements.
Financial Ratios Comparison
The following table presents a side-by-side comparison of key financial ratios for DTE Energy Company and Pinnacle West Capital Corporation for the fiscal year 2024.
| Ratios | DTE Energy Company | Pinnacle West Capital Corporation |
|---|---|---|
| ROE | 12.00% | 9.01% |
| ROIC | 4.65% | 3.48% |
| P/E | 17.80 | 15.85 |
| P/B | 2.14 | 1.43 |
| Current Ratio | 0.71 | 0.59 |
| Quick Ratio | 0.46 | 0.42 |
| D/E | 1.99 | 1.64 |
| Debt-to-Assets | 47.58% | 42.33% |
| Interest Coverage | 2.20 | 2.68 |
| Asset Turnover | 0.26 | 0.20 |
| Fixed Asset Turnover | 0.40 | 0.25 |
| Payout ratio | 57.69% | 64.83% |
| Dividend yield | 3.24% | 4.09% |
Interpretation of the Ratios
DTE Energy Company
DTE Energy shows a mixed ratio profile with favorable net margin (11.27%) and dividend yield (3.24%), but several weak points such as low current and quick ratios (0.71 and 0.46) and high debt-to-equity (1.99). The firm maintains a neutral return on equity (12.0%) but an unfavorable return on invested capital (4.65%). Dividend payments appear sustainable given the coverage by free cash flow, yet the heavy leverage and weak liquidity might raise concerns.
Pinnacle West Capital Corporation
Pinnacle West’s ratios reveal a slightly unfavorable outlook with a strong net margin (11.88%) and attractive dividend yield (4.09%), but weak returns on equity (9.01%) and invested capital (3.48%). Liquidity ratios are below 1.0, and debt levels remain elevated with a debt-to-equity of 1.64. Despite a favorable price-to-book ratio (1.43), cash flow pressures could challenge dividend sustainability over time.
Which one has the best ratios?
Both companies exhibit a slightly unfavorable overall ratio profile, with Pinnacle West having a higher proportion of unfavorable ratios (50%) compared to DTE (42.86%). DTE’s stronger return on equity and better dividend yield contrast with Pinnacle West’s more favorable price-to-book ratio but weaker profitability metrics. Neither company distinctly outperforms the other across all key financial ratios.
Strategic Positioning
This section compares the strategic positioning of DTE Energy Company and Pinnacle West Capital Corporation across market position, key segments, and exposure to technological disruption:
DTE Energy Company
- Leading utility in Michigan with diversified energy operations and moderate competitive pressure.
- Diverse segments including Electric, Gas, Energy Trading, and Industrial Projects driving revenue.
- Moderate exposure through renewable assets and energy trading alongside traditional fossil fuels.
Pinnacle West Capital Corporation
- Regional utility focused on Arizona with concentrated market presence and competitive pressure.
- Primarily Electric Service with additional transmission and wholesale energy segments.
- Uses coal, nuclear, gas, oil, and solar generation with transmission and distribution focus.
DTE Energy Company vs Pinnacle West Capital Corporation Positioning
DTE exhibits a diversified business model spanning multiple energy segments, offering broader revenue sources. Pinnacle West concentrates on electric services within Arizona, potentially limiting market scope but focusing on regulated utilities. Diversification may reduce risk, while concentration might streamline operations.
Which has the best competitive advantage?
Both companies are shedding value as ROIC is below WACC; however, DTE shows a growing ROIC trend indicating improving profitability, whereas Pinnacle West faces declining ROIC and deteriorating profitability, suggesting weaker competitive advantage.
Stock Comparison
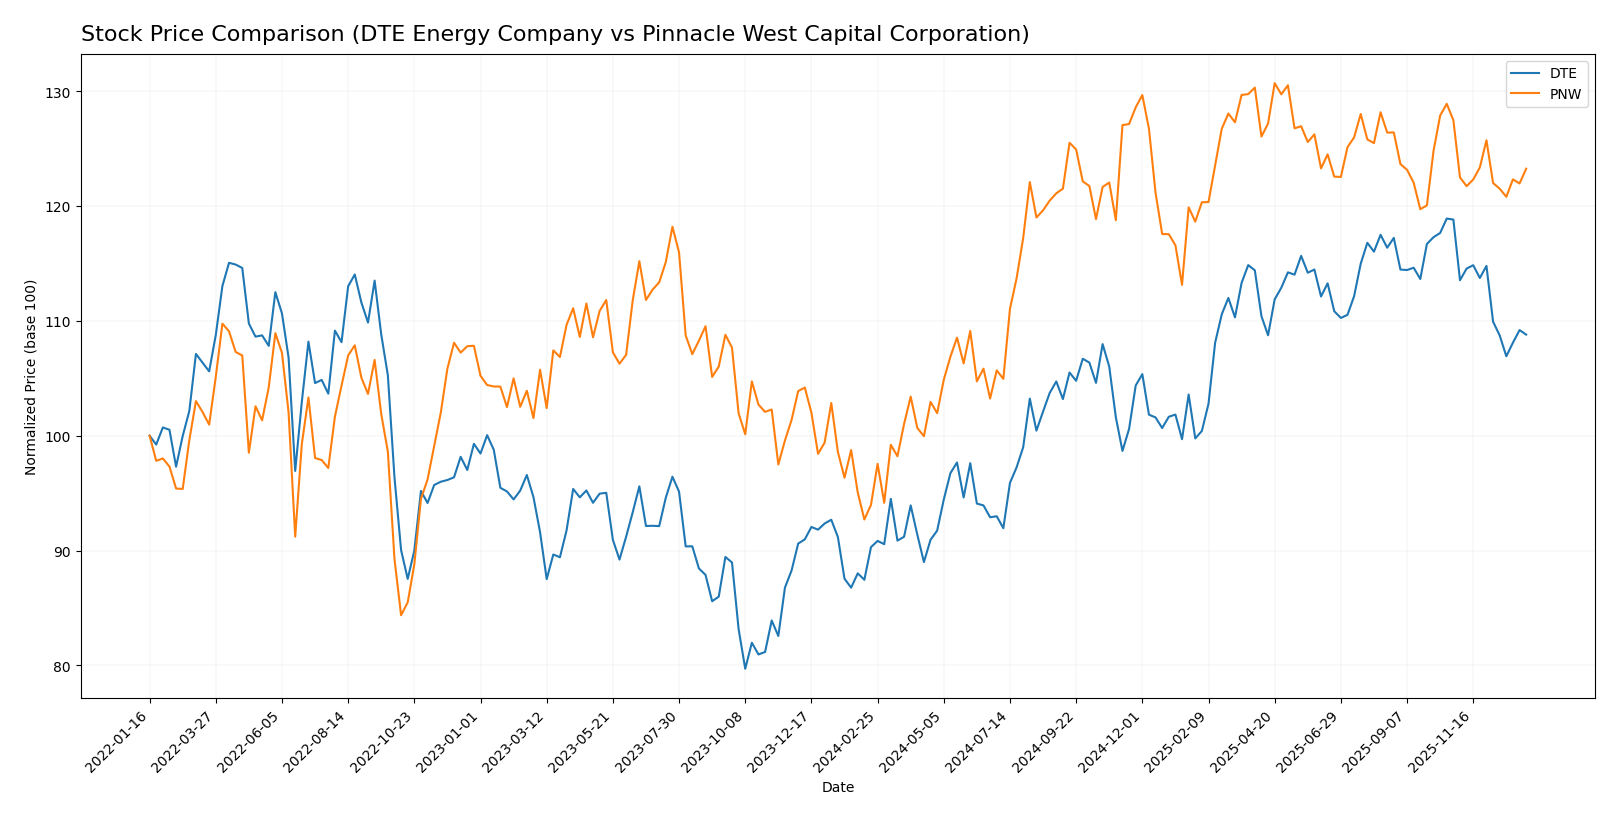
The past year reveals significant bullish trends for both DTE Energy Company and Pinnacle West Capital Corporation, with notable deceleration in momentum and recent downward pressure on prices from late 2025 to early 2026.
Trend Analysis
DTE Energy Company’s stock experienced a 20.49% increase over the past 12 months, indicating a bullish trend with deceleration in price gains. The price ranged from 106.25 to 141.95 with a high volatility of 10.2 std deviation. Recent months show an 8.42% decline.
Pinnacle West Capital Corporation’s stock rose by 31.14% over the past year, also bullish but with decelerating gains. Its price fluctuated between 67.92 and 94.45, with lower volatility at 6.87 std deviation. Recently, it fell by 3.31%, showing mild negative pressure.
Comparing trends, Pinnacle West Capital outperformed DTE with a stronger overall gain of 31.14% versus 20.49%, despite both showing deceleration and recent short-term declines. Pinnacle West delivered the highest market performance over the analyzed period.
Target Prices
The current analyst consensus presents a moderately bullish outlook for both DTE Energy Company and Pinnacle West Capital Corporation.
| Company | Target High | Target Low | Consensus |
|---|---|---|---|
| DTE Energy Company | 157 | 138 | 148.29 |
| Pinnacle West Capital Corporation | 115 | 85 | 96.33 |
Analysts expect DTE Energy’s stock to appreciate from the current price of $129.89 toward the $148 consensus, indicating moderate upside potential. Pinnacle West’s consensus target of $96.33 also suggests room for growth from its current $89.07 price level.
Analyst Opinions Comparison
This section compares analysts’ ratings and financial scores for DTE Energy Company and Pinnacle West Capital Corporation:
Rating Comparison
DTE Rating
- Rating: C, considered Very Favorable overall.
- Discounted Cash Flow Score: 1, rated Very Unfavorable, indicating valuation concerns.
- ROE Score: 3, Moderate, showing efficient profit generation from equity.
- ROA Score: 2, Moderate, moderate asset utilization effectiveness.
- Debt To Equity Score: 1, Very Unfavorable, indicating higher financial risk.
- Overall Score: 2, Moderate, reflecting balanced but cautious outlook.
PNW Rating
- Rating: C+, also considered Very Favorable overall.
- Discounted Cash Flow Score: 1, also Very Unfavorable on valuation metrics.
- ROE Score: 3, Moderate, similarly efficient at generating profits from equity.
- ROA Score: 3, Moderate, better utilization of assets compared to DTE.
- Debt To Equity Score: 1, Very Unfavorable, similar elevated financial risk.
- Overall Score: 2, Moderate, similarly balanced overall rating.
Which one is the best rated?
Both companies have a Very Favorable rating status with a moderate overall score of 2. PNW holds a slight edge in ROA and price-to-book metrics, but both share similar challenges in discounted cash flow and debt-to-equity scores, leading to comparable analyst assessments.
Scores Comparison
Here is a comparison of the financial scores for DTE Energy Company and Pinnacle West Capital Corporation:
DTE Scores
- Altman Z-Score: 1.03, indicating financial distress.
- Piotroski Score: 7, reflecting strong financial health.
PNW Scores
- Altman Z-Score: 0.73, indicating financial distress.
- Piotroski Score: 4, reflecting average financial health.
Which company has the best scores?
DTE shows a higher Piotroski Score at 7 versus PNW’s 4, indicating stronger financial health, though both are in the Altman Z-Score distress zone.
Grades Comparison
Here is a comparison of the recent grades assigned to DTE Energy Company and Pinnacle West Capital Corporation by various grading firms:
DTE Energy Company Grades
The following table summarizes recent grades from reputable financial institutions for DTE Energy Company:
| Grading Company | Action | New Grade | Date |
|---|---|---|---|
| BMO Capital | Maintain | Market Perform | 2025-12-24 |
| UBS | Maintain | Buy | 2025-12-17 |
| JP Morgan | Maintain | Neutral | 2025-12-11 |
| Jefferies | Upgrade | Buy | 2025-12-11 |
| B of A Securities | Maintain | Buy | 2025-11-05 |
| Scotiabank | Maintain | Sector Perform | 2025-10-31 |
| Morgan Stanley | Maintain | Overweight | 2025-10-22 |
| Barclays | Maintain | Equal Weight | 2025-10-14 |
| UBS | Maintain | Buy | 2025-10-10 |
| Scotiabank | Downgrade | Sector Perform | 2025-10-03 |
Overall, DTE’s grades show a stable to positive trend, with multiple buy ratings and few downgrades, reflecting moderate confidence from analysts.
Pinnacle West Capital Corporation Grades
Recent grades for Pinnacle West Capital Corporation by established grading firms are shown below:
| Grading Company | Action | New Grade | Date |
|---|---|---|---|
| UBS | Maintain | Neutral | 2025-12-17 |
| Keybanc | Downgrade | Sector Weight | 2025-12-12 |
| Keybanc | Maintain | Overweight | 2025-10-15 |
| UBS | Maintain | Neutral | 2025-10-10 |
| Barclays | Maintain | Equal Weight | 2025-10-07 |
| Argus Research | Maintain | Buy | 2025-09-30 |
| Morgan Stanley | Maintain | Equal Weight | 2025-09-25 |
| UBS | Maintain | Neutral | 2025-09-12 |
| Mizuho | Downgrade | Neutral | 2025-09-09 |
| Barclays | Maintain | Equal Weight | 2025-08-13 |
The grades for Pinnacle West Capital Corporation trend mostly neutral with some downgrades and fewer buy ratings, indicating cautious analyst sentiment.
Which company has the best grades?
DTE Energy Company has received more buy and overweight ratings compared to Pinnacle West Capital Corporation, which mostly holds neutral and equal weight grades. This suggests investors may view DTE as having slightly stronger growth or stability prospects, although both companies share a consensus “Hold” rating.
Strengths and Weaknesses
Below is a comparison table highlighting key strengths and weaknesses of DTE Energy Company (DTE) and Pinnacle West Capital Corporation (PNW) based on recent financial and operational data.
| Criterion | DTE Energy Company (DTE) | Pinnacle West Capital Corporation (PNW) |
|---|---|---|
| Diversification | Strong diversification with Electric (5.8B), Gas (1.7B), Energy Trading (4.6B), and DTE Vantage (0.8B) segments | Less diversified, primarily Electric Service (2.56B) with smaller Wholesale Energy and Transmission segments |
| Profitability | Net margin 11.27% (favorable), ROIC 4.65% (unfavorable), ROE 12% (neutral); slightly unfavorable overall ratios | Net margin 11.88% (favorable), ROIC 3.48% (unfavorable), ROE 9.01% (unfavorable); slightly unfavorable overall ratios |
| Innovation | Moderate focus on innovation via DTE Vantage segment (~0.8B revenue); growing ROIC trend despite value destruction | Limited innovation indicated; declining ROIC trend and very unfavorable moat status |
| Global presence | Primarily US-focused energy company with regional operations, no significant global footprint | Regional US utility with no notable global presence |
| Market Share | Large market presence with multiple energy segments and growing profitability | Smaller market share focused on electric utility services; profitability declining |
Key takeaways: DTE Energy shows better diversification and a growing profitability trend despite current value destruction, suggesting potential for recovery. Pinnacle West is more concentrated in electric utilities with declining profitability and a weaker competitive moat, indicating higher investment risk. Investors should weigh DTE’s innovation and growth prospects against PNW’s shrinking returns and limited diversification.
Risk Analysis
Below is a comparative table of key risks for DTE Energy Company and Pinnacle West Capital Corporation based on the most recent 2024 data:
| Metric | DTE Energy Company | Pinnacle West Capital Corporation |
|---|---|---|
| Market Risk | Beta 0.48, relatively low volatility | Beta 0.54, slightly higher volatility |
| Debt level | Debt-to-Equity 1.99 (unfavorable), Debt-to-Assets 47.6% (neutral) | Debt-to-Equity 1.64 (unfavorable), Debt-to-Assets 42.3% (neutral) |
| Regulatory Risk | High, as a regulated utility with fossil fuel and nuclear exposure | High, regulated utility with coal, nuclear, and gas generation |
| Operational Risk | Moderate, complex energy mix including renewables and trading | Moderate, large transmission and distribution network in Arizona |
| Environmental Risk | Elevated due to fossil fuel and nuclear generation reliance | Elevated due to coal and nuclear generation, plus solar transition |
| Geopolitical Risk | Moderate, US-focused operations but sensitive to energy policies | Moderate, US Southwest focused, sensitive to regional regulations |
Synthesis: Both companies face significant regulatory and environmental risks due to their reliance on fossil fuels and nuclear power amid tightening emissions standards. High debt levels and low liquidity ratios increase financial vulnerability. Market volatility is moderate but manageable. Notably, DTE’s Altman Z-score signals distress risk, warranting cautious monitoring.
Which Stock to Choose?
DTE Energy Company shows a mixed income evolution with a 9.05% revenue growth over 2020-2024 but a slight decline in net margin and EPS growth. Its financial ratios reflect a slightly unfavorable profile, marked by high debt levels and weak liquidity, despite a favorable dividend yield and net margin. The company’s rating is very favorable overall but with moderate scores on key metrics and a distress-zone Altman Z-Score, signaling financial caution.
Pinnacle West Capital Corporation presents a more favorable income statement, with robust 42.88% revenue growth and positive EPS growth over five years, although net margin declined. Financial ratios are also slightly unfavorable, driven by high debt and low liquidity, but with better price-to-book and dividend yield metrics than DTE. Its rating matches DTE’s in favorability but with average Piotroski and distress-zone Altman Z-Scores reflecting some financial risk.
Choosing the most favorable stock could depend on investor profiles: those seeking growth might lean toward Pinnacle West given its stronger income growth and margin improvements, while investors valuing dividend yield and consistent profitability might find DTE more appealing. Both companies exhibit slightly unfavorable financial ratios and value destruction signals, implying that risk-averse investors might consider waiting for clearer financial improvements.
Disclaimer: Investment carries a risk of loss of initial capital. The past performance is not a reliable indicator of future results. Be sure to understand risks before making an investment decision.
Go Further
I encourage you to read the complete analyses of DTE Energy Company and Pinnacle West Capital Corporation to enhance your investment decisions: