Home > Comparison > Utilities > NEE vs DTE
The strategic rivalry between NextEra Energy, Inc. and DTE Energy Company defines the trajectory of the regulated electric utilities sector. NextEra operates a capital-intensive model focused on renewable energy and long-term contracted clean assets. DTE relies on a diversified utility model blending fossil fuels, nuclear, and gas distribution. This analysis will determine which company’s approach offers superior risk-adjusted returns for a diversified portfolio amid evolving energy demands.
Table of contents
Companies Overview
NextEra Energy and DTE Energy command significant positions in the regulated electric utility sector.
NextEra Energy, Inc.: Leader in Clean Energy Innovation
NextEra Energy dominates North America’s regulated electric market with 28,564 MW of generating capacity. Its revenue stems from selling electricity generated through wind, solar, nuclear, coal, and natural gas. In 2026, the company emphasizes expanding renewable generation and battery storage projects, reinforcing its clean energy leadership and long-term contracted assets.
DTE Energy Company: Diverse Utility Operator
DTE Energy serves southeastern Michigan with electricity and natural gas to over 3.6 million customers. It generates power primarily through fossil fuels, nuclear, hydroelectric, and renewables. In 2026, DTE focuses on optimizing its integrated utility model, balancing electricity generation with extensive gas distribution and energy trading to diversify its revenue streams.
Strategic Collision: Similarities & Divergences
Both companies operate in regulated electric utilities, yet NextEra leans heavily into renewables and clean energy infrastructure, while DTE pursues a more diversified, integrated utility approach combining electric and gas. Their primary battleground is regulated power generation, but NextEra’s scale and clean focus contrast with DTE’s regional, multi-commodity strategy. This divergence shapes distinct risk profiles and growth trajectories for investors.
Income Statement Comparison
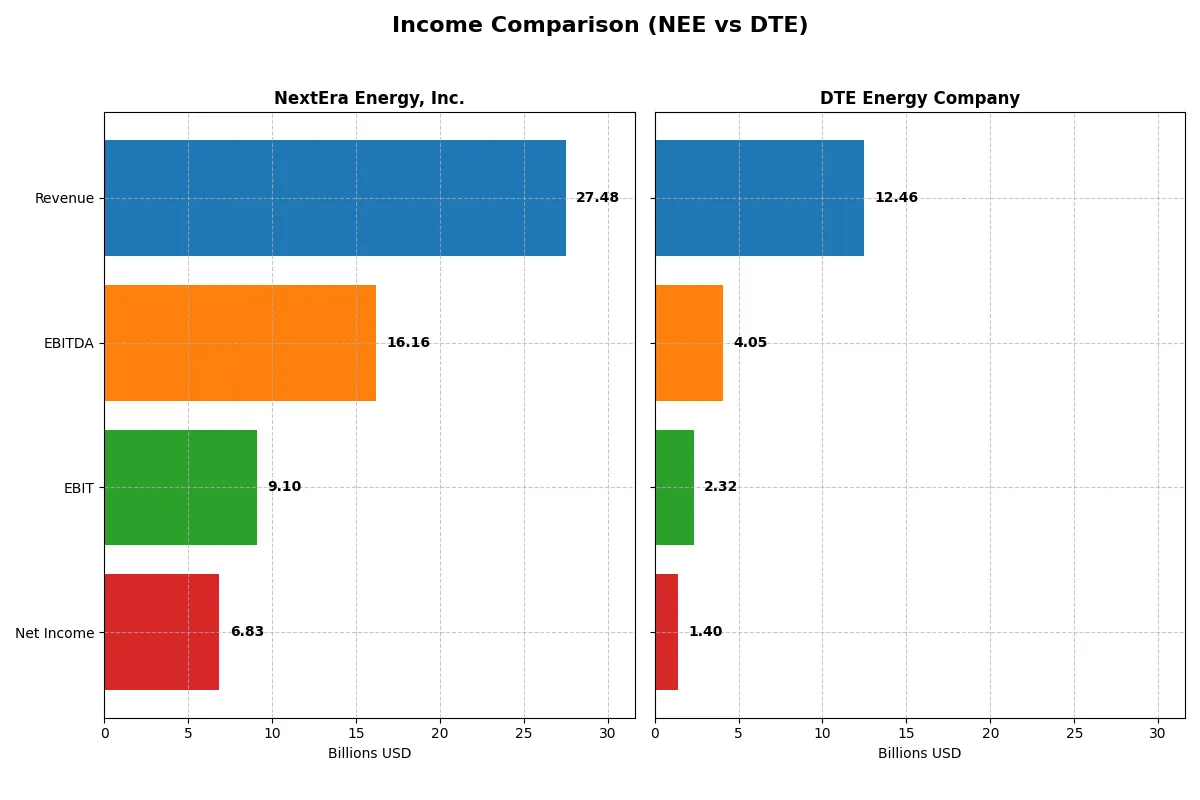
The following data dissects the core profitability and scalability of both corporate engines to reveal who dominates the bottom line:
| Metric | NextEra Energy, Inc. (NEE) | DTE Energy Company (DTE) |
|---|---|---|
| Revenue | 27.5B | 12.5B |
| Cost of Revenue | 10.2B | 8.1B |
| Operating Expenses | 8.98B | 2.25B |
| Gross Profit | 17.3B | 4.3B |
| EBITDA | 16.2B | 4.1B |
| EBIT | 9.1B | 2.3B |
| Interest Expense | 4.57B | 951M |
| Net Income | 6.83B | 1.40B |
| EPS | 3.31 | 6.78 |
| Fiscal Year | 2025 | 2024 |
Income Statement Analysis: The Bottom-Line Duel
This income statement comparison reveals which company converts revenue into profits most efficiently and sustains margin strength over time.
NextEra Energy, Inc. Analysis
NextEra Energy’s revenue climbed steadily from 17B in 2021 to 27.5B in 2025, nearly doubling its net income to 6.8B. The firm maintains robust gross margins near 63% and net margins close to 25%, signaling strong operational control. Despite a slight net margin dip in 2025, revenue and EBIT both grew over 10%, underscoring sustained momentum.
DTE Energy Company Analysis
DTE’s revenue peaked at 19.2B in 2022 but fell to 12.5B by 2024, with net income hovering around 1.4B. Its gross margin sits at a modest 35%, and net margin at 11%, reflecting thinner profitability. The latest year’s slight revenue decline and EBIT decrease highlight challenges in growth and margin expansion.
Margin Dominance vs. Scale Challenge
NextEra Energy decisively outperforms DTE in both scale and margin efficiency, with nearly double revenue and more than four times net income in the latest period. NextEra’s superior gross and net margins confirm its stronger economic moat. For investors prioritizing profit quality and growth, NextEra presents a more compelling profile than DTE’s stagnant earnings and margin pressures.
Financial Ratios Comparison
These vital ratios act as a diagnostic tool to expose the underlying fiscal health, valuation premiums, and capital efficiency of the companies compared:
| Ratios | NextEra Energy, Inc. (NEE) | DTE Energy Company (DTE) |
|---|---|---|
| ROE | 13.9% | 12.0% |
| ROIC | 4.0% | 4.5% |
| P/E | 21.2 | 17.8 |
| P/B | 2.94 | 2.14 |
| Current Ratio | 0.47 | 0.71 |
| Quick Ratio | 0.38 | 0.46 |
| D/E | 1.64 | 1.99 |
| Debt-to-Assets | 43.3% | 47.6% |
| Interest Coverage | 3.35 | 2.20 |
| Asset Turnover | 0.13 | 0.26 |
| Fixed Asset Turnover | 0.18 | 0.40 |
| Payout Ratio | 61.0% | 57.8% |
| Dividend Yield | 2.87% | 3.24% |
| Fiscal Year | 2024 | 2024 |
Efficiency & Valuation Duel: The Vital Signs
Ratios serve as a company’s DNA, unveiling hidden risks and operational excellence that raw numbers alone cannot reveal.
NextEra Energy, Inc.
NextEra shows a solid 28.06% net margin, signaling strong profitability, while its 13.86% ROE is average for the sector. The P/E of 21.23 suggests a fairly valued stock, neither cheap nor stretched. NextEra supports shareholders with a 2.87% dividend yield, balancing income with reinvestment in growth opportunities.
DTE Energy Company
DTE posts a lower net margin of 11.25% but maintains a respectable ROE near 12%. Its P/E ratio of 17.84 points to a slightly more attractive valuation versus peers. Dividend yield at 3.24% reflects a focus on returning capital, despite a higher debt load and moderate operational efficiency metrics.
Balanced Profitability Meets Dividend Stability
NextEra offers stronger profitability with a neutral valuation, while DTE trades at a modest discount with a higher yield. Investors prioritizing earnings growth may prefer NextEra; those seeking steady income might lean toward DTE’s dividend profile.
Which one offers the Superior Shareholder Reward?
I compare NextEra Energy (NEE) and DTE Energy (DTE) on dividends and buybacks. NEE yields 2.87% with a high payout ratio near 61%, backed by positive free cash flow of 2.3/share supporting sustainability. DTE offers a higher yield of 3.24%, with a lower payout ratio around 58%, but negative free cash flow (-4.0/share) raises caution on dividend coverage. Both companies lack aggressive buybacks, but NEE’s modest buyback and consistent FCF signal a more durable distribution model. In 2026, I favor NEE for a balanced, sustainable total return despite DTE’s higher yield.
Comparative Score Analysis: The Strategic Profile
The radar chart reveals the fundamental DNA and trade-offs of NextEra Energy, Inc. and DTE Energy Company, highlighting their strategic strengths and vulnerabilities:
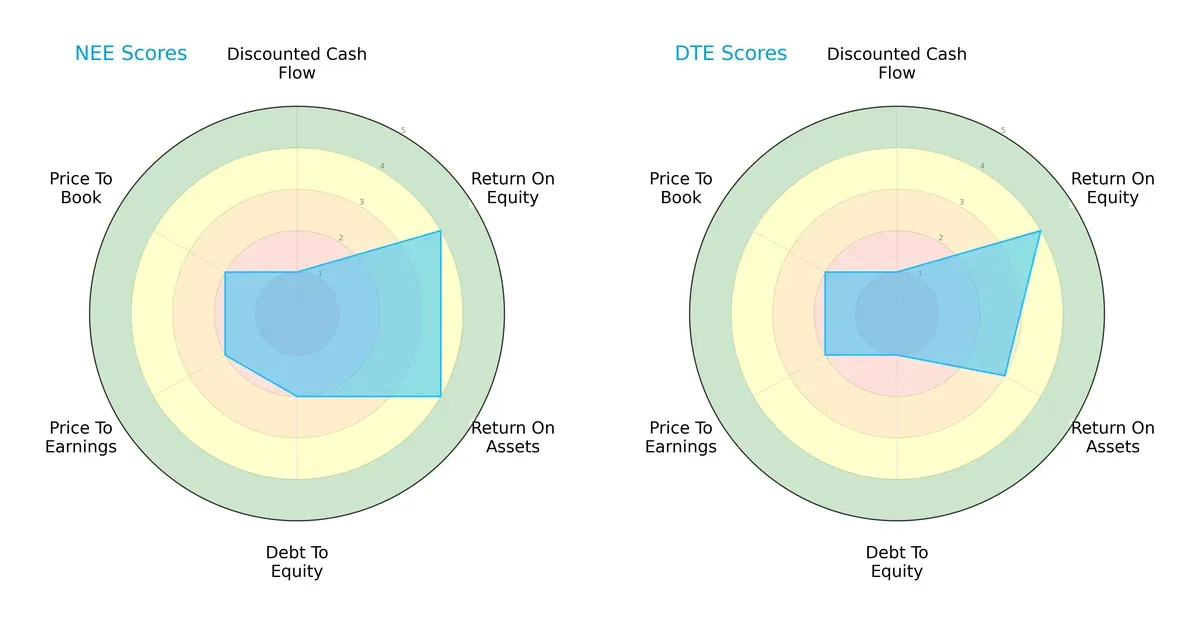
NextEra scores higher in return on assets (4 vs. 3) and maintains a better debt-to-equity score (2 vs. 1), suggesting stronger asset efficiency and moderate leverage. Both firms share equal discounted cash flow (1) and valuation scores (PE and PB at 2), indicating similar market pricing concerns. NextEra’s balanced profile contrasts with DTE’s reliance on a strong return on equity (both 4), but weaker asset use and higher leverage.
Bankruptcy Risk: Solvency Showdown
The Altman Z-Scores for both companies place them in the distress zone, signaling elevated bankruptcy risk amid current market pressures:
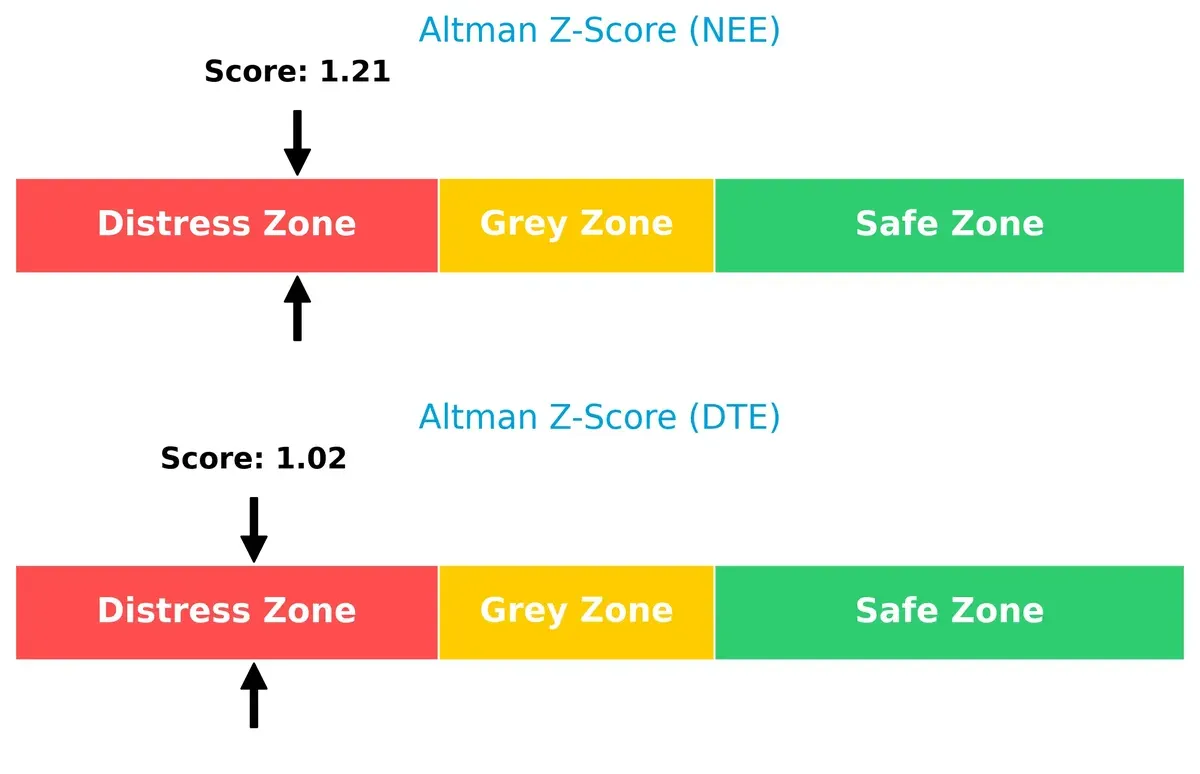
NextEra’s score of 1.21 slightly outperforms DTE’s 1.02, though neither offers comfort. Historically, utilities maintain stability through cycles, but these scores warrant caution given their poor solvency buffer.
Financial Health: Quality of Operations
Piotroski F-Scores show DTE at 7, indicating strong financial health, while NextEra’s 6 suggests average operational quality:
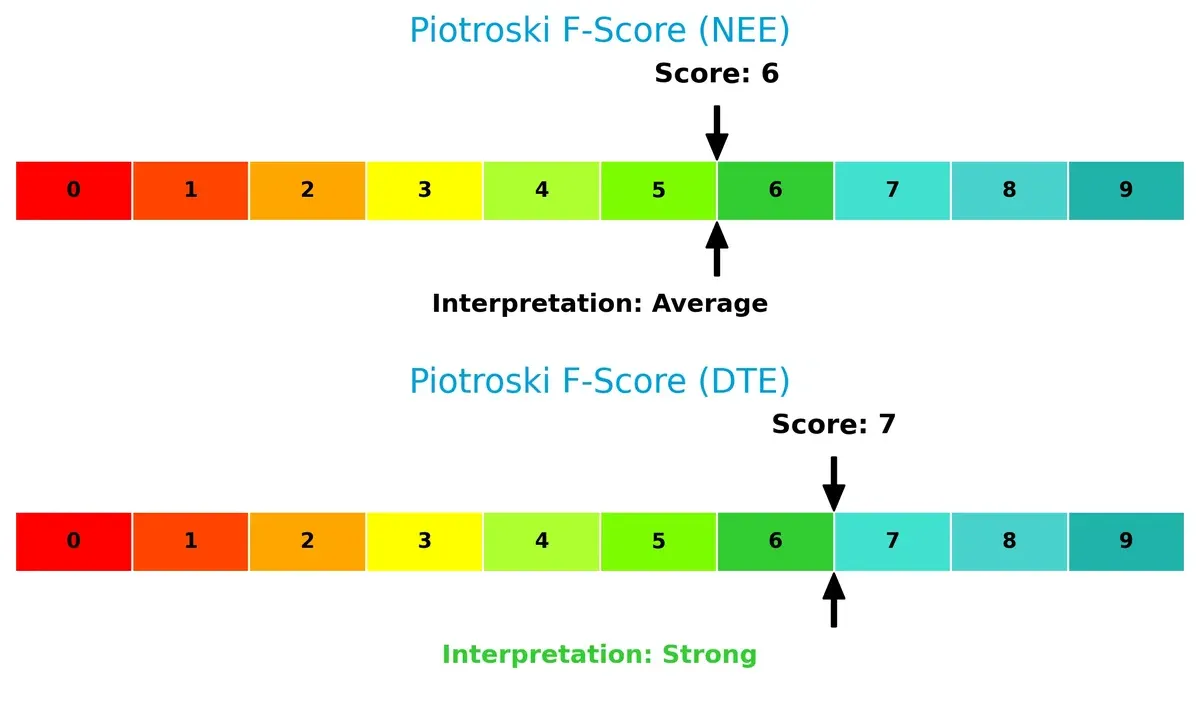
DTE’s higher score points to better profitability, liquidity, and efficiency metrics internally. NextEra’s average score flags potential red flags in financial controls or capital allocation that investors should monitor closely.
How are the two companies positioned?
This section dissects the operational DNA of NextEra Energy and DTE Energy by comparing their revenue distribution by segment alongside their strengths and weaknesses. The goal is to confront their economic moats and identify which model offers the most resilient competitive advantage today.
Revenue Segmentation: The Strategic Mix
The following visual comparison dissects how NextEra Energy, Inc. and DTE Energy Company diversify their income streams and where their primary sector bets lie:
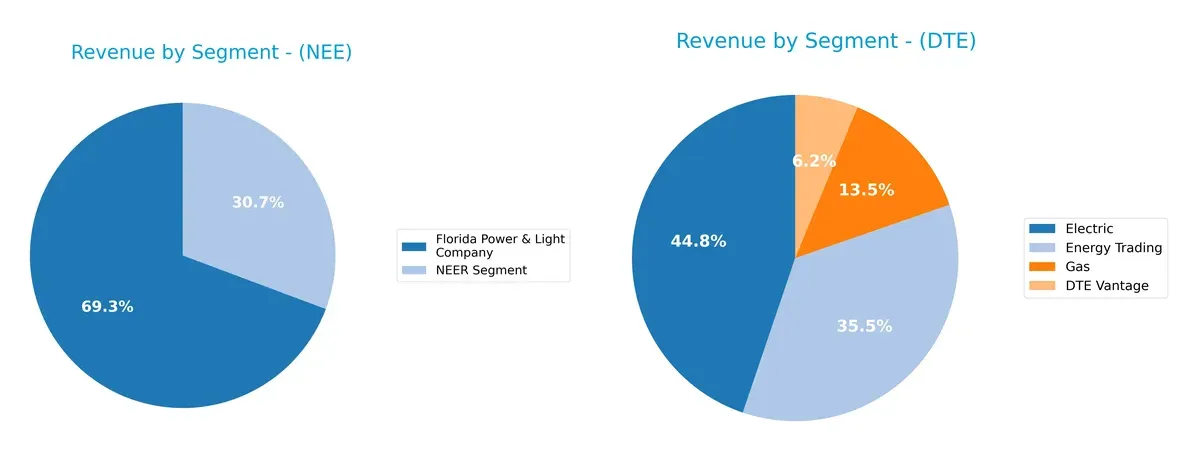
NextEra Energy anchors its revenue in the Florida Power & Light segment with $17B, while NextEra Energy Resources contributes $7.5B, showing moderate diversification. DTE Energy presents a more balanced mix, with Electric at $5.8B, Energy Trading at $4.6B, Gas at $1.7B, and DTE Vantage at $0.8B. NextEra’s concentration in regulated utilities signals infrastructure dominance; DTE’s spread reduces concentration risk but hinges on volatile trading revenues.
Strengths and Weaknesses Comparison
This table compares the key Strengths and Weaknesses of NextEra Energy, Inc. and DTE Energy Company:
NextEra Energy Strengths
- Strong profitability with 28.06% net margin
- Favorable WACC at 6.4% supports capital efficiency
- Large, diversified revenue from multiple segments
DTE Energy Strengths
- Favorable 11.25% net margin indicates stable profitability
- Lower WACC at 5.12% improves investment returns
- Diverse product segments including energy trading and gas
NextEra Energy Weaknesses
- Unfavorable liquidity ratios with current ratio 0.47 and quick ratio 0.38
- High debt-to-equity at 1.64 raises financial risk
- Low asset and fixed asset turnover signals operational inefficiency
DTE Energy Weaknesses
- Unfavorable liquidity with current ratio 0.71 and quick ratio 0.46
- Higher debt-to-equity at 1.99 increases leverage concerns
- Asset turnover remains low at 0.26 and fixed asset turnover at 0.4
Both companies exhibit strengths in profitability and segment diversification but face challenges in liquidity and asset efficiency. These factors likely influence their capital allocation and risk management strategies going forward.
The Moat Duel: Analyzing Competitive Defensibility
A structural moat is the only thing protecting long-term profits from relentless competitive erosion. Let’s dissect the nature of these moats for two utilities giants:
NextEra Energy, Inc.: Innovation-Driven Renewable Moat
NextEra’s moat stems from intangible assets and clean energy innovation, reflected in its robust 33% EBIT margin and 25% net margin. However, a declining ROIC signals pressure on capital efficiency in 2026.
DTE Energy Company: Stable Regulated Utility Moat
DTE’s moat relies on regulated cost advantages and stable customer base, showing a growing ROIC trend despite lower margins near 19%. Its steady profitability points to improving operational leverage in 2026.
Verdict: Innovation Moat vs. Regulated Stability
NextEra’s innovation-based moat is deeper but currently challenged by declining capital returns. DTE’s regulated moat is narrower but shows signs of durable profitability growth. DTE appears better equipped to defend its market share amid capital efficiency headwinds.
Which stock offers better returns?
The past 12 months reveal distinct bullish trends for both stocks, with NextEra Energy surging over 50%, while DTE Energy shows a more moderate increase accompanied by recent deceleration.
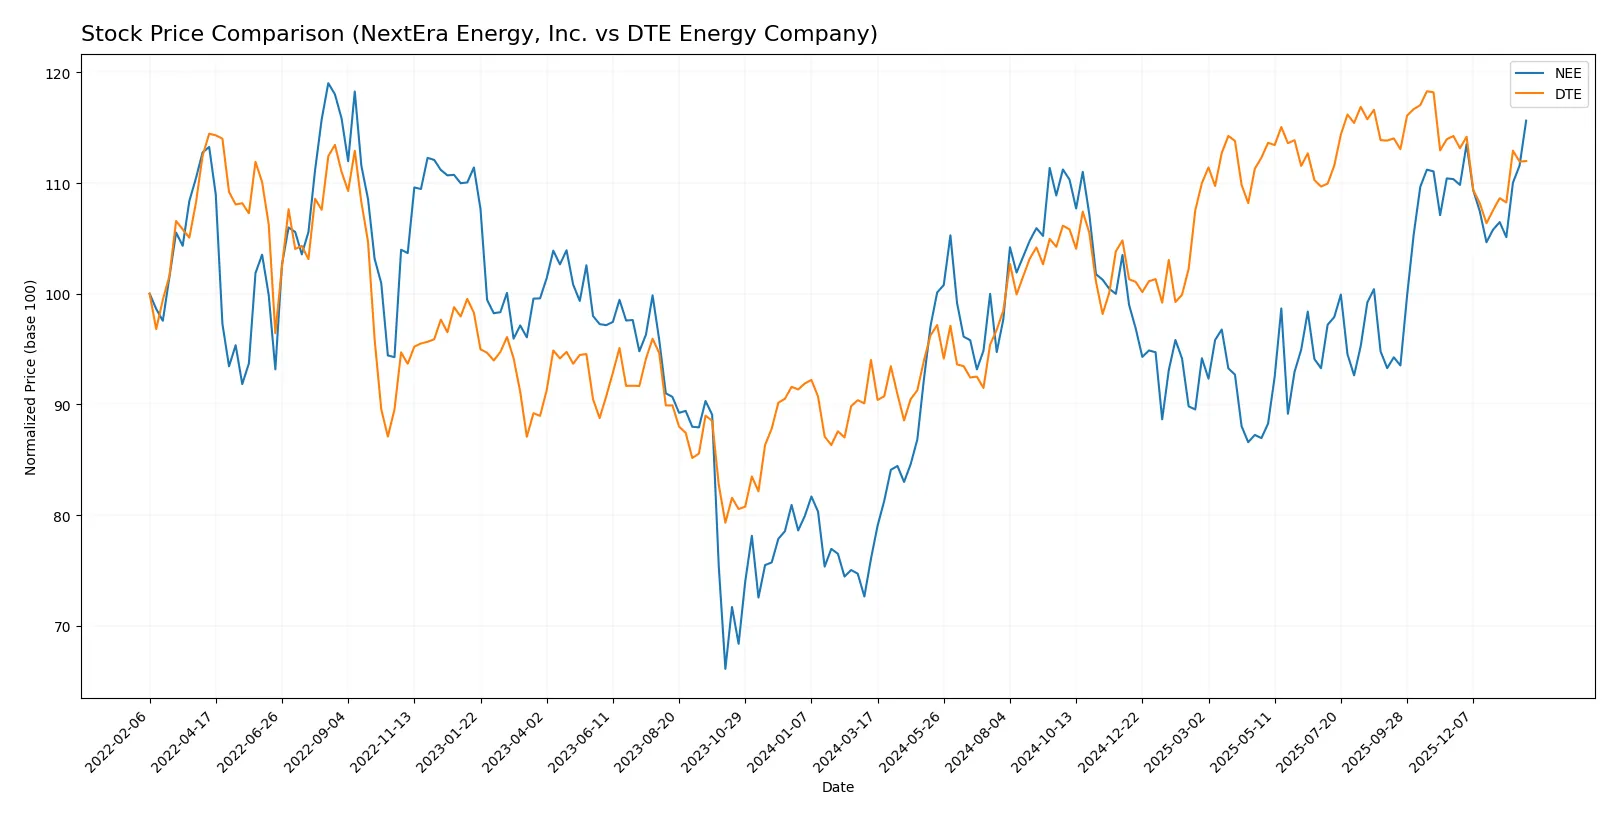
Trend Comparison
NextEra Energy’s stock rose 52.05% over the last year, marking a strong bullish trend despite deceleration, with prices ranging from 57.81 to 87.9 and a 6.42 volatility measure.
DTE Energy’s stock increased 19.11% in the same period, also bullish but decelerating, with a wider volatility of 9.79 and prices between 106.25 and 141.95; recent trend slightly bearish.
NextEra Energy outperformed DTE Energy over the year, delivering the highest market return with over 50% growth versus DTE’s 19%.
Target Prices
Analysts present a confident target consensus for NextEra Energy and DTE Energy, reflecting moderate upside potential.
| Company | Target Low | Target High | Consensus |
|---|---|---|---|
| NextEra Energy, Inc. | 84 | 104 | 93.09 |
| DTE Energy Company | 141 | 152 | 146.75 |
NextEra Energy’s target consensus sits modestly above its current price of 87.9, suggesting moderate growth expectations. DTE Energy shows a stronger upside, with targets well above its 134.38 share price, indicating bullish analyst sentiment.

Don’t Let Luck Decide Your Entry Point
Optimize your entry points with our advanced ProRealTime indicators. You’ll get efficient buy signals with precise price targets for maximum performance. Start outperforming now!
How do institutions grade them?
NextEra Energy, Inc. Grades
The following table summarizes recent grades from established financial institutions for NextEra Energy, Inc.:
| Grading Company | Action | New Grade | Date |
|---|---|---|---|
| Mizuho | Maintain | Neutral | 2026-01-28 |
| Argus Research | Maintain | Buy | 2026-01-28 |
| BMO Capital | Maintain | Outperform | 2026-01-27 |
| Wells Fargo | Maintain | Overweight | 2026-01-20 |
| Barclays | Maintain | Equal Weight | 2026-01-15 |
| Jefferies | Maintain | Hold | 2025-12-31 |
| UBS | Maintain | Buy | 2025-12-17 |
| JP Morgan | Maintain | Overweight | 2025-12-11 |
| BMO Capital | Maintain | Outperform | 2025-12-10 |
| UBS | Maintain | Buy | 2025-12-10 |
DTE Energy Company Grades
Below is a summary of recent grades from reputable grading firms for DTE Energy Company:
| Grading Company | Action | New Grade | Date |
|---|---|---|---|
| Jefferies | Maintain | Buy | 2026-01-28 |
| Mizuho | Maintain | Outperform | 2026-01-26 |
| Wells Fargo | Maintain | Overweight | 2026-01-20 |
| Barclays | Maintain | Equal Weight | 2026-01-15 |
| BMO Capital | Maintain | Market Perform | 2025-12-24 |
| UBS | Maintain | Buy | 2025-12-17 |
| JP Morgan | Maintain | Neutral | 2025-12-11 |
| Jefferies | Upgrade | Buy | 2025-12-11 |
| B of A Securities | Maintain | Buy | 2025-11-05 |
| Scotiabank | Maintain | Sector Perform | 2025-10-31 |
Which company has the best grades?
NextEra Energy, Inc. holds a consistent pattern of positive ratings, including multiple “Buy,” “Outperform,” and “Overweight” grades. DTE Energy Company also receives solid ratings but includes more moderate grades like “Market Perform” and “Neutral.” NextEra’s stronger consensus grades could imply higher analyst confidence, potentially influencing investor perceptions more favorably.
Risks specific to each company
The following categories identify critical pressure points and systemic threats facing both firms in the 2026 market environment:
1. Market & Competition
NextEra Energy, Inc.
- Dominates with 28,564 MW capacity and strong renewable focus, but faces intense clean energy competition.
DTE Energy Company
- Smaller scale with 2.3M customers, diversified fossil and renewables mix, facing regional competition in Michigan.
2. Capital Structure & Debt
NextEra Energy, Inc.
- Debt/equity at 1.64 signals high leverage; interest coverage is weak at 1.99x, a red flag for financial risk.
DTE Energy Company
- Slightly higher leverage at 1.99 D/E but better interest coverage at 2.44x; still a moderate concern.
3. Stock Volatility
NextEra Energy, Inc.
- Beta of 0.73 shows moderate volatility, typical for utilities with growth assets.
DTE Energy Company
- Lower beta at 0.48 indicates more defensive stock, less sensitive to market swings.
4. Regulatory & Legal
NextEra Energy, Inc.
- Faces complex regulatory scrutiny due to multi-state operations and renewable expansion mandates.
DTE Energy Company
- Regulatory risk concentrated in Michigan; potential for state policy shifts impacting fossil fuel assets.
5. Supply Chain & Operations
NextEra Energy, Inc.
- Large asset base with 77,000 circuit miles and 696 substations; supply chain disruptions could impact renewables construction.
DTE Energy Company
- Smaller scale but diverse operations including gas and power services increase operational complexity and supply chain risk.
6. ESG & Climate Transition
NextEra Energy, Inc.
- Leading renewable developer with strong ESG profile; transition risks mitigated by clean energy focus.
DTE Energy Company
- Transitional risk persists due to fossil fuel reliance; ESG improvements underway but lag behind peers.
7. Geopolitical Exposure
NextEra Energy, Inc.
- Primarily domestic US exposure; limited geopolitical risk but vulnerable to federal energy policy shifts.
DTE Energy Company
- Concentrated in Michigan; geopolitical risk mostly regulatory and environmental policy related.
Which company shows a better risk-adjusted profile?
NextEra’s dominant market presence and ESG leadership offer growth potential but are tempered by elevated leverage and weak liquidity ratios. DTE’s smaller scale and fossil fuel exposure pose transition risks but its stronger interest coverage and lower stock volatility create a more stable risk profile. Both firms fall in financial distress zones per Altman Z-scores, demanding caution.
NextEra’s biggest risk is its stretched capital structure undermining financial flexibility. DTE faces significant transition risk from fossil fuel reliance amid tightening environmental policies. DTE shows a better risk-adjusted profile with stronger liquidity and more conservative beta. However, both companies warrant careful monitoring given their Altman Z-scores below 1.3, signaling high bankruptcy risk.
Final Verdict: Which stock to choose?
NextEra Energy’s superpower lies in its robust revenue growth and operational scale, positioning it as a cash-generating giant in the renewable energy transition. Its main point of vigilance is its declining profitability relative to capital costs, signaling potential value erosion. This stock suits aggressive growth portfolios willing to weather volatility for long-term gains.
DTE Energy offers a strategic moat through steady operational returns and a solid dividend yield, reflecting its stable regulated utility model. Compared to NextEra, it presents a safer profile with improving profitability trends despite slower top-line growth. DTE fits well within GARP portfolios seeking balanced growth and income with moderate risk.
If you prioritize rapid expansion and market leadership in clean energy, NextEra outshines with its growth trajectory but demands tolerance for margin pressure. However, if you seek stability and improving returns with reliable dividends, DTE offers better stability and income potential, albeit with a more conservative growth outlook.
Disclaimer: Investment carries a risk of loss of initial capital. The past performance is not a reliable indicator of future results. Be sure to understand risks before making an investment decision.
Go Further
I encourage you to read the complete analyses of NextEra Energy, Inc. and DTE Energy Company to enhance your investment decisions: