Exelon Corporation and DTE Energy Company are two prominent players in the regulated electric utility sector, each delivering diverse energy solutions across the United States. Both companies emphasize sustainable energy innovation through nuclear, fossil, and renewable sources, competing in overlapping markets. This comparison aims to clarify which firm offers a stronger investment opportunity based on their strategic positioning and financial health. Join me as we explore which company stands out for your portfolio.
Table of contents
Companies Overview
I will begin the comparison between Exelon Corporation and DTE Energy Company by providing an overview of these two companies and their main differences.
Exelon Overview
Exelon Corporation is a utility services holding company operating in the United States and Canada. Its mission encompasses energy generation, delivery, and marketing through diverse sources including nuclear, fossil, wind, hydroelectric, biomass, and solar power. Exelon also provides electricity and natural gas sales to wholesale and retail customers, alongside various support services such as legal, IT, and asset management, positioning itself as a comprehensive energy provider.
DTE Overview
DTE Energy Company focuses on utility operations primarily in southeastern Michigan, serving millions of residential, commercial, and industrial customers. It generates electricity using fossil-fuel, nuclear, hydroelectric, and renewable sources and manages extensive electricity and natural gas distribution networks. Additionally, DTE offers industrial products, energy trading, and optimization services, highlighting its integrated approach within the utility sector.
Key similarities and differences
Both Exelon and DTE operate in the regulated electric industry, generating electricity from a mix of fossil fuels, nuclear, and renewables while distributing electricity and natural gas. However, Exelon’s operations extend across the US and Canada with a broader scale and more extensive service offerings, whereas DTE is regionally focused in Michigan with a notable emphasis on industrial products and energy trading segments. Employee counts and market capitalizations also differ significantly, reflecting their varied scales.
Income Statement Comparison
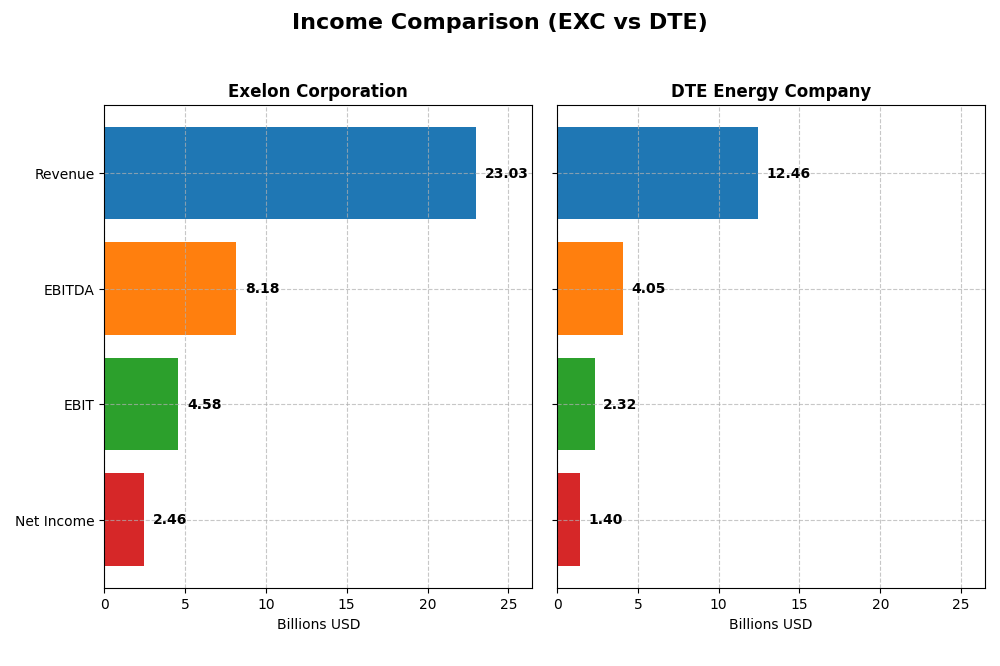
This table compares the key income statement metrics for Exelon Corporation and DTE Energy Company for the fiscal year 2024, providing a snapshot of their financial performance.
| Metric | Exelon Corporation | DTE Energy Company |
|---|---|---|
| Market Cap | 43.8B | 27.0B |
| Revenue | 23.0B | 12.5B |
| EBITDA | 8.18B | 4.05B |
| EBIT | 4.58B | 2.32B |
| Net Income | 2.46B | 1.40B |
| EPS | 2.45 | 6.78 |
| Fiscal Year | 2024 | 2024 |
Income Statement Interpretations
Exelon Corporation
Exelon Corporation’s revenue showed a notable decline overall from 2020 to 2024 but experienced a modest 6% growth in the latest year. Net income grew steadily by over 25% across the period, with a slight dip in net margin last year despite favorable improvements in gross and EBIT margins. The 2024 performance reflects stable margins and a positive EPS growth of 4.7%, indicating resilience despite revenue challenges.
DTE Energy Company
DTE Energy’s revenue increased by around 9% over the 2020-2024 period but fell by 2.3% in the most recent year. Net income growth was minimal overall, with a slight increase in net margin last year but an unfavorable decline in overall net margin and EPS growth during the period. The 2024 results showed a small drop in EBIT and revenue, reflecting some operational pressures despite maintaining favorable gross and EBIT margins.
Which one has the stronger fundamentals?
Exelon Corporation demonstrates stronger fundamentals with predominantly favorable margin metrics, steady net income growth, and positive EPS trends. Conversely, DTE Energy shows mixed results, with an overall unfavorable income statement evaluation due to declining EPS and net margin trends. Exelon’s consistent margin improvement and income growth suggest a more robust income statement profile between the two.
Financial Ratios Comparison
The table below presents a side-by-side comparison of key financial ratios for Exelon Corporation (EXC) and DTE Energy Company (DTE) based on their most recent full-year data for 2024.
| Ratios | Exelon Corporation (EXC) | DTE Energy Company (DTE) |
|---|---|---|
| ROE | 9.14% | 12.00% |
| ROIC | 3.93% | 4.65% |
| P/E | 15.35 | 17.80 |
| P/B | 1.40 | 2.14 |
| Current Ratio | 0.87 | 0.71 |
| Quick Ratio | 0.78 | 0.46 |
| D/E (Debt to Equity Ratio) | 1.73 | 1.99 |
| Debt-to-Assets | 43.3% | 47.6% |
| Interest Coverage | 2.26 | 2.20 |
| Asset Turnover | 0.21 | 0.26 |
| Fixed Asset Turnover | 0.29 | 0.40 |
| Payout Ratio | 61.9% | 57.7% |
| Dividend Yield | 4.04% | 3.24% |
Interpretation of the Ratios
Exelon Corporation
Exelon shows a mixed ratio profile with strong net margin (10.68%, favorable) and dividend yield (4.04%, favorable), but weaker returns on equity (9.14%) and invested capital (3.93%), both unfavorable. Its liquidity ratios are below 1, indicating potential short-term liquidity concerns. Exelon pays dividends with a solid yield, but coverage by free cash flow is negative, suggesting possible sustainability risks.
DTE Energy Company
DTE boasts a slightly better net margin (11.27%, favorable) and a higher return on equity (12.0%, neutral), though return on invested capital is still unfavorable at 4.65%. Liquidity is also weak with current and quick ratios below 1. The company maintains a 3.24% dividend yield, supported by moderate payout ratios, but free cash flow coverage is negative, which may affect dividend sustainability.
Which one has the best ratios?
Both companies have slightly unfavorable overall ratio profiles, but Exelon has a higher dividend yield and slightly more favorable net margin. DTE, however, exhibits better returns on equity and capital employed with fewer unfavorable ratios proportionally. Neither stands out decisively, each showing strengths and weaknesses for investors to weigh carefully.
Strategic Positioning
This section compares the strategic positioning of Exelon Corporation and DTE Energy Company, including Market position, Key segments, and Exposure to technological disruption:
Exelon Corporation
- Large market cap of 43.8B with moderate competitive pressure in regulated electric utilities.
- Diversified key segments including multiple electric utilities and energy commodities.
- Exposure to disruption includes renewable energy generation and energy-related services.
DTE Energy Company
- Smaller market cap of 27.0B, focused on southeastern Michigan with moderate competitive pressure.
- Concentrated key segments: Electric, Gas, Energy Trading, and Industrial Projects.
- Exposure includes renewable assets and active energy trading operations.
Exelon Corporation vs DTE Energy Company Positioning
Exelon operates a diversified portfolio across several regional utilities and energy commodities, providing broad market exposure. DTE is more concentrated geographically and segment-wise but includes strong energy trading operations. Diversification at Exelon may reduce segment-specific risks, while DTE’s focused approach could enhance operational efficiency.
Which has the best competitive advantage?
Both companies have a slightly unfavorable moat status, shedding value but showing growing ROIC trends. Exelon’s scale offers broad diversification, while DTE’s growing profitability suggests improving capital efficiency, reflecting similar competitive challenges and opportunities.
Stock Comparison
The stock prices of Exelon Corporation (EXC) and DTE Energy Company (DTE) have shown notable bullish trends over the past 12 months, with both experiencing decelerating momentum and recent downward corrections in trading dynamics.

Trend Analysis
Exelon Corporation’s stock rose 24.03% over the past year, indicating a bullish trend with decelerating acceleration. The highest price reached 48.04, lowest was 34.31, and recent months show a -9.87% decline with a mild negative slope.
DTE Energy’s stock increased by 20.49% over the last 12 months, also bullish with deceleration. It exhibited higher volatility (std deviation 10.2) with a peak at 141.95 and a low of 106.25. Recent trend shows an -8.42% drop with stronger negative slope.
Comparatively, Exelon Corporation delivered the highest market performance, outperforming DTE Energy by about 3.5 percentage points over the analyzed period.
Target Prices
Analyst consensus target prices indicate a positive outlook for both Exelon Corporation and DTE Energy Company.
| Company | Target High | Target Low | Consensus |
|---|---|---|---|
| Exelon Corporation | 57 | 39 | 50.86 |
| DTE Energy Company | 157 | 138 | 148.29 |
Exelon’s consensus target price of 50.86 suggests upside potential from the current 43.3 USD, while DTE’s consensus at 148.29 is considerably above its current price of 129.89 USD, reflecting generally optimistic analyst expectations.
Analyst Opinions Comparison
This section compares analysts’ ratings and grades for Exelon Corporation and DTE Energy Company:
Rating Comparison
EXC Rating
- Rating: B, considered very favorable by analysts.
- Discounted Cash Flow Score: Moderate at 3, indicating balanced valuation.
- ROE Score: Moderate at 3, reflecting efficient profit generation.
- ROA Score: Moderate at 3, indicating effective asset utilization.
- Debt To Equity Score: Moderate at 2, implying manageable financial risk.
- Overall Score: Moderate at 3, summarizing solid financial standing.
DTE Rating
- Rating: C, also considered very favorable despite lower scores.
- Discounted Cash Flow Score: Very unfavorable at 1, suggesting overvaluation.
- ROE Score: Moderate at 3, showing comparable profitability efficiency.
- ROA Score: Moderate at 2, somewhat less effective asset use than EXC.
- Debt To Equity Score: Very unfavorable at 1, indicating higher financial risk.
- Overall Score: Moderate at 2, reflecting weaker overall financial position.
Which one is the best rated?
Exelon Corporation is better rated overall with a B rating and higher scores across most financial metrics, especially discounted cash flow and overall score. DTE Energy, despite a very favorable rating status, shows weaker valuation and financial risk scores.
Scores Comparison
Here is a comparison of the financial scores for Exelon Corporation (EXC) and DTE Energy Company (DTE):
EXC Scores
- Altman Z-Score: 0.78, indicates financial distress risk.
- Piotroski Score: 5, representing average financial strength.
DTE Scores
- Altman Z-Score: 1.03, also in distress zone but slightly higher.
- Piotroski Score: 7, reflecting strong financial health.
Which company has the best scores?
Based on the provided data, DTE shows a slightly better Altman Z-Score but both remain in the distress zone. DTE’s Piotroski Score of 7 is notably stronger than EXC’s average score of 5, indicating better financial health for DTE.
Grades Comparison
Here is a detailed comparison of recent grades for Exelon Corporation and DTE Energy Company:
Exelon Corporation Grades
The following table summarizes recent grades assigned to Exelon Corporation by major grading companies:
| Grading Company | Action | New Grade | Date |
|---|---|---|---|
| UBS | Maintain | Neutral | 2025-12-17 |
| JP Morgan | Maintain | Neutral | 2025-12-12 |
| Morgan Stanley | Maintain | Equal Weight | 2025-10-22 |
| Keybanc | Maintain | Underweight | 2025-10-15 |
| Jefferies | Maintain | Buy | 2025-10-15 |
| Barclays | Maintain | Overweight | 2025-10-14 |
| UBS | Maintain | Neutral | 2025-10-10 |
| Morgan Stanley | Maintain | Equal Weight | 2025-09-25 |
| Keybanc | Maintain | Underweight | 2025-07-16 |
| UBS | Maintain | Neutral | 2025-07-11 |
Exelon’s grades show a mixed trend, with multiple neutral and equal weight ratings, a few underweight, and some buy and overweight opinions.
DTE Energy Company Grades
The following table presents recent grades assigned to DTE Energy Company by reputable grading firms:
| Grading Company | Action | New Grade | Date |
|---|---|---|---|
| BMO Capital | Maintain | Market Perform | 2025-12-24 |
| UBS | Maintain | Buy | 2025-12-17 |
| JP Morgan | Maintain | Neutral | 2025-12-11 |
| Jefferies | Upgrade | Buy | 2025-12-11 |
| B of A Securities | Maintain | Buy | 2025-11-05 |
| Scotiabank | Maintain | Sector Perform | 2025-10-31 |
| Morgan Stanley | Maintain | Overweight | 2025-10-22 |
| Barclays | Maintain | Equal Weight | 2025-10-14 |
| UBS | Maintain | Buy | 2025-10-10 |
| Scotiabank | Downgrade | Sector Perform | 2025-10-03 |
DTE’s grades predominantly reflect buy and overweight ratings, with some sector perform and neutral assessments, showing a generally positive outlook.
Which company has the best grades?
DTE Energy Company has received more buy and overweight ratings compared to Exelon Corporation’s more neutral and underweight grades. This pattern suggests a comparatively stronger analyst sentiment for DTE, potentially impacting investor confidence and portfolio allocations.
Strengths and Weaknesses
Below is a comparison table outlining the key strengths and weaknesses of Exelon Corporation (EXC) and DTE Energy Company (DTE) based on the most recent financial and operational data:
| Criterion | Exelon Corporation (EXC) | DTE Energy Company (DTE) |
|---|---|---|
| Diversification | Highly diversified across multiple regulated utilities with strong revenue from Commonwealth Edison (8.2B) and Pepco Holdings (6.4B) | Diversified portfolio including Electric (5.8B), Gas (1.7B), and Energy Trading (4.6B) segments |
| Profitability | Net margin 10.7%, ROIC 3.9% below WACC (5%), indicating value destruction but improving profitability | Net margin 11.3%, ROIC 4.7% below WACC (5.1%), also value destroying but with a positive ROIC trend |
| Innovation | Moderate innovation focus; ROIC trend shows improvement suggesting operational enhancements | Innovation reflected in growth of DTE Vantage segment (809M), with steady ROIC growth indicating gradual efficiency gains |
| Global presence | Primarily U.S.-based with strong regional utility footprint, limited global reach | U.S.-focused operations with energy trading expanding market exposure, but no significant global presence |
| Market Share | Leading in regulated electric and gas utilities in key regions, strong market share in Northeast U.S. | Solid regional market share in Michigan with growing energy trading business contributing to revenue diversification |
Key takeaways: Both companies face challenges with ROIC below WACC, signaling value destruction; however, their improving ROIC trends suggest gradual profitability recovery. Exelon benefits from a larger, more diversified regulated utility base, while DTE leverages a growing energy trading segment. Both exhibit slightly unfavorable financial ratios, warranting cautious investment consideration.
Risk Analysis
Below is a comparison table highlighting key risk factors for Exelon Corporation (EXC) and DTE Energy Company (DTE) based on the most recent 2024 data:
| Metric | Exelon Corporation (EXC) | DTE Energy Company (DTE) |
|---|---|---|
| Market Risk | Beta 0.56 – low volatility, moderate market sensitivity | Beta 0.48 – low volatility, slightly less market-sensitive |
| Debt level | Debt-to-Equity 1.73 (unfavorable), Debt-to-Assets 43.3% (neutral) | Debt-to-Equity 1.99 (unfavorable), Debt-to-Assets 47.6% (neutral) |
| Regulatory Risk | High, given exposure to nuclear and fossil-fuel sectors with evolving regulations | High, due to regulated electric and gas distribution, and fossil fuel reliance |
| Operational Risk | Moderate, with diverse energy mix but lower asset turnover (0.21) | Moderate, diversified but low asset turnover (0.26) and extensive infrastructure |
| Environmental Risk | Elevated, nuclear and fossil fuel operations pose risks amid climate policies | Elevated, fossil fuel and coal exposure amid increasing environmental scrutiny |
| Geopolitical Risk | Moderate, US-Canada operations with potential cross-border trade impacts | Low to moderate, focused on Michigan with limited international exposure |
In summary, both companies face significant regulatory and environmental risks due to their reliance on fossil fuels and nuclear power. Debt levels are relatively high, increasing financial risk, with EXC showing slightly better market stability. EXC’s Altman Z-score in the distress zone signals caution on bankruptcy risk, while DTE also shows distress-zone risk but with a stronger Piotroski score. Investors should weigh these risks carefully, especially regulatory shifts and debt management.
Which Stock to Choose?
Exelon Corporation (EXC) shows a mixed income evolution with favorable gross and EBIT margins and improving profitability metrics, despite a 30% revenue decline over five years. Its financial ratios reveal some weaknesses, including a high debt level and low liquidity, leading to a slightly unfavorable global ratios opinion. The company’s rating is very favorable overall, supported by a moderate score profile.
DTE Energy Company (DTE) presents a stable income statement with favorable margins but some recent revenue contraction and weaker growth over the period. Financial ratios indicate moderate profitability and leverage concerns, with a slightly unfavorable global ratios evaluation. Its rating is also very favorable, though with more moderate to unfavorable component scores compared to EXC.
For investors prioritizing growth and improving profitability, Exelon’s favorable income trends and moderate rating might appear more attractive. Conversely, those favoring stronger financial health and stability could find DTE’s steadier performance and stronger Piotroski score suggestive of quality. Both firms show value destruction by ROIC vs WACC but with increasing profitability, indicating nuanced risk profiles.
Disclaimer: Investment carries a risk of loss of initial capital. The past performance is not a reliable indicator of future results. Be sure to understand risks before making an investment decision.
Go Further
I encourage you to read the complete analyses of Exelon Corporation and DTE Energy Company to enhance your investment decisions: