DTE Energy Company and Eversource Energy are two prominent players in the regulated electric utility sector, each serving millions of customers across distinct U.S. regions. Both companies emphasize innovation in energy distribution and renewable integration, competing in overlapping markets with strong commitments to sustainable growth. For investors seeking stability and growth in the utilities space, this comparison will reveal which company offers the most compelling opportunity for your portfolio.
Table of contents
Companies Overview
I will begin the comparison between DTE Energy Company and Eversource Energy by providing an overview of these two companies and their main differences.
DTE Energy Company Overview
DTE Energy Company operates primarily in the regulated electric industry, serving approximately 2.3M electricity customers and 1.3M natural gas customers in Michigan. Its business spans electricity generation from fossil fuels, nuclear, hydro, and renewables, alongside natural gas distribution and energy trading. Founded in 1903 and headquartered in Detroit, DTE focuses on integrated utility operations across multiple energy segments.
Eversource Energy Overview
Eversource Energy is a public utility holding company focused on the regulated electric and natural gas distribution markets in Connecticut, Massachusetts, and New Hampshire. It also operates water utilities serving about 226K customers. The company provides electric transmission, solar power, and natural gas distribution services from its base in Springfield, Massachusetts. Eversource employs 10,000 people and has a diversified regional utility portfolio.
Key similarities and differences
Both companies operate in the regulated electric utility sector and provide natural gas distribution, serving residential, commercial, and industrial customers. However, DTE has a larger electricity customer base, emphasizes power generation including nuclear and renewables, and engages in energy trading. Eversource distinguishes itself with water distribution services and a regional focus in New England, employing a larger workforce relative to its market cap.
Income Statement Comparison
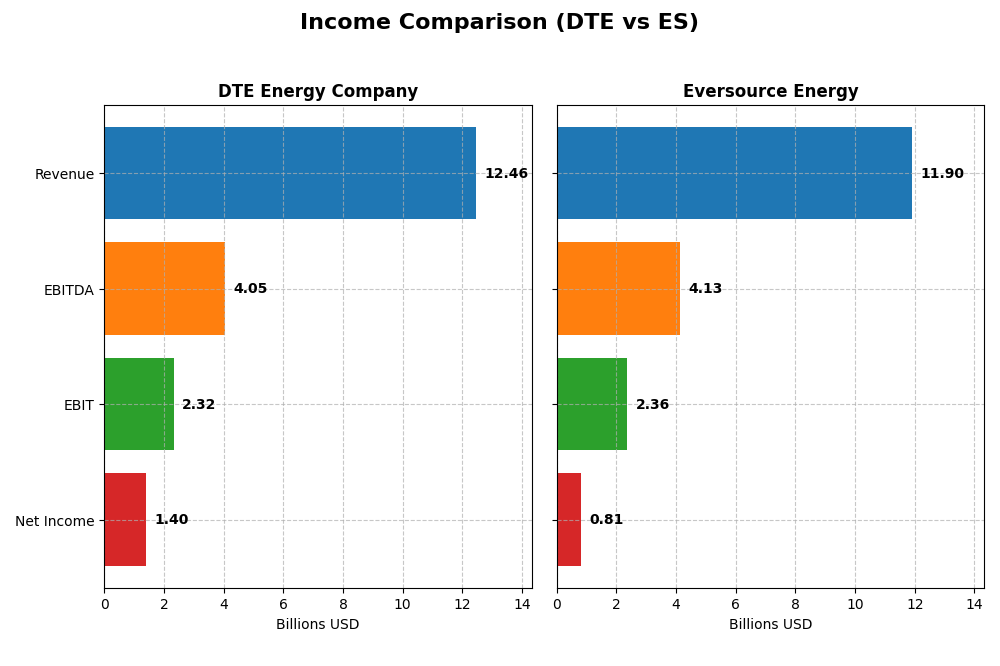
This table provides a side-by-side comparison of the key income statement metrics for DTE Energy Company and Eversource Energy for the fiscal year 2024.
| Metric | DTE Energy Company | Eversource Energy |
|---|---|---|
| Market Cap | 27B | 25B |
| Revenue | 12.46B | 11.90B |
| EBITDA | 4.05B | 4.13B |
| EBIT | 2.32B | 2.36B |
| Net Income | 1.40B | 812M |
| EPS | 6.78 | 2.27 |
| Fiscal Year | 2024 | 2024 |
Income Statement Interpretations
DTE Energy Company
DTE’s revenue showed a modest overall growth of 9.05% from 2020 to 2024, though it declined by 2.26% in the latest year. Net income grew slightly by 2.41% overall, with a stable net margin around 11.25%. In 2024, gross profit held steady while EBIT and revenue edged lower, indicating some margin pressure despite consistent earnings per share.
Eversource Energy
Eversource’s revenue increased significantly by 33.65% over the period but fell marginally by 0.08% in 2024. Net income declined sharply by 32.65% overall, though it rebounded strongly in the last year with a 278.74% EPS increase and improved net margin. EBIT surged 305.78% in 2024, reflecting operational recovery despite past volatility.
Which one has the stronger fundamentals?
DTE presents more stable income fundamentals with consistent margins and moderate growth, albeit with some recent softness in revenue and EBIT. Eversource shows stronger recent operational improvements and margin expansion but suffers from notable net income and EPS volatility over the longer term. The choice depends on preference for stability versus recent recovery dynamics.
Financial Ratios Comparison
The table below presents a side-by-side comparison of key financial ratios for DTE Energy Company and Eversource Energy for the fiscal year 2024, reflecting their latest reported figures.
| Ratios | DTE Energy Company | Eversource Energy |
|---|---|---|
| ROE | 12.0% | 5.4% |
| ROIC | 4.6% | 3.2% |
| P/E | 17.8 | 25.3 |
| P/B | 2.14 | 1.37 |
| Current Ratio | 0.71 | 0.76 |
| Quick Ratio | 0.46 | 0.67 |
| D/E | 1.99 | 1.94 |
| Debt-to-Assets | 47.6% | 48.9% |
| Interest Coverage | 2.20 | 2.43 |
| Asset Turnover | 0.26 | 0.20 |
| Fixed Asset Turnover | 0.40 | 0.29 |
| Payout ratio | 57.7% | 124.3% |
| Dividend yield | 3.24% | 4.91% |
Interpretation of the Ratios
DTE Energy Company
DTE Energy Company shows a mix of strengths and weaknesses in its financial ratios, with a favorable net margin of 11.27% and a solid dividend yield of 3.24%. However, concerns arise from its low current ratio (0.71), high debt-to-equity ratio (1.99), and weak asset turnover metrics. The company maintains a neutral return on equity of 12.0%, but an unfavorable return on invested capital of 4.65%. Dividend payments appear sustainable with a reasonable payout supported by free cash flow, though caution is advised given some financial pressures.
Eversource Energy
Eversource Energy’s ratios reveal more challenges, including an unfavorable return on equity of 5.4% and a higher price-to-earnings ratio of 25.29, which may suggest overvaluation. The company’s dividend yield is attractive at 4.91%, supported by a moderate payout. Liquidity ratios remain below optimal levels, with a current ratio of 0.76 and quick ratio of 0.67. Debt levels are high and asset turnover remains weak, reflecting operational inefficiencies. Overall, the financial profile signals caution despite dividend appeal.
Which one has the best ratios?
Comparing both, DTE Energy Company has a slightly more favorable financial profile with stronger profitability and a balanced dividend yield, despite some liquidity and efficiency issues. Eversource Energy faces greater difficulties, particularly in returns and valuation metrics, combined with higher debt concerns. Thus, DTE’s ratios present a marginally better position based on this evaluation.
Strategic Positioning
This section compares the strategic positioning of DTE Energy Company and Eversource Energy across market position, key segments, and exposure to technological disruption:
DTE Energy Company
- Established utility with 2.3M electric and 1.3M gas customers in Michigan; moderate competitive pressure.
- Diverse revenue streams from Electric, Gas, Energy Trading, and Industrial Projects segments.
- Utilizes fossil-fuel, nuclear, hydroelectric, wind, and renewables; active in power and natural gas trading.
Eversource Energy
- Multi-state utility serving Connecticut, Massachusetts, New Hampshire with diversified utility services; competitive in regulated markets.
- Revenue driven by Electric Distribution, Transmission, Natural Gas, and Water Distribution segments.
- Engages in solar power and regulated water utilities; traditional utility operations with renewable integration.
DTE Energy Company vs Eversource Energy Positioning
DTE adopts a diversified approach with multiple business segments including energy trading and industrial services, while Eversource focuses more on regulated utility segments across multiple states. DTE’s breadth offers varied revenue sources; Eversource’s concentration supports stable regulated income.
Which has the best competitive advantage?
Both companies are currently shedding value, but DTE shows a growing ROIC trend indicating improving profitability, whereas Eversource faces declining ROIC and worsening profitability, suggesting DTE has a relatively stronger competitive advantage.
Stock Comparison
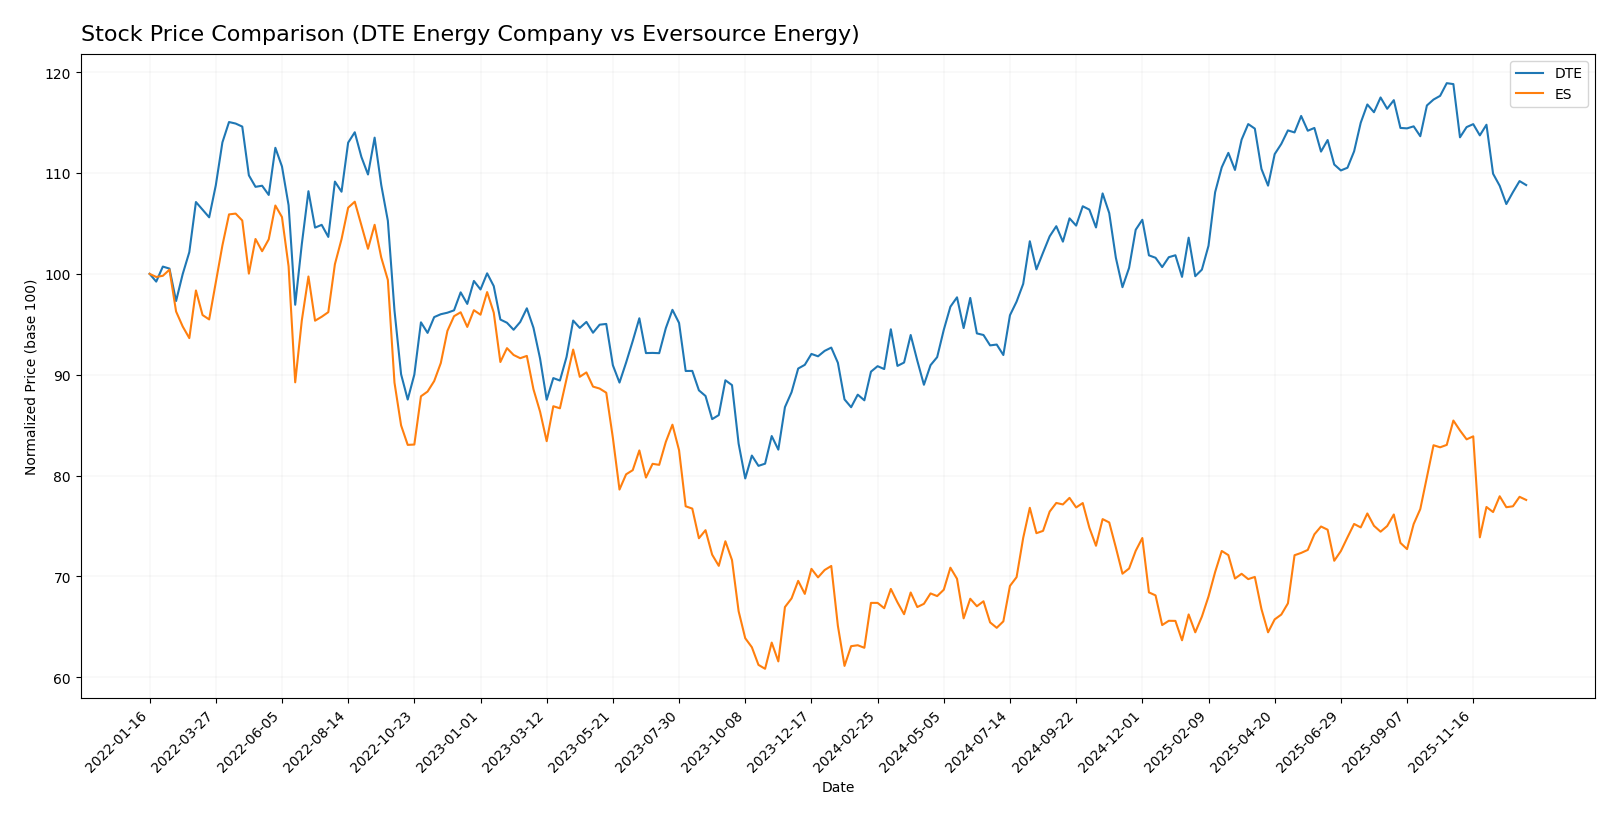
The stock prices of DTE Energy Company and Eversource Energy have exhibited significant bullish trends over the past 12 months, with both showing deceleration in growth and recent downward movements since late 2025.
Trend Analysis
DTE Energy Company’s stock price increased by 20.49% over the past year, indicating a bullish trend with decelerating momentum and a volatility standard deviation of 10.2. The recent period shows an 8.42% decline with seller dominance.
Eversource Energy’s stock price rose 15.15% over the same period, also bullish with deceleration and a standard deviation of 4.5. Its recent price dropped 9.21%, accompanied by a weaker trend slope and seller dominance.
Comparing both, DTE Energy delivered the highest market performance with a larger overall price increase and higher volatility, despite both stocks facing recent downward corrections.
Target Prices
Analysts provide a clear target price consensus for DTE Energy Company and Eversource Energy.
| Company | Target High | Target Low | Consensus |
|---|---|---|---|
| DTE Energy Company | 157 | 138 | 148.29 |
| Eversource Energy | 81 | 60 | 68 |
The target consensus suggests moderate upside potential for both stocks compared to their current prices: DTE trades at 129.89 USD, below its 148.29 USD consensus, while Eversource is close to its 68 USD target, trading at 67.79 USD. This indicates cautious optimism among analysts.
Analyst Opinions Comparison
This section compares analysts’ ratings and grades for DTE Energy Company and Eversource Energy:
Rating Comparison
DTE Rating
- Rating: C, considered Very Favorable overall.
- Discounted Cash Flow Score: 1, marked as Very Unfavorable for valuation.
- ROE Score: 3, indicating moderate efficiency in generating profit from equity.
- ROA Score: 2, showing moderate asset utilization effectiveness.
- Debt to Equity Score: 1, indicating very unfavorable financial risk profile.
- Overall Score: 2, reflecting a moderate financial standing.
ES Rating
- Rating: C+, also rated Very Favorable overall.
- Discounted Cash Flow Score: 1, also Very Unfavorable for valuation.
- ROE Score: 3, similarly moderate efficiency in profit generation.
- ROA Score: 3, higher moderate effectiveness in asset utilization.
- Debt to Equity Score: 1, likewise very unfavorable financial risk profile.
- Overall Score: 2, also reflecting a moderate financial standing.
Which one is the best rated?
Eversource Energy holds a slightly better rating with a C+ versus DTE’s C, supported by a stronger ROA Score and higher Price to Book Score. Both share moderate overall scores and face similar challenges in valuation and debt risk.
Scores Comparison
Here is a comparison of the Altman Z-Score and Piotroski Score for DTE Energy Company and Eversource Energy:
DTE Scores
- Altman Z-Score: 1.03, indicating financial distress zone risk of bankruptcy
- Piotroski Score: 7, classified as strong financial health
ES Scores
- Altman Z-Score: 0.75, indicating financial distress zone risk of bankruptcy
- Piotroski Score: 6, classified as average financial health
Which company has the best scores?
Based strictly on the scores provided, DTE has a higher Piotroski Score (7 vs. 6), indicating stronger financial health, while both companies fall within the distress zone for Altman Z-Score, with ES slightly lower.
Grades Comparison
Here is a detailed comparison of the grades assigned to DTE Energy Company and Eversource Energy by recognized grading firms:
DTE Energy Company Grades
The following table presents recent grades from reputable grading companies for DTE Energy Company:
| Grading Company | Action | New Grade | Date |
|---|---|---|---|
| BMO Capital | Maintain | Market Perform | 2025-12-24 |
| UBS | Maintain | Buy | 2025-12-17 |
| JP Morgan | Maintain | Neutral | 2025-12-11 |
| Jefferies | Upgrade | Buy | 2025-12-11 |
| B of A Securities | Maintain | Buy | 2025-11-05 |
| Scotiabank | Maintain | Sector Perform | 2025-10-31 |
| Morgan Stanley | Maintain | Overweight | 2025-10-22 |
| Barclays | Maintain | Equal Weight | 2025-10-14 |
| UBS | Maintain | Buy | 2025-10-10 |
| Scotiabank | Downgrade | Sector Perform | 2025-10-03 |
Overall, grades for DTE Energy Company show a generally positive trend with multiple buy and overweight ratings, despite some sector perform assessments and one downgrade.
Eversource Energy Grades
The following table presents recent grades from reputable grading companies for Eversource Energy:
| Grading Company | Action | New Grade | Date |
|---|---|---|---|
| UBS | Maintain | Neutral | 2025-12-17 |
| JP Morgan | Maintain | Underweight | 2025-12-12 |
| Janney Montgomery Scott | Upgrade | Buy | 2025-11-24 |
| Scotiabank | Maintain | Sector Underperform | 2025-11-20 |
| Mizuho | Downgrade | Neutral | 2025-11-20 |
| Wells Fargo | Downgrade | Equal Weight | 2025-11-20 |
| UBS | Downgrade | Neutral | 2025-11-06 |
| BMO Capital | Maintain | Market Perform | 2025-11-06 |
| Scotiabank | Maintain | Sector Underperform | 2025-11-06 |
| Mizuho | Maintain | Outperform | 2025-10-27 |
Grades for Eversource Energy reflect a mixed to cautious outlook, with several downgrades and underweight ratings alongside a few buy and outperform grades.
Which company has the best grades?
DTE Energy Company has received more consistent buy and overweight ratings from analysts compared to Eversource Energy, which shows a more mixed and cautious grading profile. This difference may influence investors seeking relatively stronger analyst confidence and stability.
Strengths and Weaknesses
Below is a comparison of key strengths and weaknesses of DTE Energy Company (DTE) and Eversource Energy (ES) based on recent financial and operational data.
| Criterion | DTE Energy Company (DTE) | Eversource Energy (ES) |
|---|---|---|
| Diversification | Strong energy mix: Electric 5.8B, Gas 1.7B, Energy Trading 4.6B, plus growth in DTE Vantage segment | Broad utility services: Electric Distribution 9.1B, Transmission 2.1B, Gas 2.1B, Water and Others diversified |
| Profitability | Net margin 11.27% (favorable), ROE 12% (neutral), ROIC 4.65% (unfavorable, below WACC) | Net margin 6.82% (neutral), ROE 5.4% (unfavorable), ROIC 3.18% (unfavorable, below WACC) |
| Innovation | Growing ROIC trend (+34%) suggests improving capital efficiency and innovation efforts | Declining ROIC trend (-10%) indicates challenges in maintaining profitability and innovation |
| Global presence | Primarily focused on US markets with strong regional energy trading | Primarily regional US utility services with no significant global exposure |
| Market Share | Solid presence in energy trading and electric/gas utilities in Midwest | Leading market share in New England utilities with diversified service segments |
In summary, DTE shows improving profitability and diversification with promising ROIC growth despite currently shedding value, while Eversource faces profitability pressures and declining ROIC, reflecting operational challenges. Both have solid market positions, but DTE’s innovation and expanding segments may offer better long-term value.
Risk Analysis
Below is a comparative table highlighting key risks for DTE Energy Company and Eversource Energy based on the most recent 2024 data:
| Metric | DTE Energy Company | Eversource Energy |
|---|---|---|
| Market Risk | Moderate (Beta 0.48) | Moderate (Beta 0.77) |
| Debt level | High (Debt/Equity 1.99) | High (Debt/Equity 1.94) |
| Regulatory Risk | Moderate (Utilities sector) | Moderate (Utilities sector) |
| Operational Risk | Medium (Asset turnover low) | Medium (Asset turnover low) |
| Environmental Risk | Present (Fossil fuel exposure) | Present (Mixed energy sources) |
| Geopolitical Risk | Low (US-focused operations) | Low (US-focused operations) |
The most impactful and likely risks for both companies stem from their high debt levels coupled with low liquidity ratios, increasing financial vulnerability. Additionally, environmental risks persist due to fossil fuel reliance, while regulatory shifts in the utilities sector could further pressure margins. Investors should closely monitor debt management and environmental policy changes.
Which Stock to Choose?
DTE Energy Company shows a mixed income evolution with a slight revenue decline in the past year but overall growth since 2020. Its financial ratios reveal a slightly unfavorable profile with some strengths in net margin and dividend yield, yet weaknesses in liquidity and asset turnover. Profitability is moderate, with a growing ROIC but still below WACC, indicating slight value destruction. Debt levels are high, and the company holds a very favorable rating overall.
Eversource Energy exhibits favorable income growth over the recent year despite some long-term net income decline. Its financial ratios are mostly unfavorable, particularly in ROE and leverage metrics, although it has a strong dividend yield and a favorable price-to-book ratio. Profitability is challenged by a declining ROIC below WACC, signaling significant value erosion. Debt remains high, with a very favorable rating akin to DTE.
For investors focused on growth and income stability, DTE’s slightly unfavorable financial ratios but improving profitability might appear more appealing. Conversely, risk-tolerant investors prioritizing recent income improvements could find Eversource’s strong income growth and dividend yield attractive despite its unfavorable ratio profile and declining profitability. The choice could depend on the investor’s risk appetite and emphasis on either stability or growth potential.
Disclaimer: Investment carries a risk of loss of initial capital. The past performance is not a reliable indicator of future results. Be sure to understand risks before making an investment decision.
Go Further
I encourage you to read the complete analyses of DTE Energy Company and Eversource Energy to enhance your investment decisions: