In the evolving utilities sector, DTE Energy Company and Evergy, Inc. stand out as key players delivering regulated electric services across different U.S. regions. Both companies blend traditional energy sources with renewables, pursuing innovation to meet growing demand and sustainability goals. Their market overlap and strategic directions make them compelling investment candidates. Join me as we analyze which of these utilities offers the best potential for your portfolio in 2026.
Table of contents
Companies Overview
I will begin the comparison between DTE Energy Company and Evergy, Inc. by providing an overview of these two companies and their main differences.
DTE Energy Company Overview
DTE Energy Company operates in the regulated electric industry, serving approximately 2.3M customers in southeastern Michigan. Its mission focuses on generating, purchasing, and distributing electricity through diverse sources including fossil fuels, nuclear, hydroelectric, and renewables. The company also provides natural gas services to 1.3M customers and offers industrial power, energy trading, and related services, positioning itself as a comprehensive utility provider since 1903.
Evergy, Inc. Overview
Evergy, Inc. engages in the generation, transmission, distribution, and sale of electricity primarily in Kansas and Missouri. With a customer base of about 1.62M, it produces power from coal, hydroelectric, landfill gas, uranium, natural gas, oil, solar, wind, and other renewables. Founded in 2017, Evergy emphasizes a broad energy mix and extensive transmission and distribution infrastructure across its service regions in the US Midwest.
Key similarities and differences
Both DTE and Evergy operate in the regulated electric utility sector, utilizing a mix of conventional and renewable energy sources to serve residential, commercial, and industrial customers. DTE has a larger customer base and offers additional natural gas and industrial services, while Evergy focuses on electricity generation and delivery with a more recent establishment. Both companies maintain extensive transmission and distribution networks but differ in geographic focus and service scope.
Income Statement Comparison
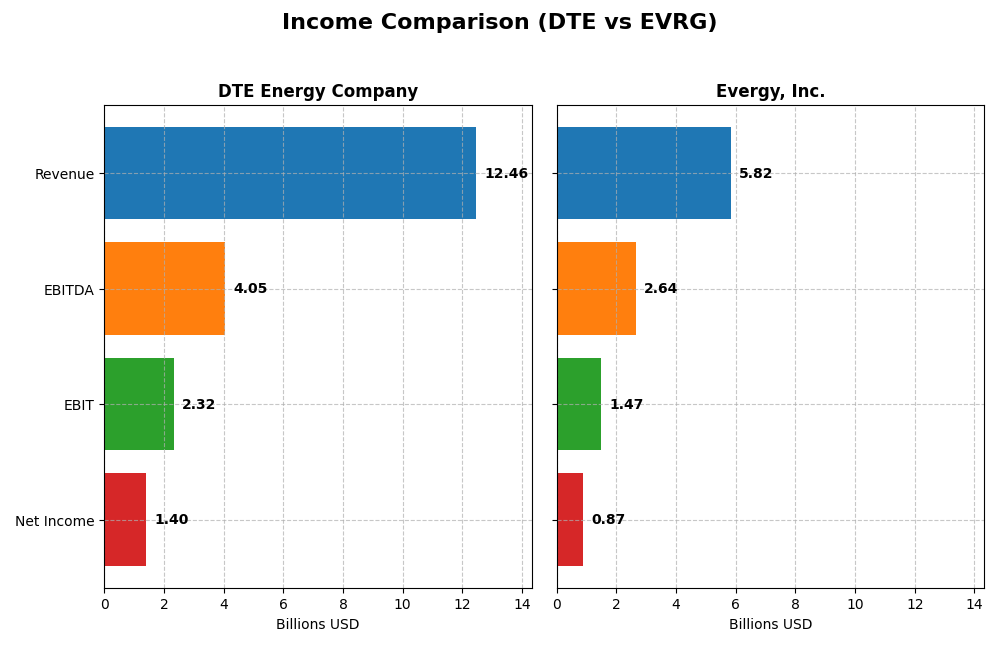
The following table presents a side-by-side comparison of key income statement metrics for DTE Energy Company and Evergy, Inc. for the fiscal year 2024.
| Metric | DTE Energy Company | Evergy, Inc. |
|---|---|---|
| Market Cap | 27B | 16.8B |
| Revenue | 12.46B | 5.82B |
| EBITDA | 4.05B | 2.64B |
| EBIT | 2.32B | 1.47B |
| Net Income | 1.40B | 873.5M |
| EPS | 6.78 | 3.79 |
| Fiscal Year | 2024 | 2024 |
Income Statement Interpretations
DTE Energy Company
From 2020 to 2024, DTE Energy experienced a 9.05% revenue growth, though a slight decline of 2.26% occurred in 2024. Net income increased modestly by 2.41% overall, with a small rise in the latest year. Margins showed mixed signals: gross and net margins were favorable but net margin growth over the period was unfavorable, indicating some pressure on profitability.
Evergy, Inc.
Evergy demonstrated consistent revenue growth of 18.53% from 2020 to 2024, with a 6.17% increase in 2024 alone. Net income surged by 41.27% over the period, supported by a 12.5% net margin growth last year. Margins were generally strong, with EBIT and net margins marked favorable, reflecting improving operational efficiency and profitability.
Which one has the stronger fundamentals?
Evergy’s income statement reveals stronger fundamentals with broad favorable growth in revenue, net income, and margins, including substantial net margin expansion. In contrast, DTE’s results are mixed, with slower growth and some unfavorable margin trends. Evergy’s more robust profitability and growth metrics suggest a stronger income statement performance overall.
Financial Ratios Comparison
This table presents a side-by-side comparison of key financial ratios for DTE Energy Company and Evergy, Inc. based on their most recent fiscal year, 2024.
| Ratios | DTE Energy Company | Evergy, Inc. |
|---|---|---|
| ROE | 12.00% | 8.77% |
| ROIC | 4.65% | 4.52% |
| P/E | 17.80 | 16.23 |
| P/B | 2.14 | 1.42 |
| Current Ratio | 0.71 | 0.50 |
| Quick Ratio | 0.46 | 0.27 |
| D/E (Debt-to-Equity) | 1.99 | 1.41 |
| Debt-to-Assets | 48% | 44% |
| Interest Coverage | 2.20 | 2.57 |
| Asset Turnover | 0.26 | 0.18 |
| Fixed Asset Turnover | 0.40 | 0.23 |
| Payout Ratio | 57.7% | 68.3% |
| Dividend Yield | 3.24% | 4.21% |
Interpretation of the Ratios
DTE Energy Company
DTE Energy’s ratios show mixed strength with a favorable net margin of 11.27% and dividend yield of 3.24%, but its return on invested capital (4.65%) and liquidity ratios are unfavorable. The company carries a high debt-to-equity ratio of 1.99, raising some concerns. Dividend payments appear sustainable given the coverage by free cash flow, though capital structure risks persist.
Evergy, Inc.
Evergy presents a higher net margin at 15.0% and a superior dividend yield of 4.21%, supported by a lower price-to-book ratio of 1.42 signaling valuation strength. However, its return on equity (8.77%) and return on invested capital (4.52%) are weak, and liquidity ratios also remain below ideal levels. Dividend payments are maintained amid cautious balance sheet metrics.
Which one has the best ratios?
Both companies face challenges with liquidity and capital efficiency, reflected in unfavorable asset turnover and low current ratios. Evergy’s stronger net margin and dividend yield contrast with DTE’s better return on equity and interest coverage. Overall, neither company shows a decisively superior ratio profile, both rated slightly unfavorable but with differing strengths.
Strategic Positioning
This section compares the strategic positioning of DTE and Evergy, focusing on market position, key segments, and exposure to technological disruption:
DTE
- Leading utility in southeastern Michigan with lower beta, facing moderate competitive pressure.
- Diversified segments: Electric, Gas, Energy Trading, and Industrial Projects drive revenues.
- Generates electricity via fossil fuels, nuclear, renewables, and has active energy trading.
Evergy
- Operates in Kansas and Missouri with a smaller market cap and moderate competitive pressure.
- Primarily an electric utility with revenues concentrated in the Electric Utility segment.
- Mix of coal, natural gas, renewables; no mention of energy trading activities.
DTE vs Evergy Positioning
DTE’s diversified business model includes electric, gas, and energy trading segments, providing multiple revenue streams. Evergy’s focus is more concentrated on electric utility services. DTE’s broader segment base may offer operational flexibility, while Evergy’s simpler structure could imply focused management.
Which has the best competitive advantage?
Both companies exhibit a slightly unfavorable moat status with value destruction despite growing profitability. DTE shows a smaller negative ROIC vs WACC gap and stronger ROIC growth than Evergy, indicating a marginally better competitive position.
Stock Comparison
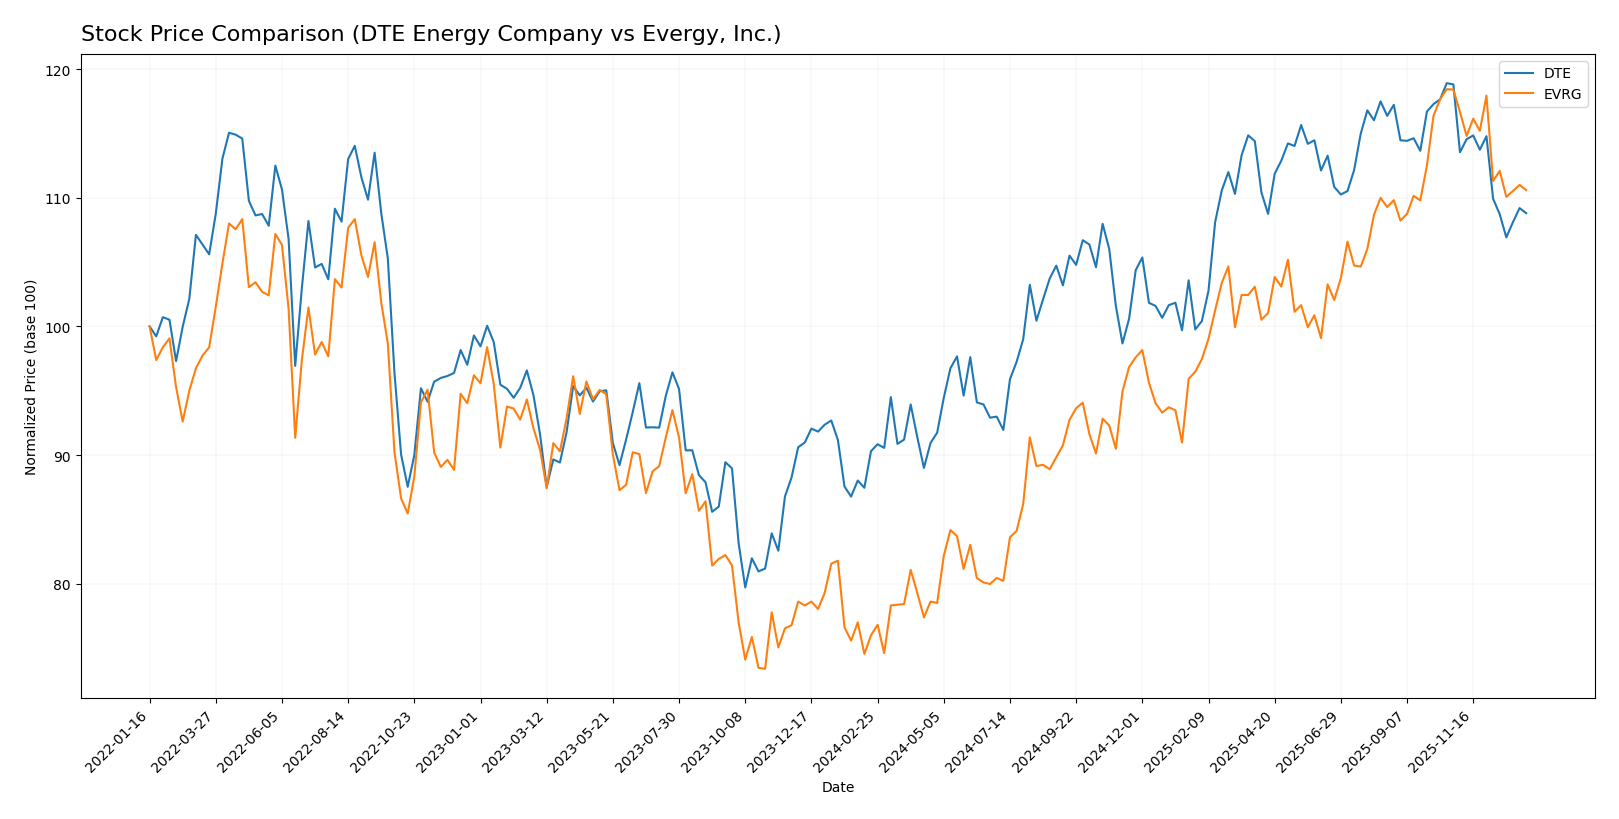
The stock price movements of DTE Energy Company and Evergy, Inc. over the past 12 months reveal significant bullish trends with decelerating momentum, followed by recent downward corrections in trading dynamics.
Trend Analysis
DTE Energy Company’s stock exhibited a 20.49% increase over the past year, marking a bullish trend with deceleration. The price ranged between 106.25 and 141.95, with recent months showing an 8.42% decline.
Evergy, Inc. saw a 45.55% price increase over the same period, also bullish with deceleration. The stock fluctuated between 49.12 and 77.98, recently dropping 6.59% in price, reflecting a mild downward trend.
Comparatively, Evergy, Inc. delivered the highest market performance with a stronger overall price increase than DTE Energy Company during the last 12 months.
Target Prices
Analysts present a clear target price consensus for both DTE Energy Company and Evergy, Inc.
| Company | Target High | Target Low | Consensus |
|---|---|---|---|
| DTE Energy Company | 157 | 138 | 148.29 |
| Evergy, Inc. | 93 | 76 | 82.67 |
The consensus target prices suggest upside potential for both stocks compared to current prices: DTE trades at $129.89 versus a consensus of $148.29, and Evergy trades at $72.82 with a consensus of $82.67. This indicates moderate analyst optimism for future price appreciation.
Analyst Opinions Comparison
This section compares analysts’ ratings and scores for DTE Energy Company and Evergy, Inc.:
Rating Comparison
DTE Rating
- Rating: C, considered Very Favorable overall by analysts.
- Discounted Cash Flow Score: 1, indicating a Very Unfavorable valuation outlook.
- ROE Score: 3, a Moderate indicator of efficient profit generation.
- ROA Score: 2, showing Moderate asset utilization effectiveness.
- Debt To Equity Score: 1, indicating Very Unfavorable financial risk profile.
- Overall Score: 2, a Moderate summary of financial standing.
EVRG Rating
- Rating: B-, also rated Very Favorable overall by analysts.
- Discounted Cash Flow Score: 1, also Very Unfavorable for valuation.
- ROE Score: 3, equally Moderate and efficient in generating profit.
- ROA Score: 3, Moderate but stronger asset utilization than DTE.
- Debt To Equity Score: 2, Moderate level of financial risk compared to DTE.
- Overall Score: 2, also Moderate in overall financial assessment.
Which one is the best rated?
Based strictly on the given data, Evergy holds a slightly better rating at B- compared to DTE’s C. Evergy’s stronger ROA and better debt-to-equity score contribute to this marginal advantage, though both share the same overall score.
Scores Comparison
The scores comparison between DTE Energy Company and Evergy, Inc. is as follows:
DTE Scores
- Altman Z-Score: 1.03, indicating financial distress zone risk.
- Piotroski Score: 7, classified as strong financial health.
EVRG Scores
- Altman Z-Score: 0.82, also indicating financial distress zone risk.
- Piotroski Score: 5, classified as average financial health.
Which company has the best scores?
DTE has a higher Piotroski Score of 7 compared to Evergy’s 5, indicating stronger financial health. Both have Altman Z-Scores in the distress zone, with Evergy’s score slightly lower.
Grades Comparison
Here is a detailed comparison of the latest grades assigned to DTE Energy Company and Evergy, Inc.:
DTE Energy Company Grades
The following table summarizes recent grades and actions from reputable grading companies for DTE Energy Company:
| Grading Company | Action | New Grade | Date |
|---|---|---|---|
| BMO Capital | Maintain | Market Perform | 2025-12-24 |
| UBS | Maintain | Buy | 2025-12-17 |
| JP Morgan | Maintain | Neutral | 2025-12-11 |
| Jefferies | Upgrade | Buy | 2025-12-11 |
| B of A Securities | Maintain | Buy | 2025-11-05 |
| Scotiabank | Maintain | Sector Perform | 2025-10-31 |
| Morgan Stanley | Maintain | Overweight | 2025-10-22 |
| Barclays | Maintain | Equal Weight | 2025-10-14 |
| UBS | Maintain | Buy | 2025-10-10 |
| Scotiabank | Downgrade | Sector Perform | 2025-10-03 |
Overall, DTE’s grades show a stable to slightly positive trend, with multiple buy ratings and some neutral or sector perform grades suggesting moderate confidence among analysts.
Evergy, Inc. Grades
Below is a summary of recent grades and actions from recognized grading companies for Evergy, Inc.:
| Grading Company | Action | New Grade | Date |
|---|---|---|---|
| Mizuho | Downgrade | Neutral | 2025-12-18 |
| UBS | Maintain | Buy | 2025-12-17 |
| Citigroup | Maintain | Buy | 2025-11-10 |
| Jefferies | Maintain | Buy | 2025-10-09 |
| Mizuho | Maintain | Outperform | 2025-08-08 |
| Mizuho | Maintain | Outperform | 2025-07-18 |
| Barclays | Maintain | Overweight | 2025-05-30 |
| Citigroup | Maintain | Buy | 2025-05-16 |
| UBS | Upgrade | Buy | 2025-04-28 |
| Barclays | Maintain | Overweight | 2025-04-22 |
Evergy’s grades mostly indicate a buy or outperform consensus, with one recent downgrade to neutral by Mizuho but several buy and outperform ratings maintained.
Which company has the best grades?
Evergy, Inc. has received a stronger consensus with more buy and outperform ratings, while DTE Energy Company has a more mixed profile centered on hold and buy grades. This suggests Evergy may be viewed as having better growth or value potential by analysts, which could influence investor sentiment accordingly.
Strengths and Weaknesses
Below is a comparative table highlighting key strengths and weaknesses of DTE Energy Company and Evergy, Inc. based on their recent financial and operational data.
| Criterion | DTE Energy Company | Evergy, Inc. |
|---|---|---|
| Diversification | Strong diversification across Electric (5.82B), Gas (1.75B), Energy Trading (4.61B), and DTE Vantage (0.81B) segments | Primarily focused on Electric Utility segment (2.71B), less diversified |
| Profitability | Moderate net margin at 11.27%, ROE neutral at 12%, but ROIC unfavorable at 4.65% | Higher net margin at 15%, but ROE and ROIC are unfavorable (8.77% and 4.52%) |
| Innovation | Moderate innovation indicated by DTE Vantage segment contributing ~810M revenue | Limited innovation focus, mainly traditional electric utility operations |
| Global presence | Mainly US-focused with regional operations, no significant global footprint | Similarly US regional focus without global diversification |
| Market Share | Larger revenue base with diversified segments suggests stronger market position | Smaller revenue base, concentrated in electric utilities, indicating narrower market share |
Key takeaways: Both companies show slightly unfavorable economic moats, shedding value but improving profitability. DTE benefits from greater diversification and innovation, while Evergy posts higher net margins but remains less diversified. Careful risk management is advisable given their financial challenges.
Risk Analysis
Below is a comparative overview of key risks faced by DTE Energy Company and Evergy, Inc. as of 2024.
| Metric | DTE Energy Company | Evergy, Inc. |
|---|---|---|
| Market Risk | Low beta (0.48), limited volatility | Moderate beta (0.65), slightly higher volatility |
| Debt level | High debt-to-equity (1.99), unfavorable | Moderate debt-to-equity (1.41), unfavorable but better than DTE |
| Regulatory Risk | High, due to complex utility regulations in Michigan | High, regulated utility in Kansas and Missouri |
| Operational Risk | Moderate; asset turnover low, reliance on fossil fuels and nuclear | Moderate; low asset turnover, diverse energy sources |
| Environmental Risk | Medium; exposure to fossil fuels and nuclear plants | Medium; coal and natural gas dependence, renewable efforts ongoing |
| Geopolitical Risk | Low; primarily US regional exposure | Low; primarily US regional exposure |
The most impactful risks for both companies stem from their high leverage and regulatory environment inherent in the utility sector. DTE’s higher debt level and lower liquidity ratios increase financial risk, while Evergy shows somewhat better balance sheet metrics but still faces similar operational and environmental challenges. Both firms operate in regulated markets with evolving environmental policies, which can significantly affect profitability.
Which Stock to Choose?
DTE Energy Company shows a mixed income evolution with a 9.05% revenue growth overall but a slight recent decline. Its financial ratios reveal a slightly unfavorable profile with 21% favorable and 43% unfavorable ratios; profitability is moderate with a 12% ROE, yet it carries high debt levels and an overall “C” rating that is very favorable.
Evergy, Inc. demonstrates stronger income growth, with 18.53% revenue and 41.27% net income growth over the period. Its financial ratios also appear slightly unfavorable, with 29% favorable and 50% unfavorable ratios; profitability is decent but lower ROE at 8.77%, moderate debt, and a “B-” rating that is very favorable.
For investors prioritizing growth and stronger income trends, Evergy may appear more attractive given its favorable income statement and rating. Conversely, those focused on a balanced approach with moderate profitability and cautious debt levels might find DTE’s profile more aligned, though both companies show slightly unfavorable ratio evaluations and value destruction signs in their moat analyses.
Disclaimer: Investment carries a risk of loss of initial capital. The past performance is not a reliable indicator of future results. Be sure to understand risks before making an investment decision.
Go Further
I encourage you to read the complete analyses of DTE Energy Company and Evergy, Inc. to enhance your investment decisions: