Entergy Corporation and DTE Energy Company are two prominent players in the regulated electric utility sector in the United States. Both companies generate and distribute electricity, leveraging diverse energy sources including nuclear and renewables, while serving millions of customers in their respective regions. Their focus on innovation and sustainable energy solutions makes this a compelling comparison. In this article, I will help you decide which company presents the most attractive investment opportunity today.
Table of contents
Companies Overview
I will begin the comparison between Entergy Corporation and DTE Energy Company by providing an overview of these two companies and their main differences.
Entergy Corporation Overview
Entergy Corporation operates in the regulated electric industry, producing and distributing electricity across Arkansas, Louisiana, Mississippi, and Texas. The company manages both utility and wholesale commodity segments, with a diverse energy mix including gas, nuclear, coal, hydro, and solar power. Founded in 1913 and headquartered in New Orleans, Entergy serves about 3 million utility customers and owns power plants with roughly 26,000 MW capacity.
DTE Energy Company Overview
DTE Energy Company is a utility firm based in Detroit, Michigan, serving southeastern Michigan with electricity and natural gas. It operates electric generation from fossil fuels, nuclear, hydro, and renewables, alongside a significant natural gas distribution network. Established in 1903, DTE supplies around 2.3 million electric and 1.3 million gas customers, and its operations include power, industrial projects, and energy trading segments.
Key similarities and differences
Both Entergy and DTE operate in the regulated electric industry and provide electricity and natural gas to millions of customers in defined U.S. regions. They generate power using diverse sources, including nuclear and renewables. Entergy has a larger total electric generation capacity and customer base, while DTE maintains a more extensive natural gas network and industrial service offerings. Employee count and market capitalization also differ, reflecting their scale and operational focus.
Income Statement Comparison
The following table compares key income statement metrics for Entergy Corporation and DTE Energy Company for the fiscal year 2024, providing a clear side-by-side financial overview.
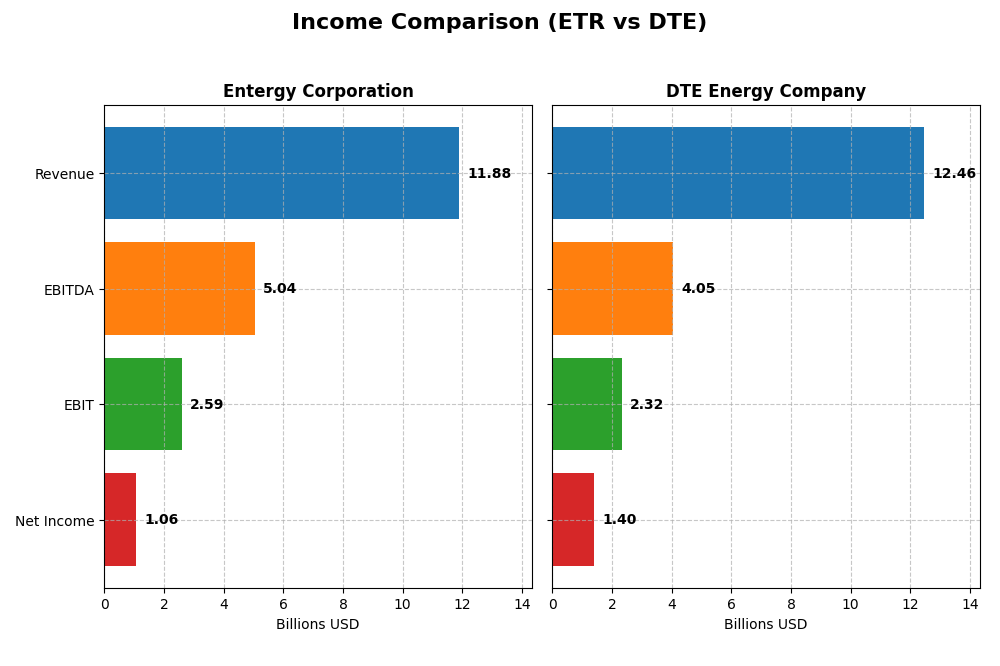
| Metric | Entergy Corporation | DTE Energy Company |
|---|---|---|
| Market Cap | 41.8B | 27.0B |
| Revenue | 11.9B | 12.5B |
| EBITDA | 5.04B | 4.05B |
| EBIT | 2.59B | 2.32B |
| Net Income | 1.06B | 1.40B |
| EPS | 2.47 | 6.78 |
| Fiscal Year | 2024 | 2024 |
Income Statement Interpretations
Entergy Corporation
Entergy’s revenue showed a favorable overall growth of 17.46% from 2020 to 2024, yet it experienced a 2.2% decline in the latest year. Net income declined by 24.56% over the period, with a significant 54.07% drop in net margin in 2024. Margins remain generally strong, with a 48.3% gross margin and 21.83% EBIT margin, but recent net margin contraction signals some operational pressures.
DTE Energy Company
DTE’s revenue grew by 9.05% over five years but fell 2.26% in 2024. Net income grew slightly by 2.41% overall, and net margin improved marginally in the latest year by 2.6%. The company maintains a solid 34.82% gross margin and 18.63% EBIT margin. Despite modest margin deterioration over the entire period, the latest year shows relative stability in profitability metrics.
Which one has the stronger fundamentals?
Both companies face revenue declines in 2024, but Entergy displays stronger gross and EBIT margins, albeit with sharper net income and margin contraction. DTE shows steadier net income growth and margin stability in the latest year, though at lower margin levels. Overall, Entergy’s higher margins contrast with its recent earnings volatility, while DTE offers more consistent but moderate improvements in profitability.
Financial Ratios Comparison
This table presents the latest available financial ratios for Entergy Corporation and DTE Energy Company for fiscal year 2024, enabling straightforward comparison of key performance and financial health metrics.
| Ratios | Entergy Corporation (ETR) | DTE Energy Company (DTE) |
|---|---|---|
| ROE | 7.02% | 12.00% |
| ROIC | 3.20% | 4.65% |
| P/E | 30.56 | 17.80 |
| P/B | 2.14 | 2.14 |
| Current Ratio | 0.72 | 0.71 |
| Quick Ratio | 0.43 | 0.46 |
| D/E (Debt-to-Equity) | 1.91 | 1.99 |
| Debt-to-Assets | 44.6% | 47.6% |
| Interest Coverage | 2.30 | 2.20 |
| Asset Turnover | 0.18 | 0.26 |
| Fixed Asset Turnover | 0.25 | 0.40 |
| Payout Ratio | 94.2% | 57.7% |
| Dividend Yield | 3.08% | 3.24% |
Interpretation of the Ratios
Entergy Corporation
Entergy shows several unfavorable ratios including return on equity at 7.02% and return on invested capital at 3.2%, both below expectations. Its current and quick ratios are weak, indicating liquidity concerns. The dividend yield is favorable at 3.08%, suggesting consistent shareholder returns, but coverage by free cash flow is negative, indicating potential sustainability risks.
DTE Energy Company
DTE has a stronger net margin of 11.27% and a neutral return on equity of 12.0%, reflecting better profitability. However, return on invested capital is still unfavorable at 4.65%. Liquidity ratios are weak like Entergy’s, and debt levels remain high. The dividend yield is favorable at 3.24%, supported by stable shareholder returns but with some caution on cash flow coverage.
Which one has the best ratios?
DTE Energy generally presents more favorable profitability and valuation metrics than Entergy, with fewer unfavorable ratios and a better net margin. However, both companies face similar liquidity and leverage challenges, and neither exhibits overwhelmingly strong financial health. Overall, DTE’s ratios are slightly more favorable but still carry risks.
Strategic Positioning
This section compares the strategic positioning of Entergy Corporation and DTE Energy Company, focusing on market position, key segments, and exposure to technological disruption:
Entergy Corporation
- Leading regulated electric utility in four states with 3M customers; faces competition typical of regulated markets.
- Diverse revenue streams from Utility and Wholesale Commodities segments, including nuclear, gas, coal, hydro, and solar power sources.
- Generates power from nuclear, gas, coal, hydro, and solar; exposure to disruption mitigated by regulated utility framework.
DTE Energy Company
- Regional utility in southeastern Michigan serving 2.3M electric and 1.3M gas customers; operates in a competitive regulated environment.
- Operations divided into Electric, Gas, DTE Vantage renewables, Energy Trading, and Industrial Projects segments.
- Mix of fossil fuel, nuclear, hydroelectric, wind, and renewable assets; energy trading and industrial services add complexity and exposure.
Entergy Corporation vs DTE Energy Company Positioning
Entergy demonstrates a diversified generation portfolio with wholesale commodities and extensive utility operations across multiple states, while DTE has a more concentrated regional presence with significant energy trading and industrial segments. Entergy’s scale contrasts with DTE’s diversified business model within a single state.
Which has the best competitive advantage?
Both companies are shedding value relative to their cost of capital; however, DTE shows a positive ROIC trend, suggesting improving profitability versus Entergy’s declining returns, indicating a slightly better competitive advantage for DTE.
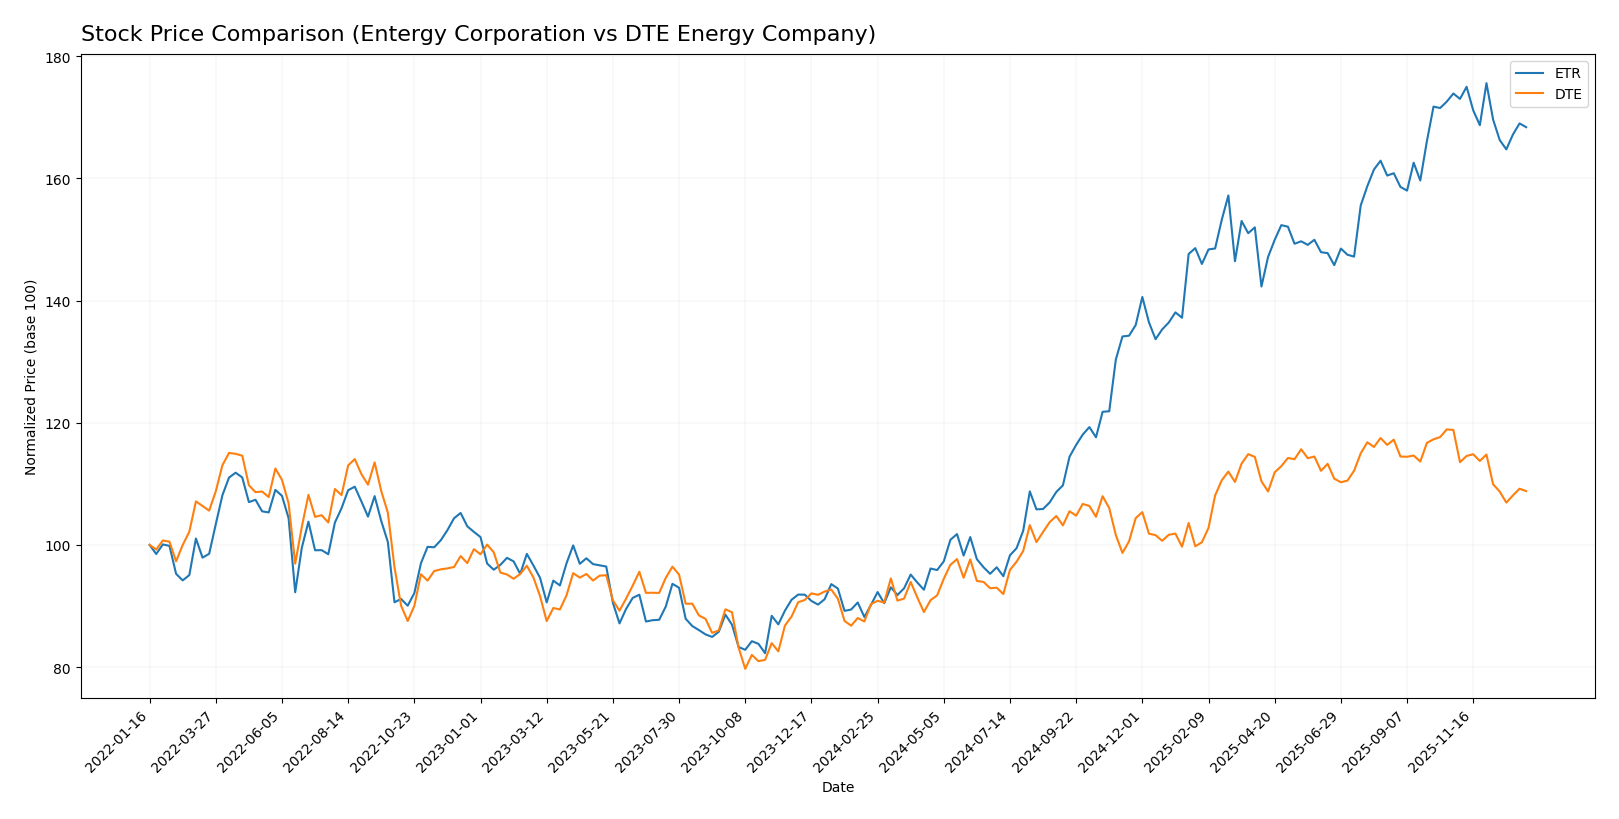
Stock Comparison
The past year has seen significant price movements and shifting trading dynamics, with Entergy Corporation showing a strong overall gain despite recent decline, while DTE Energy Company experienced moderate growth followed by a sharper recent downturn.
Trend Analysis
Entergy Corporation’s stock displayed a bullish trend over the past 12 months with an 86.74% increase, although this growth decelerated. The recent trend shows a slight bearish movement with a -3.17% price change and low volatility.
DTE Energy Company’s stock also trended bullish over the last year, rising 20.49% with decelerating momentum. Recently, it faced a sharper bearish decline of -8.42% accompanied by higher volatility compared to Entergy.
Comparing the two, Entergy Corporation outperformed DTE Energy Company in overall market performance during the 12-month period, despite both showing recent bearish corrections.
Target Prices
Analysts present a clear target price consensus for Entergy Corporation and DTE Energy Company.
| Company | Target High | Target Low | Consensus |
|---|---|---|---|
| Entergy Corporation | 115 | 91 | 103.17 |
| DTE Energy Company | 157 | 138 | 148.29 |
The consensus target prices for both Entergy and DTE Energy exceed current market prices, indicating positive analyst expectations and potential upside for investors. Entergy’s stock trades near 93.52 USD, while DTE stands at 129.89 USD, both below their average target prices.
Analyst Opinions Comparison
This section compares analysts’ ratings and grades for Entergy Corporation and DTE Energy Company:
Rating Comparison
Entergy Corporation Rating
- Rating: B-, considered very favorable overall.
- Discounted Cash Flow Score: 1, rated very unfavorable.
- ROE Score: 4, indicating favorable efficiency in equity use.
- ROA Score: 3, showing moderate asset utilization.
- Debt To Equity Score: 2, moderate financial risk.
- Overall Score: 2, moderate financial standing.
DTE Energy Company Rating
- Rating: C, also considered very favorable overall.
- Discounted Cash Flow Score: 1, rated very unfavorable.
- ROE Score: 3, moderate efficiency in equity use.
- ROA Score: 2, showing moderate asset utilization.
- Debt To Equity Score: 1, indicating very unfavorable risk.
- Overall Score: 2, moderate financial standing.
Which one is the best rated?
Based on the provided data, Entergy Corporation has a higher ROE score and a better debt-to-equity score than DTE Energy, while both share the same overall and discounted cash flow scores. Entergy is slightly better rated in key financial metrics.
Scores Comparison
Here is a comparison of the financial scores of Entergy Corporation (ETR) and DTE Energy Company (DTE):
ETR Scores
- Altman Z-Score: 1.04, indicating distress zone risk.
- Piotroski Score: 4, reflecting average financial health.
DTE Scores
- Altman Z-Score: 1.03, indicating distress zone risk.
- Piotroski Score: 7, reflecting strong financial health.
Which company has the best scores?
Both ETR and DTE are in the Altman Z-Score distress zone, signaling high bankruptcy risk. However, DTE’s Piotroski Score of 7 is stronger than ETR’s 4, indicating better overall financial health for DTE.
Grades Comparison
Here is a comparison of the recent grades issued by recognized grading companies for Entergy Corporation and DTE Energy Company:
Entergy Corporation Grades
The following table summarizes recent grades from major research firms for Entergy Corporation:
| Grading Company | Action | New Grade | Date |
|---|---|---|---|
| Argus Research | Maintain | Buy | 2026-01-06 |
| UBS | Maintain | Buy | 2025-12-17 |
| Keybanc | Maintain | Overweight | 2025-12-12 |
| JP Morgan | Maintain | Overweight | 2025-12-11 |
| Citigroup | Maintain | Neutral | 2025-11-18 |
| Evercore ISI Group | Maintain | In Line | 2025-10-30 |
| Mizuho | Maintain | Outperform | 2025-10-27 |
| Morgan Stanley | Maintain | Equal Weight | 2025-10-22 |
| B of A Securities | Maintain | Neutral | 2025-10-16 |
| Keybanc | Maintain | Overweight | 2025-10-15 |
Most recent grades for Entergy Corporation tend to be positive with multiple “Buy” and “Overweight” ratings, indicating a broadly favorable outlook from analysts.
DTE Energy Company Grades
The following table displays recent grades from reputable grading firms for DTE Energy Company:
| Grading Company | Action | New Grade | Date |
|---|---|---|---|
| BMO Capital | Maintain | Market Perform | 2025-12-24 |
| UBS | Maintain | Buy | 2025-12-17 |
| JP Morgan | Maintain | Neutral | 2025-12-11 |
| Jefferies | Upgrade | Buy | 2025-12-11 |
| B of A Securities | Maintain | Buy | 2025-11-05 |
| Scotiabank | Maintain | Sector Perform | 2025-10-31 |
| Morgan Stanley | Maintain | Overweight | 2025-10-22 |
| Barclays | Maintain | Equal Weight | 2025-10-14 |
| UBS | Maintain | Buy | 2025-10-10 |
| Scotiabank | Downgrade | Sector Perform | 2025-10-03 |
Grades for DTE Energy Company show a mix of “Buy” and “Hold” related ratings, with some recent upgrades, reflecting a moderately positive but more cautious analyst sentiment.
Which company has the best grades?
Entergy Corporation has received stronger and more consistent positive grades, mostly “Buy” and “Overweight,” compared to DTE Energy’s more balanced mix leaning toward “Hold” and “Market Perform.” This suggests Entergy currently has a more favorable analyst consensus, potentially signaling better perceived growth or stability by the market.
Strengths and Weaknesses
Below is a comparative table highlighting the strengths and weaknesses of Entergy Corporation (ETR) and DTE Energy Company (DTE) based on the latest available data.
| Criterion | Entergy Corporation (ETR) | DTE Energy Company (DTE) |
|---|---|---|
| Diversification | Moderate: Revenue mainly from residential (4.5B) and industrial (3.2B) sectors; limited diversification outside regulated utilities | Higher: Diverse segments including Electric (5.8B), Gas (1.7B), Energy Trading (4.6B), and DTE Vantage (0.8B) |
| Profitability | Low: ROIC 3.2% below WACC 5.49%, net margin 8.9%, declining ROIC trend, value destroying | Moderate: ROIC 4.65% below WACC 5.08%, net margin 11.3%, increasing ROIC trend, slight value destruction |
| Innovation | Limited: Focused on traditional utility services, less visible innovation initiatives | Moderate: Presence of DTE Vantage (renewables and innovation) contributes to growth potential |
| Global presence | Primarily US-regulated utility operations, limited international exposure | Primarily US-based, but broader energy trading activities add complexity |
| Market Share | Strong regional utility market share in the US South | Strong regional presence in Midwest US with expanding energy trading footprint |
Key takeaways: Entergy shows weaker profitability and a shrinking economic moat with concentration in regulated utility segments, while DTE demonstrates improving profitability and more diversified energy operations, including innovative energy trading and renewables. Both face challenges but DTE’s growth trajectory and diversification provide a slightly stronger investment profile.
Risk Analysis
Below is a summary table of key risks for Entergy Corporation (ETR) and DTE Energy Company (DTE) based on their latest available data for 2024:
| Metric | Entergy Corporation (ETR) | DTE Energy Company (DTE) |
|---|---|---|
| Market Risk | Beta 0.65 (moderate volatility) | Beta 0.48 (lower volatility) |
| Debt Level | Debt/Equity 1.91 (high leverage) | Debt/Equity 1.99 (high leverage) |
| Regulatory Risk | High (regulated electric sector) | High (regulated electric sector) |
| Operational Risk | Nuclear and fossil fuel plants | Fossil fuel, nuclear, renewables |
| Environmental Risk | Exposure to coal & nuclear assets | Transitioning to renewables |
| Geopolitical Risk | US regional focus, moderate | US regional focus, moderate |
Entergy faces significant operational and environmental risks due to its heavy reliance on nuclear and coal generation, alongside high leverage and moderate market volatility. DTE shows slightly lower market risk and a stronger shift toward renewables but similarly faces high debt and regulatory challenges. Both are in distress zones per Altman Z-scores, signaling financial vulnerability.
Which Stock to Choose?
Entergy Corporation (ETR) shows mixed income evolution with a 17.5% revenue growth over five years but declining net income and margins. Its financial ratios reveal predominantly unfavorable metrics, including a weak current ratio and high debt levels. Profitability is low, and the company’s rating is very favorable despite a moderate overall score. ETR’s debt and value destruction are signaled by a very unfavorable moat evaluation and distress-zone Altman Z-score.
DTE Energy Company (DTE) exhibits stable income growth with a 9.1% revenue increase over five years and mostly favorable income statement margins. Its financial ratios are slightly more balanced, with a slightly unfavorable global ratio opinion and strong Piotroski score. Though DTE also shows value destruction, its growing ROIC and slightly unfavorable moat status indicate improving profitability. The company holds a very favorable rating but with some moderate score components.
For investors focused on growth and potential recovery, ETR might appear more appealing given its higher revenue growth despite profitability challenges. Conversely, those prioritizing financial stability and improving efficiency could find DTE’s steady income evolution and strengthening ROIC more aligned with their profile. Each stock’s risk factors and financial health suggest a careful and personalized assessment of investment suitability.
Disclaimer: Investment carries a risk of loss of initial capital. The past performance is not a reliable indicator of future results. Be sure to understand risks before making an investment decision.
Go Further
I encourage you to read the complete analyses of Entergy Corporation and DTE Energy Company to enhance your investment decisions: