In the evolving utilities sector, DTE Energy Company and Edison International stand out as key players shaping the future of regulated electric power. Both companies operate extensive electric distribution networks and prioritize innovation in renewable energy integration. By comparing their market presence, operational scale, and growth strategies, we seek to clarify which offers a more compelling investment opportunity. Join me as we explore which stock deserves a spot in your portfolio.
Table of contents
Companies Overview
I will begin the comparison between DTE Energy Company and Edison International by providing an overview of these two companies and their main differences.
DTE Energy Company Overview
DTE Energy Company is a utility firm operating primarily in southeastern Michigan. Its Electric segment generates and distributes electricity to about 2.3M customers using fossil-fuel, hydroelectric, nuclear, and renewable sources. Additionally, its Gas segment serves 1.3M customers with natural gas distribution and storage. Founded in 1903 and headquartered in Detroit, DTE supports industrial customers with power, steam, and environmental services.
Edison International Overview
Edison International delivers electric power across Southern, Central, and Coastal California to roughly 15M customers spanning residential, commercial, and industrial sectors. The company manages an extensive transmission and distribution network, including around 70K circuit-miles of overhead and underground lines and 800 substations. Established in 1886 and based in Rosemead, California, Edison also offers energy solutions tailored to commercial and industrial users.
Key similarities and differences
Both companies operate in the regulated electric utility industry, focusing on power generation and distribution to residential and industrial clients within specific U.S. regions. While DTE combines electricity and natural gas services with energy trading and industrial projects, Edison concentrates on electricity delivery and energy solutions with a larger customer base and infrastructure footprint. Their geographic focus and service diversification distinguish their business models.
Income Statement Comparison
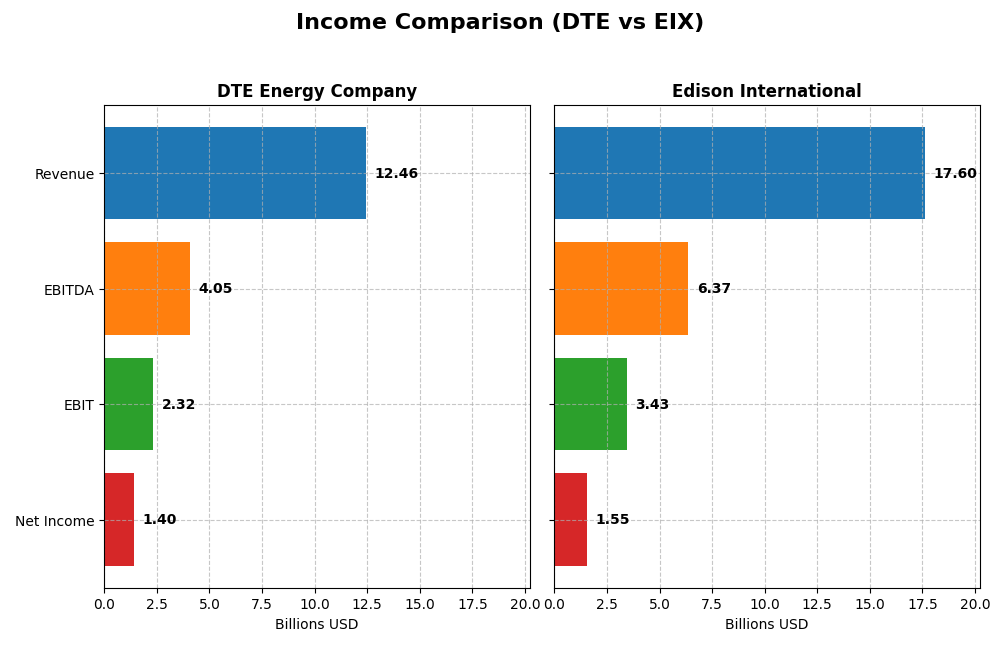
The table below presents a side-by-side comparison of key income statement metrics for DTE Energy Company and Edison International, based on their most recent fiscal year results.
| Metric | DTE Energy Company | Edison International |
|---|---|---|
| Market Cap | 27B | 23.5B |
| Revenue | 12.5B | 17.6B |
| EBITDA | 4.05B | 6.37B |
| EBIT | 2.32B | 3.43B |
| Net Income | 1.40B | 1.55B |
| EPS | 6.78 | 3.33 |
| Fiscal Year | 2024 | 2024 |
Income Statement Interpretations
DTE Energy Company
DTE’s revenue showed moderate growth of 9.05% over the 2020-2024 period but declined by 2.26% in the most recent year. Net income grew slightly overall by 2.41%, while net margin contracted by 6.09%. Despite a slight revenue dip last year, gross and net margins remained favorable, with net margin at 11.25%, reflecting stable profitability.
Edison International
Edison International exhibited strong revenue growth of 29.61% from 2020 to 2024 and a 7.72% increase last year. Net income surged by 77.5% over the period, with a 2.01% rise recently. Margins improved notably, with a gross margin of 41.01% and a net margin of 8.78%. Earnings per share also showed robust growth, highlighting solid operational performance.
Which one has the stronger fundamentals?
Edison International demonstrates stronger fundamentals with broadly favorable income statement metrics, including superior margin expansion and significant income growth. Conversely, DTE shows a mixed profile with some unfavorable trends, particularly in recent revenue and margin contractions. Edison’s consistent improvements in profitability and earnings growth position it more favorably on key income measures.
Financial Ratios Comparison
Below is a comparison of key financial ratios for DTE Energy Company and Edison International based on their most recent fiscal year data ending 2024.
| Ratios | DTE Energy Company | Edison International |
|---|---|---|
| ROE | 12.0% | 9.9% |
| ROIC | 4.65% | 3.61% |
| P/E | 17.8 | 19.9 |
| P/B | 2.14 | 1.98 |
| Current Ratio | 0.71 | 0.85 |
| Quick Ratio | 0.46 | 0.78 |
| D/E (Debt-to-Equity) | 1.99 | 2.43 |
| Debt-to-Assets | 47.6% | 44.1% |
| Interest Coverage | 2.20 | 1.57 |
| Asset Turnover | 0.26 | 0.21 |
| Fixed Asset Turnover | 0.40 | 0.29 |
| Payout Ratio | 57.7% | 83.2% |
| Dividend Yield | 3.24% | 4.17% |
Interpretation of the Ratios
DTE Energy Company
DTE Energy shows a mixed ratio profile with net margin (11.27%) favorable, but return on invested capital (4.65%) and liquidity ratios (current ratio 0.71, quick ratio 0.46) are weak. Debt levels are relatively high with a debt-to-equity of 1.99. The dividend yield of 3.24% is favorable, reflecting steady payouts supported by cash flow coverage, though caution is warranted due to some cash flow concerns.
Edison International
Edison International presents weaker profitability with a net margin of 8.78% and return on equity at 9.93% rated unfavorable. Liquidity ratios remain below 1, indicating potential short-term coverage issues, while leverage is high at a debt-to-equity of 2.43. The dividend yield is strong at 4.17%, suggesting a commitment to shareholder returns despite some financial pressures and coverage risks.
Which one has the best ratios?
DTE Energy’s ratios are slightly unfavorable but show more favorable profitability and dividend yield metrics compared to Edison International. EIX faces more unfavorable ratios overall, especially in profitability and interest coverage, leading to a less robust financial profile. Therefore, DTE Energy holds a marginally better ratio standing in this comparison.
Strategic Positioning
This section compares the strategic positioning of DTE Energy Company and Edison International, including market position, key segments, and exposure to technological disruption:
DTE Energy Company
- Positioned in regulated electric utilities with moderate market cap (~27B USD) and lower beta (0.48) indicating less volatility.
- Diverse segments: Electric (5.8B), Gas (1.7B), Energy Trading (4.6B), and industrial projects, serving 2.3M electric and 1.3M gas customers.
- Utilizes a mix of fossil-fuel, nuclear, hydroelectric, wind, and renewable sources; active in energy trading and industrial services.
Edison International
- Operates in regulated electric utilities with slightly smaller market cap (~23B USD) and higher beta (0.83) suggesting more market sensitivity.
- Key segments include Electric Utility (~10.6B) and Competitive Power Generation (~2.2B), serving 15M customers in California.
- Primarily focused on electricity generation and distribution with extensive transmission and distribution infrastructure; no explicit mention of renewables or trading.
DTE Energy Company vs Edison International Positioning
DTE shows a more diversified business model with multiple energy segments and trading activities, whereas Edison International concentrates on electric utility and competitive power generation. DTE’s broader portfolio may offer varied revenue streams, while Edison’s scale serves a large geographic market with focused services.
Which has the best competitive advantage?
Both companies are slightly unfavorable in MOAT evaluation, shedding value despite growing ROIC trends. DTE’s ROIC gap to WACC is smaller (-0.43) than Edison’s (-2.33), indicating DTE may manage invested capital more efficiently than Edison.
Stock Comparison
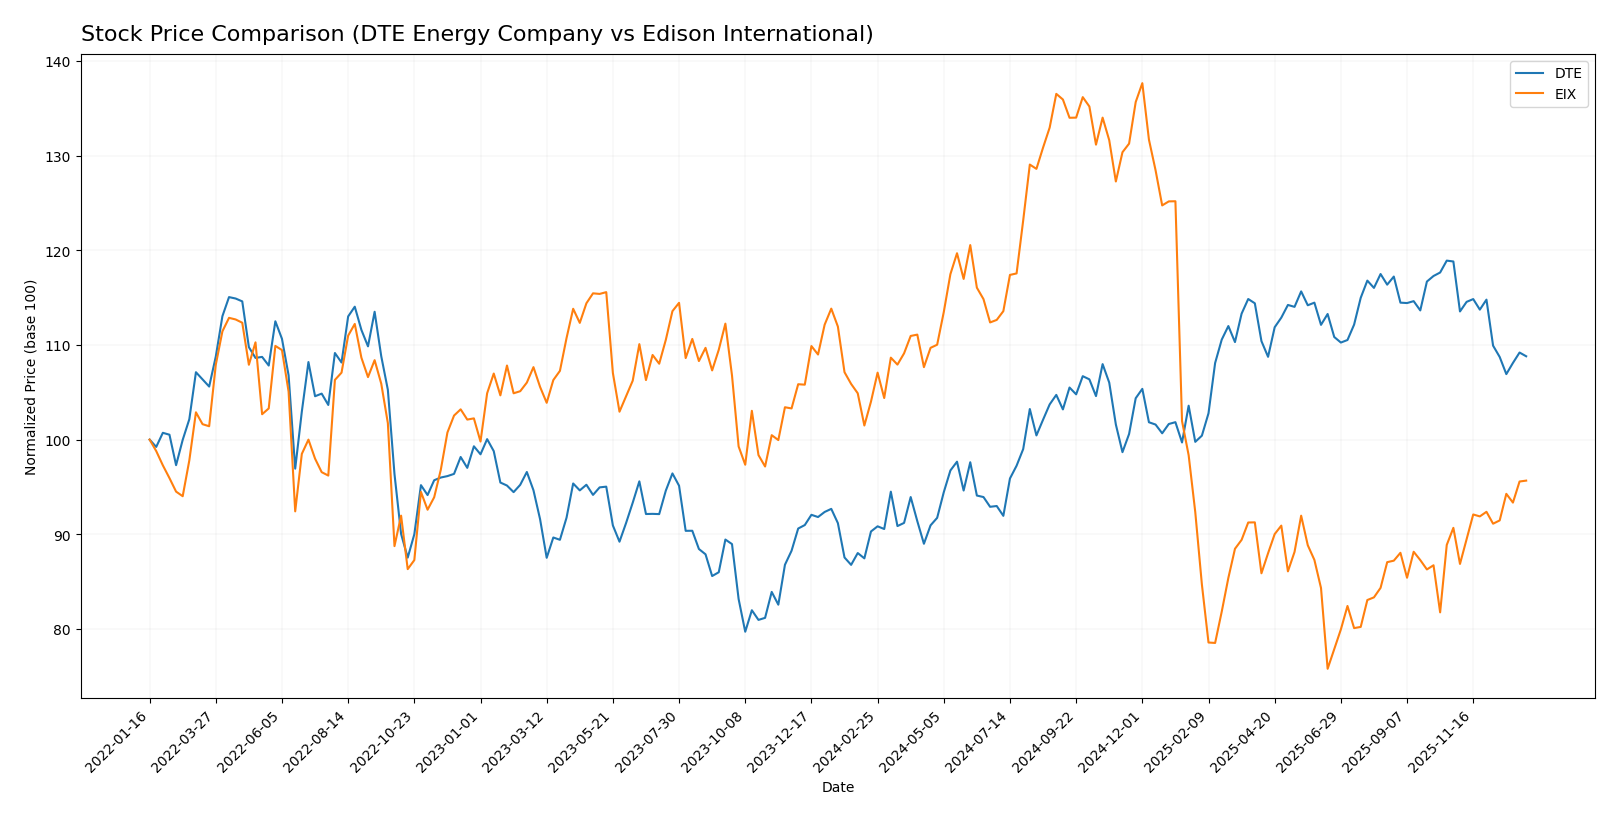
The stock price movements over the past 12 months reveal distinct dynamics: DTE Energy Company shows a strong overall bullish trend with some recent weakness, while Edison International exhibits an overall bearish trend with signs of recent recovery.
Trend Analysis
DTE Energy Company’s stock rose 20.49% over the past year, indicating a bullish trend with deceleration. The price peaked at 141.95 and bottomed at 106.25, with recent weakness showing a -8.42% decline.
Edison International’s stock fell 8.02% over the past year, marking a bearish trend with accelerating decline. The price ranged between 48.32 and 87.75, though recent months show a 5.5% upward correction.
Comparing both, DTE Energy delivered the highest market performance over the year, maintaining an overall bullish trend despite recent downward pressure, while Edison International trended lower overall.
Target Prices
Analysts provide a clear target price consensus for both DTE Energy Company and Edison International.
| Company | Target High | Target Low | Consensus |
|---|---|---|---|
| DTE Energy Company | 157 | 138 | 148.29 |
| Edison International | 70 | 56 | 62 |
For DTE Energy Company, the consensus target price of 148.29 suggests a potential upside from the current price of 129.89. Edison International’s consensus target of 62 also indicates moderate growth potential above its current price of 60.99.
Analyst Opinions Comparison
This section compares analysts’ ratings and grades for DTE Energy Company and Edison International:
Rating Comparison
DTE Rating
- Rating: C, considered very favorable overall by analysts.
- Discounted Cash Flow Score: 1, indicating a very unfavorable DCF.
- ROE Score: 3, moderate efficiency in generating profit from equity.
- ROA Score: 2, moderate asset utilization effectiveness.
- Debt To Equity Score: 1, very unfavorable financial risk profile.
- Overall Score: 2, moderate financial standing.
EIX Rating
- Rating: B+, also considered very favorable overall by analysts.
- Discounted Cash Flow Score: 1, indicating a very unfavorable DCF.
- ROE Score: 5, very favorable efficiency in generating profit from equity.
- ROA Score: 4, favorable asset utilization effectiveness.
- Debt To Equity Score: 1, very unfavorable financial risk profile.
- Overall Score: 3, moderate financial standing.
Which one is the best rated?
Based on the provided data, Edison International is better rated with a B+ rating and higher scores in ROE, ROA, and overall score compared to DTE Energy’s C rating and lower scores. Both share very unfavorable debt-to-equity and DCF scores.
Scores Comparison
Here is a comparison of the Altman Z-Score and Piotroski Score for both companies:
DTE Scores
- Altman Z-Score: 1.03, in the distress zone indicating high bankruptcy risk.
- Piotroski Score: 7, classified as strong financial health.
EIX Scores
- Altman Z-Score: 0.72, also in the distress zone indicating very high bankruptcy risk.
- Piotroski Score: 6, considered average financial health.
Which company has the best scores?
DTE shows a slightly better Altman Z-Score than EIX but both are in distress zones. DTE also has a stronger Piotroski Score, indicating better overall financial strength compared to EIX based solely on these scores.
Grades Comparison
Here is the detailed comparison of the recent grades assigned to DTE Energy Company and Edison International by recognized grading companies:
DTE Energy Company Grades
The table below summarizes the latest grades from reputable financial institutions for DTE Energy Company:
| Grading Company | Action | New Grade | Date |
|---|---|---|---|
| BMO Capital | Maintain | Market Perform | 2025-12-24 |
| UBS | Maintain | Buy | 2025-12-17 |
| JP Morgan | Maintain | Neutral | 2025-12-11 |
| Jefferies | Upgrade | Buy | 2025-12-11 |
| B of A Securities | Maintain | Buy | 2025-11-05 |
| Scotiabank | Maintain | Sector Perform | 2025-10-31 |
| Morgan Stanley | Maintain | Overweight | 2025-10-22 |
| Barclays | Maintain | Equal Weight | 2025-10-14 |
| UBS | Maintain | Buy | 2025-10-10 |
| Scotiabank | Downgrade | Sector Perform | 2025-10-03 |
Overall, grades for DTE Energy Company show a stable to positive trend with multiple buy ratings and only limited downgrades.
Edison International Grades
Below is the summary of recent grades from established grading firms for Edison International:
| Grading Company | Action | New Grade | Date |
|---|---|---|---|
| Morgan Stanley | Maintain | Underweight | 2025-12-17 |
| JP Morgan | Maintain | Neutral | 2025-12-12 |
| UBS | Maintain | Buy | 2025-12-02 |
| Ladenburg Thalmann | Maintain | Neutral | 2025-10-30 |
| Barclays | Maintain | Overweight | 2025-10-29 |
| Jefferies | Maintain | Hold | 2025-10-22 |
| Morgan Stanley | Maintain | Underweight | 2025-10-22 |
| Barclays | Maintain | Overweight | 2025-10-21 |
| Jefferies | Downgrade | Hold | 2025-10-02 |
| JP Morgan | Maintain | Neutral | 2025-09-25 |
Grades for Edison International largely indicate a mixed outlook, with several neutral and hold ratings, and some underweight positions.
Which company has the best grades?
DTE Energy Company has received generally stronger grades with multiple buy ratings and positive upgrades, whereas Edison International’s grades are more mixed with underweight and hold recommendations. This suggests DTE may be viewed more favorably by analysts, potentially impacting investor confidence and portfolio decisions.
Strengths and Weaknesses
The table below compares the key strengths and weaknesses of DTE Energy Company (DTE) and Edison International (EIX) based on their recent financial performance and strategic positions.
| Criterion | DTE Energy Company (DTE) | Edison International (EIX) |
|---|---|---|
| Diversification | Moderate: Revenue from Electric (5.8B), Gas (1.7B), Energy Trading (4.6B), and DTE Vantage (0.8B) | Limited: Mainly Electric Utility (10.6B) and Competitive Power Generation (2.2B) |
| Profitability | Net margin 11.27% (favorable), ROE 12% (neutral), ROIC 4.65% (unfavorable) | Net margin 8.78% (neutral), ROE 9.93% (unfavorable), ROIC 3.61% (unfavorable) |
| Innovation | Growing ROIC trend (+34%), indicating improving capital efficiency despite value shedding | Strong ROIC growth (+86%) but still shedding value; innovation impact unclear |
| Global presence | Primarily US-focused with no significant global footprint | Primarily US-focused, limited global presence |
| Market Share | Strong in regional energy markets with diversified segments | Dominant in regional electric utility market |
Key takeaways: Both DTE and Edison International show improving profitability trends but currently destroy value as ROIC remains below WACC. DTE benefits from more diversification, while Edison shows stronger ROIC growth but with overall weaker financial ratios. Investors should weigh improving trends against persistent efficiency challenges.
Risk Analysis
Below is a comparative table of key risks associated with DTE Energy Company and Edison International based on their latest 2024 data:
| Metric | DTE Energy Company | Edison International |
|---|---|---|
| Market Risk | Moderate (Beta 0.48) | Higher (Beta 0.83) |
| Debt level | High (Debt-to-Equity 1.99) | Very High (Debt-to-Equity 2.43) |
| Regulatory Risk | Moderate (US utilities sector) | Moderate (California utilities) |
| Operational Risk | Moderate (Aging assets, asset turnover 0.26) | Moderate to high (Asset turnover 0.21) |
| Environmental Risk | Elevated (Fossil fuels, renewables mix) | Elevated (California wildfire liabilities) |
| Geopolitical Risk | Low (Domestic US focus) | Low (Domestic US focus) |
The most significant risks for both companies stem from high debt levels and operational challenges linked to aging infrastructure and asset utilization inefficiencies. Edison International faces elevated environmental risk due to wildfire exposure in California, which can impact operations and regulatory costs. Both utilities operate in regulated markets, which somewhat contain market risk but expose them to policy shifts. Investors should monitor debt reduction efforts and environmental risk mitigation closely.
Which Stock to Choose?
DTE Energy Company shows a mixed income evolution with a slight revenue decline recently but overall growth across five years. Its financial ratios reveal a slightly unfavorable global picture, with good net margin but weak liquidity and asset turnover. Profitability is moderate, and debt levels are relatively high. The rating is very favorable overall, yet some key scores, such as discounted cash flow and debt-to-equity, remain unfavorable.
Edison International presents a more favorable income trajectory, with solid revenue and net income growth over the period. Its financial ratios are mostly unfavorable, notably in profitability and leverage metrics, despite a favorable dividend yield. Profitability trends upwards but remains below DTE’s level. The company’s rating is very favorable, supported by strong return on equity and assets, though debt risk is significant.
For investors, the choice could depend on risk tolerance and investment focus. Those prioritizing consistent income and dividend yield might find DTE’s profile more appealing despite some financial weaknesses. Conversely, growth-focused investors could consider Edison’s stronger income growth and improving profitability, though with higher financial risk. Both companies show value destruction in ROIC versus WACC but improving profitability, suggesting caution and selective timing.
Disclaimer: Investment carries a risk of loss of initial capital. The past performance is not a reliable indicator of future results. Be sure to understand risks before making an investment decision.
Go Further
I encourage you to read the complete analyses of DTE Energy Company and Edison International to enhance your investment decisions: