Navigating the utilities sector requires a sharp eye on companies that balance reliable energy delivery with innovation and sustainability. Duke Energy Corporation (DUK) and DTE Energy Company (DTE) are two major players in the regulated electric industry, both serving millions of customers with a mix of traditional and renewable energy sources. This comparison explores their market strategies and growth potential to help you decide which may be the more compelling investment opportunity today.
Table of contents
Companies Overview
I will begin the comparison between Duke Energy Corporation and DTE Energy Company by providing an overview of these two companies and their main differences.
Duke Energy Corporation Overview
Duke Energy Corporation operates as a major energy company in the US, serving approximately 8.2M customers across six states in the Southeast and Midwest. Its business spans electric utilities, gas utilities, and commercial renewables, with a generation capacity of around 50,259 MW. The company focuses on diverse energy sources, including coal, natural gas, nuclear, and renewables, and operates 23 wind, 178 solar, and 2 battery storage facilities.
DTE Energy Company Overview
DTE Energy Company provides utility operations in southeastern Michigan, serving about 2.3M electric and 1.3M gas customers. It generates electricity through fossil fuels, hydroelectric, nuclear, and renewable assets, and operates extensive gas distribution and transmission infrastructure. Additionally, DTE offers industrial products, power services, and energy trading, emphasizing integrated energy solutions within Michigan’s regional market.
Key similarities and differences
Both companies operate in the regulated electric utilities sector with significant gas operations, focusing on generation, distribution, and sales of electricity and natural gas. Duke Energy has a broader geographic footprint and larger scale with significant renewable assets, while DTE Energy is more regionally concentrated with diversified energy trading and industrial services. Their customer bases and infrastructure size reflect these operational scopes and strategic focuses.
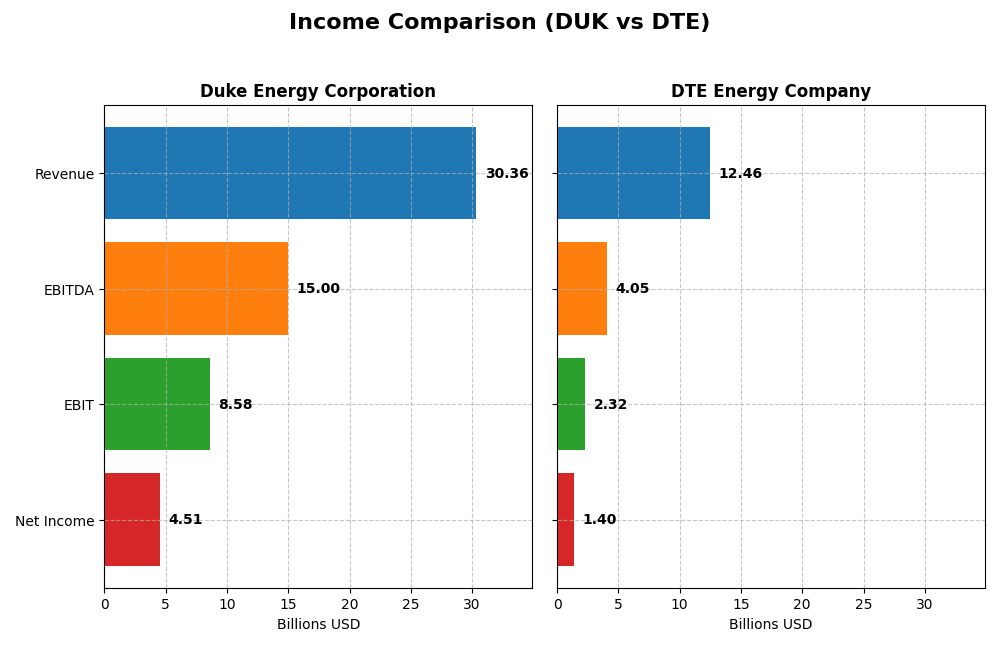
Income Statement Comparison
This table presents a side-by-side comparison of key income statement metrics for Duke Energy Corporation and DTE Energy Company based on their most recent fiscal year results.
| Metric | Duke Energy Corporation (DUK) | DTE Energy Company (DTE) |
|---|---|---|
| Market Cap | 90.8B | 27.0B |
| Revenue | 30.4B | 12.5B |
| EBITDA | 15.0B | 4.1B |
| EBIT | 8.6B | 2.3B |
| Net Income | 4.5B | 1.4B |
| EPS | 5.71 | 6.78 |
| Fiscal Year | 2024 | 2024 |
Income Statement Interpretations
Duke Energy Corporation
Duke Energy’s revenue rose steadily from $23.4B in 2020 to $30.4B in 2024, with net income surging from $1.38B to $4.51B. Gross and EBIT margins remained strong, around 50% and 28% respectively, reflecting operational efficiency. In 2024, growth slowed slightly to 4.5% in revenue but gross profit and EBIT margins improved, supporting a favorable earnings per share increase.
DTE Energy Company
DTE’s revenue showed modest growth from $11.4B in 2020 to $12.5B in 2024 but declined 2.3% year-over-year. Net income fluctuated near $1.4B recently, reflecting stable but limited margin expansion. Gross margin hovered around 35%, EBIT margin near 19%, with a slight net margin improvement in 2024 despite unfavorable revenue and EBIT growth, signaling mixed operational trends.
Which one has the stronger fundamentals?
Duke Energy exhibits stronger fundamentals with consistent revenue and significant net income growth, alongside favorable margin expansions and EPS gains over the period. Conversely, DTE shows weaker momentum, with declining revenue and net margin contraction overall, resulting in an unfavorable income statement evaluation. Duke’s higher margins and growth reinforce its more robust financial foundation.
Financial Ratios Comparison
The table below compares the key financial ratios for Duke Energy Corporation (DUK) and DTE Energy Company (DTE) based on their most recent fiscal year data (2024).
| Ratios | Duke Energy Corporation (DUK) | DTE Energy Company (DTE) |
|---|---|---|
| ROE | 8.997% | 12.001% |
| ROIC | 4.017% | 4.646% |
| P/E | 18.44 | 17.80 |
| P/B | 1.66 | 2.14 |
| Current Ratio | 0.67 | 0.71 |
| Quick Ratio | 0.44 | 0.46 |
| D/E (Debt-to-Equity) | 1.70 | 1.99 |
| Debt-to-Assets | 45.74% | 47.58% |
| Interest Coverage | 2.34 | 2.20 |
| Asset Turnover | 0.16 | 0.26 |
| Fixed Asset Turnover | 0.24 | 0.40 |
| Payout Ratio | 71.24% | 57.69% |
| Dividend Yield | 3.86% | 3.24% |
Interpretation of the Ratios
Duke Energy Corporation
Duke Energy displays mixed financial ratios with a favorable net margin of 14.86% and a dividend yield of 3.86%, reflecting decent profitability and shareholder returns. However, concerns arise from its low current ratio (0.67) and quick ratio (0.44), indicating liquidity challenges, alongside a high debt-to-equity ratio of 1.7. The company maintains dividends supported by free cash flow, but capital structure risks persist.
DTE Energy Company
DTE Energy shows a solid net margin of 11.27% and a respectable dividend yield of 3.24%, supporting steady shareholder returns. Its liquidity ratios (current ratio 0.71 and quick ratio 0.46) and debt-to-equity ratio of 1.99 raise some caution. While return on equity is neutral at 12%, the firm also faces pressure on asset turnover ratios, with dividends covered but free cash flow being negative.
Which one has the best ratios?
Both companies exhibit a slightly unfavorable overall ratio profile with 21.43% favorable metrics each. Duke Energy has slightly better profitability but weaker liquidity and leverage ratios compared to DTE Energy, which performs marginally better on return on equity and asset utilization. Neither stands out decisively, as both face similar challenges in liquidity and debt management.
Strategic Positioning
This section compares the strategic positioning of Duke Energy Corporation and DTE Energy Company, including market position, key segments, and exposure to technological disruption:
Duke Energy Corporation
- Large market cap of $90.8B with regional focus in Southeast and Midwest; faces regulated electric competition.
- Diverse segments including Electric Utilities, Gas Utilities, and Commercial Renewables driving revenues.
- Engaged in renewable energy projects (wind, solar, battery storage) across 22 states, adapting to energy transition.
DTE Energy Company
- Smaller market cap of $27B, focused on southeastern Michigan; also operates in regulated electric utilities.
- Segments include Electric, Gas, Energy Trading, and Power & Industrial Projects with diversified revenue streams.
- Includes renewable assets but also significant energy trading and industrial services, showing mixed exposure.
Duke Energy Corporation vs DTE Energy Company Positioning
Duke Energy has a broader geographic and segment diversification, leveraging renewables and infrastructure scale. DTE concentrates more on Michigan with a notable energy trading segment, offering varied but regionally concentrated operations and business mix.
Which has the best competitive advantage?
Both companies show growing ROIC trends but currently shed value relative to their cost of capital, indicating slight competitive disadvantages. Their economic moats are rated slightly unfavorable, reflecting challenges in sustaining excess returns despite improving profitability.
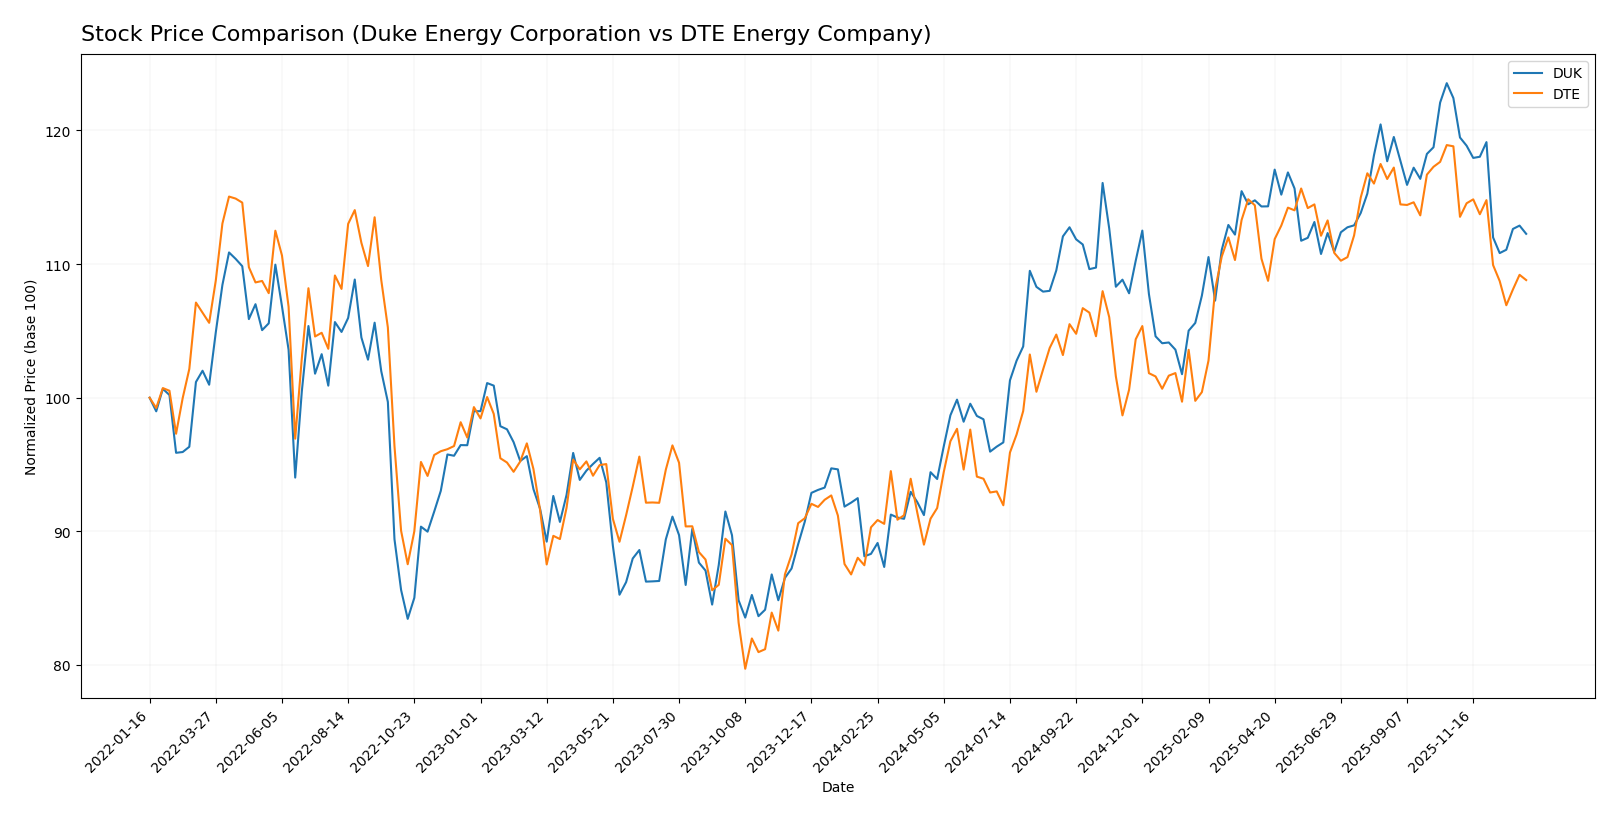
Stock Comparison
The stock prices of Duke Energy Corporation (DUK) and DTE Energy Company (DTE) have shown significant bullish trends over the past 12 months, with both experiencing deceleration and a recent downturn in trading dynamics.
Trend Analysis
Duke Energy Corporation’s stock gained 27.12% over the past year, reflecting a bullish trend with decelerating momentum. The price ranged from a low of 90.86 to a high of 128.53, with recent trading showing an 8.3% decline.
DTE Energy Company’s stock rose 20.49% during the same period, also bullish with decelerating acceleration. Prices fluctuated between 106.25 and 141.95, followed by a recent 8.42% drop in the last quarter.
Comparing both stocks, Duke Energy delivered the highest market performance with a 27.12% gain versus DTE’s 20.49%, despite both facing recent short-term declines.
Target Prices
The current analyst consensus presents optimistic target prices for both Duke Energy Corporation and DTE Energy Company.
| Company | Target High | Target Low | Consensus |
|---|---|---|---|
| Duke Energy Corporation | 150 | 126 | 135.91 |
| DTE Energy Company | 157 | 138 | 148.29 |
Analysts expect Duke Energy’s stock to appreciate from its current 116.8 USD to around 136 USD, while DTE Energy’s price is projected to rise from 129.89 USD to approximately 148 USD, indicating potential upside in both utilities.
Analyst Opinions Comparison
This section compares analysts’ ratings and financial scores for Duke Energy Corporation and DTE Energy Company:
Rating Comparison
DUK Rating
- Rating: C+ indicating a very favorable assessment.
- Discounted Cash Flow Score: 1, considered very unfavorable.
- ROE Score: 3, showing moderate efficiency in generating profit from equity.
- ROA Score: 3, reflecting moderate asset utilization effectiveness.
- Debt To Equity Score: 2, moderate financial risk level.
- Overall Score: 2, categorized as moderate overall financial standing.
DTE Rating
- Rating: C indicating a very favorable assessment.
- Discounted Cash Flow Score: 1, considered very unfavorable.
- ROE Score: 3, showing moderate efficiency in generating profit from equity.
- ROA Score: 2, reflecting moderate asset utilization but lower than DUK.
- Debt To Equity Score: 1, indicating a very unfavorable higher financial risk.
- Overall Score: 2, categorized as moderate overall financial standing.
Which one is the best rated?
Based strictly on the provided data, Duke Energy holds a slightly better rating (C+) compared to DTE’s C, with stronger scores in ROA and debt-to-equity, indicating relatively better asset use and financial stability.
Scores Comparison
Here is a comparison of the financial health scores for Duke Energy Corporation and DTE Energy Company:
Duke Energy Corporation Scores
- Altman Z-Score: 0.71, indicating financial distress zone
- Piotroski Score: 6, reflecting average financial strength
DTE Energy Company Scores
- Altman Z-Score: 1.03, also in financial distress zone
- Piotroski Score: 7, reflecting strong financial strength
Which company has the best scores?
Based solely on the provided data, DTE Energy Company has a slightly higher Altman Z-Score but both are in the distress zone. DTE also has a better Piotroski Score, indicating stronger financial health compared to Duke Energy.
Grades Comparison
Here is a comparison of the latest available grades from reputable grading companies for both Duke Energy Corporation and DTE Energy Company:
Duke Energy Corporation Grades
The following table summarizes recent grade updates from established financial institutions for Duke Energy:
| Grading Company | Action | New Grade | Date |
|---|---|---|---|
| UBS | Maintain | Neutral | 2025-12-17 |
| JP Morgan | Maintain | Neutral | 2025-12-11 |
| Mizuho | Maintain | Outperform | 2025-10-27 |
| Morgan Stanley | Maintain | Equal Weight | 2025-10-22 |
| Barclays | Maintain | Overweight | 2025-10-14 |
| UBS | Maintain | Neutral | 2025-10-10 |
| BMO Capital | Maintain | Outperform | 2025-10-10 |
| Scotiabank | Upgrade | Sector Outperform | 2025-10-03 |
| Jefferies | Downgrade | Hold | 2025-09-26 |
| Morgan Stanley | Maintain | Equal Weight | 2025-09-25 |
Overall, Duke Energy’s grades show a mixed but generally stable outlook, with several maintain actions and a slight recent upgrade by Scotiabank. The consensus rating remains “Hold.”
DTE Energy Company Grades
The table below details the most recent grades for DTE Energy from recognized financial analysts:
| Grading Company | Action | New Grade | Date |
|---|---|---|---|
| BMO Capital | Maintain | Market Perform | 2025-12-24 |
| UBS | Maintain | Buy | 2025-12-17 |
| JP Morgan | Maintain | Neutral | 2025-12-11 |
| Jefferies | Upgrade | Buy | 2025-12-11 |
| B of A Securities | Maintain | Buy | 2025-11-05 |
| Scotiabank | Maintain | Sector Perform | 2025-10-31 |
| Morgan Stanley | Maintain | Overweight | 2025-10-22 |
| Barclays | Maintain | Equal Weight | 2025-10-14 |
| UBS | Maintain | Buy | 2025-10-10 |
| Scotiabank | Downgrade | Sector Perform | 2025-10-03 |
DTE Energy exhibits a generally positive grading landscape with multiple Buy ratings and few downgrades. The consensus rating also stands at “Hold.”
Which company has the best grades?
Between Duke Energy and DTE Energy, DTE Energy has received comparatively stronger grades, including multiple Buy ratings and fewer downgrades. This may indicate a more favorable analyst outlook, potentially affecting investor sentiment and portfolio decisions.
Strengths and Weaknesses
Below is a comparative analysis of Duke Energy Corporation (DUK) and DTE Energy Company (DTE) highlighting their key strengths and weaknesses based on diversification, profitability, innovation, global presence, and market share.
| Criterion | Duke Energy Corporation (DUK) | DTE Energy Company (DTE) |
|---|---|---|
| Diversification | Strong focus on Electric Utilities (26.8B USD) and Gas Utilities (2.3B USD) with growing renewables segment | Diversified across Electric (5.8B USD), Gas (1.7B USD), Energy Trading (4.6B USD), and DTE Vantage (0.8B USD) |
| Profitability | Net margin of 14.9% (favorable), but ROIC at 4.0% below WACC; slightly unfavorable value creation | Net margin of 11.3% (favorable), ROIC at 4.7% also below WACC; slightly unfavorable value creation |
| Innovation | Moderate investment in Commercial Renewables (~0.5B USD); traditional utilities dominate | Innovation through Energy Trading and DTE Vantage, reflecting newer energy solutions and trading capabilities |
| Global presence | Primarily focused on U.S. regulated utilities; limited international exposure | Also focused on U.S. markets with emphasis on energy trading, less international presence |
| Market Share | Leading in electric utilities with consistent revenue growth | Smaller electric utility segment but strong in energy trading and gas infrastructure |
Key takeaways: Both DUK and DTE show strengths in their core utility businesses and maintain favorable net margins. However, both companies currently destroy value as ROIC remains below WACC despite improving profitability trends. DTE exhibits more diversification through energy trading and innovative segments, while Duke benefits from larger scale in electric utilities. Investors should weigh these factors carefully considering their risk tolerance and preference for traditional versus innovative energy exposure.
Risk Analysis
Below is a comparative table of key risks for Duke Energy Corporation (DUK) and DTE Energy Company (DTE) based on the most recent 2024 data and 2026 context:
| Metric | Duke Energy Corporation (DUK) | DTE Energy Company (DTE) |
|---|---|---|
| Market Risk | Moderate (Beta 0.49, stable sector) | Moderate (Beta 0.484, regulated utility) |
| Debt level | High (Debt/Equity 1.7, interest coverage 2.53) | High (Debt/Equity 1.99, interest coverage 2.44) |
| Regulatory Risk | Elevated (multi-state operations, coal/nuclear mix) | Elevated (Michigan-focused, fossil + renewables) |
| Operational Risk | Medium (diverse generation sources, aging infrastructure) | Medium (significant fossil fuel reliance, infrastructure maintenance) |
| Environmental Risk | Notable (coal and nuclear exposure, renewable investments) | Moderate (emphasis on renewables but still fossil fuel dependent) |
| Geopolitical Risk | Low (domestic US operations) | Low (domestic US operations) |
In synthesis, both companies face moderately elevated regulatory and debt risks, with Duke Energy showing slightly better interest coverage but still substantial leverage. Environmental risk remains significant due to fossil fuel and nuclear assets. Market and geopolitical risks are comparatively low. Recent financial distress indicators (Altman Z-scores in the distress zone) and moderate operational risks suggest cautious portfolio inclusion with strong risk management.
Which Stock to Choose?
Duke Energy Corporation (DUK) shows a favorable income evolution with 71.43% positive income statement metrics, including strong net margin growth of 152.1% over 2020-2024. Financial ratios are slightly unfavorable overall, with only 21.43% favorable, challenged by low liquidity and high debt levels. Profitability is moderate, with a 9.0% ROE and 4.0% ROIC below its WACC, indicating value destruction despite a growing ROIC trend. The company holds a very favorable C+ rating, though its Altman Z-Score places it in the distress zone, reflecting financial risk.
DTE Energy Company (DTE) presents an unfavorable income evolution, with 35.71% unfavorable and 28.57% favorable income statement indicators. Its financial ratios are slightly better balanced, with 21.43% favorable and 42.86% unfavorable, showing moderate profitability and liquidity concerns. DTE’s ROE is higher at 12.0%, but its ROIC also falls below WACC, signaling value destruction amid a rising ROIC trend. The firm carries a very favorable C rating, and a stronger Piotroski score with an Altman Z-Score still in the distress zone.
Investors focused on growth might find Duke Energy’s stronger income growth and improving profitability metrics more appealing, while those prioritizing relative financial strength and slightly better leverage ratios could view DTE as having a more balanced profile. Both companies show signs of value destruction but with growing ROIC, suggesting cautious consideration depending on individual risk tolerance and investment strategy.
Disclaimer: Investment carries a risk of loss of initial capital. The past performance is not a reliable indicator of future results. Be sure to understand risks before making an investment decision.
Go Further
I encourage you to read the complete analyses of Duke Energy Corporation and DTE Energy Company to enhance your investment decisions: