Dominion Energy, Inc. (D) and DTE Energy Company (DTE) are two prominent players in the regulated electric utility sector, each serving millions of customers across different U.S. regions. Both companies emphasize innovation through renewable energy integration and infrastructure modernization, making them compelling choices for investors interested in sustainable utility growth. In this article, I will analyze their strengths to help you decide which company deserves a place in your investment portfolio.
Table of contents
Companies Overview
I will begin the comparison between Dominion Energy and DTE Energy by providing an overview of these two companies and their main differences.
Dominion Energy Overview
Dominion Energy, Inc. is a major player in the regulated electric sector, serving approximately 6.2 million customers across multiple states including Virginia, North Carolina, South Carolina, and parts of the Midwest. The company operates through segments focused on electricity generation and distribution, natural gas distribution, and contracted renewable assets. Its extensive infrastructure includes 30.2GW of electric generating capacity and nearly 185,000 miles of electric and gas distribution lines.
DTE Energy Overview
DTE Energy Company operates primarily in southeastern Michigan, providing electricity and natural gas to about 3.6 million customers. Its business spans electric generation from fossil-fuel, nuclear, hydroelectric, and renewable sources, alongside a substantial gas distribution network with 20,000 miles of mains and over 1.3 million meters. The company also offers industrial products and energy trading services, leveraging diverse assets to serve the utility market since 1903.
Key similarities and differences
Both Dominion Energy and DTE Energy operate in the regulated electric utility sector with significant natural gas distribution businesses, serving millions of residential and commercial customers. While Dominion Energy has a broader geographic footprint and larger asset base, including long-distance transmission lines, DTE Energy has a more concentrated market in Michigan with additional industrial and energy trading segments. Each company integrates renewable energy but differs in scale and segment focus.
Income Statement Comparison
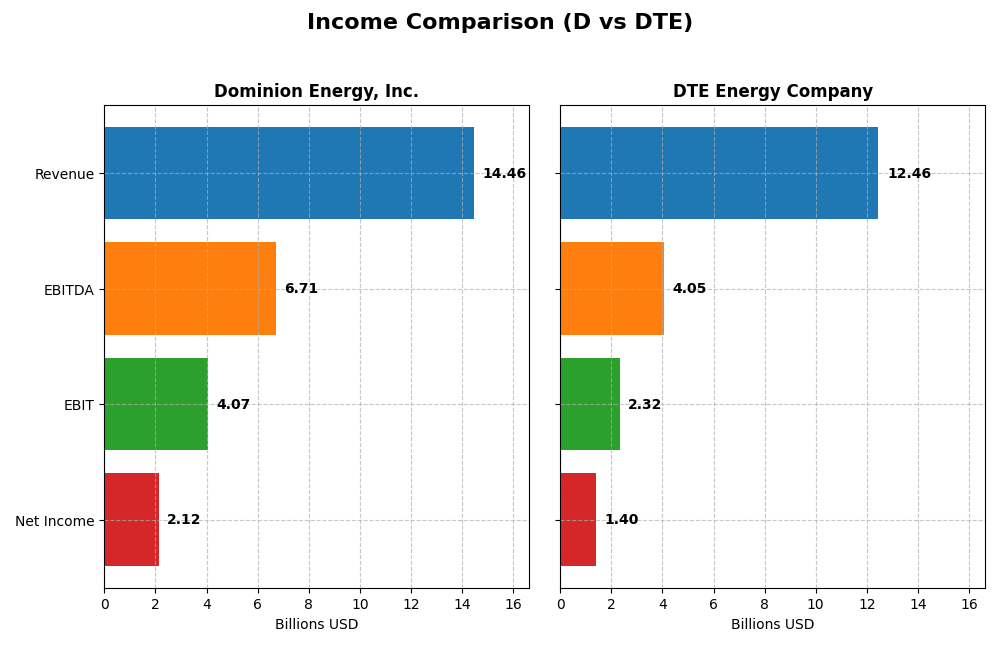
The table below compares the key income statement metrics for Dominion Energy, Inc. and DTE Energy Company for the fiscal year 2024, providing a snapshot of their financial performance.
| Metric | Dominion Energy, Inc. (D) | DTE Energy Company (DTE) |
|---|---|---|
| Market Cap | 49.5B | 27.0B |
| Revenue | 14.46B | 12.46B |
| EBITDA | 6.71B | 4.05B |
| EBIT | 4.07B | 2.32B |
| Net Income | 2.12B | 1.40B |
| EPS | 2.44 | 6.78 |
| Fiscal Year | 2024 | 2024 |
Income Statement Interpretations
Dominion Energy, Inc.
Dominion Energy’s revenue showed modest growth from 2020 to 2024, increasing from $14.2B to $14.5B, while net income surged significantly from a loss of $477M in 2020 to $2.04B in 2024. Gross and EBIT margins remained favorable, around 48% and 28%, respectively. The 2024 year saw EBIT grow by 10.15% and net margin improve by 6.03%, despite slight revenue growth slowdown.
DTE Energy Company
DTE Energy’s revenue grew from $11.4B in 2020 to $12.5B in 2024 but declined slightly year-over-year by 2.26%. Net income modestly increased overall, reaching $1.4B in 2024, with net margin at 11.25%. Margins showed stability but EBIT declined 1.53% in the last year. EPS growth was neutral at 0.15%, indicating limited earnings improvement recently.
Which one has the stronger fundamentals?
Dominion Energy exhibits stronger fundamentals with favorable gross, EBIT, and net margins, along with significant net income and EPS growth over the period. In contrast, DTE’s income statement shows mixed signals: favorable gross margin but neutral to unfavorable trends in earnings growth and net margin declines. Dominion’s income metrics and growth rates present a more robust financial profile.
Financial Ratios Comparison
The table below presents the most recent financial ratios for Dominion Energy, Inc. and DTE Energy Company as of fiscal year 2024, providing a clear basis for comparison.
| Ratios | Dominion Energy, Inc. (D) | DTE Energy Company (DTE) |
|---|---|---|
| ROE | 7.79% | 12.00% |
| ROIC | 2.86% | 4.65% |
| P/E | 21.28 | 17.80 |
| P/B | 1.66 | 2.14 |
| Current Ratio | 0.71 | 0.71 |
| Quick Ratio | 0.52 | 0.46 |
| D/E | 1.53 | 1.99 |
| Debt-to-Assets | 40.8% | 47.6% |
| Interest Coverage | 1.72 | 2.20 |
| Asset Turnover | 0.14 | 0.26 |
| Fixed Asset Turnover | 0.21 | 0.40 |
| Payout ratio | 105.4% | 57.7% |
| Dividend yield | 4.95% | 3.24% |
Interpretation of the Ratios
Dominion Energy, Inc.
Dominion Energy shows a mixed ratio profile with a favorable net margin of 14.69% and dividend yield at 4.95%, indicating reasonable profitability and shareholder returns. However, weak return on equity (7.79%) and return on invested capital (2.86%), alongside a low current ratio (0.71), suggest operational and liquidity concerns. The company pays dividends with a solid yield but must monitor cash flow coverage to avoid unsustainable payouts.
DTE Energy Company
DTE Energy exhibits favorable net margin (11.27%) and a decent dividend yield of 3.24%, reflecting steady profitability and shareholder income. Its return on equity is neutral at 12.0%, while return on invested capital is unfavorable at 4.65%. The current ratio stands at 0.71, indicating liquidity constraints. The company maintains dividends, but caution is warranted given the moderate free cash flow coverage and debt levels.
Which one has the best ratios?
Both Dominion Energy and DTE Energy present slightly unfavorable overall ratio profiles with 21.43% favorable metrics each, but Dominion’s lower return on equity and invested capital contrast with DTE’s stronger ROE. Dominion’s higher dividend yield is offset by more pronounced liquidity and operational weaknesses. Neither company clearly outperforms; investors should consider these mixed signals carefully.
Strategic Positioning
This section compares the strategic positioning of Dominion Energy, Inc. and DTE Energy Company, including Market position, Key segments, and exposure to disruption:
Dominion Energy, Inc.
- Large US regulated electric utility with significant market presence and moderate competitive pressure.
- Diverse segments: electric generation and distribution across multiple states, gas distribution, and contracted renewable assets.
- Exposure to renewable energy through contracted assets; some gas infrastructure; moderate disruption risk from energy transition.
DTE Energy Company
- Mid-sized US regulated electric utility focused in Michigan with relatively lower competitive pressure.
- Segments include electric and gas distribution, energy trading, and industrial projects, diversified but more regionally focused.
- Mix of fossil-fuel, nuclear, hydro, renewables, and active energy trading, facing technological changes in energy markets.
Dominion Energy, Inc. vs DTE Energy Company Positioning
Dominion Energy has a broader geographic footprint and more diversified energy segments, including significant gas distribution and renewable contracts. DTE Energy is more concentrated regionally with a strong focus on energy trading and industrial projects, offering different operational focuses and risk profiles.
Which has the best competitive advantage?
Both companies are shedding value with slightly unfavorable moats but show growing profitability trends. DTE Energy’s smaller gap between ROIC and WACC and diversified energy trading segment suggest a marginally stronger competitive position.
Stock Comparison
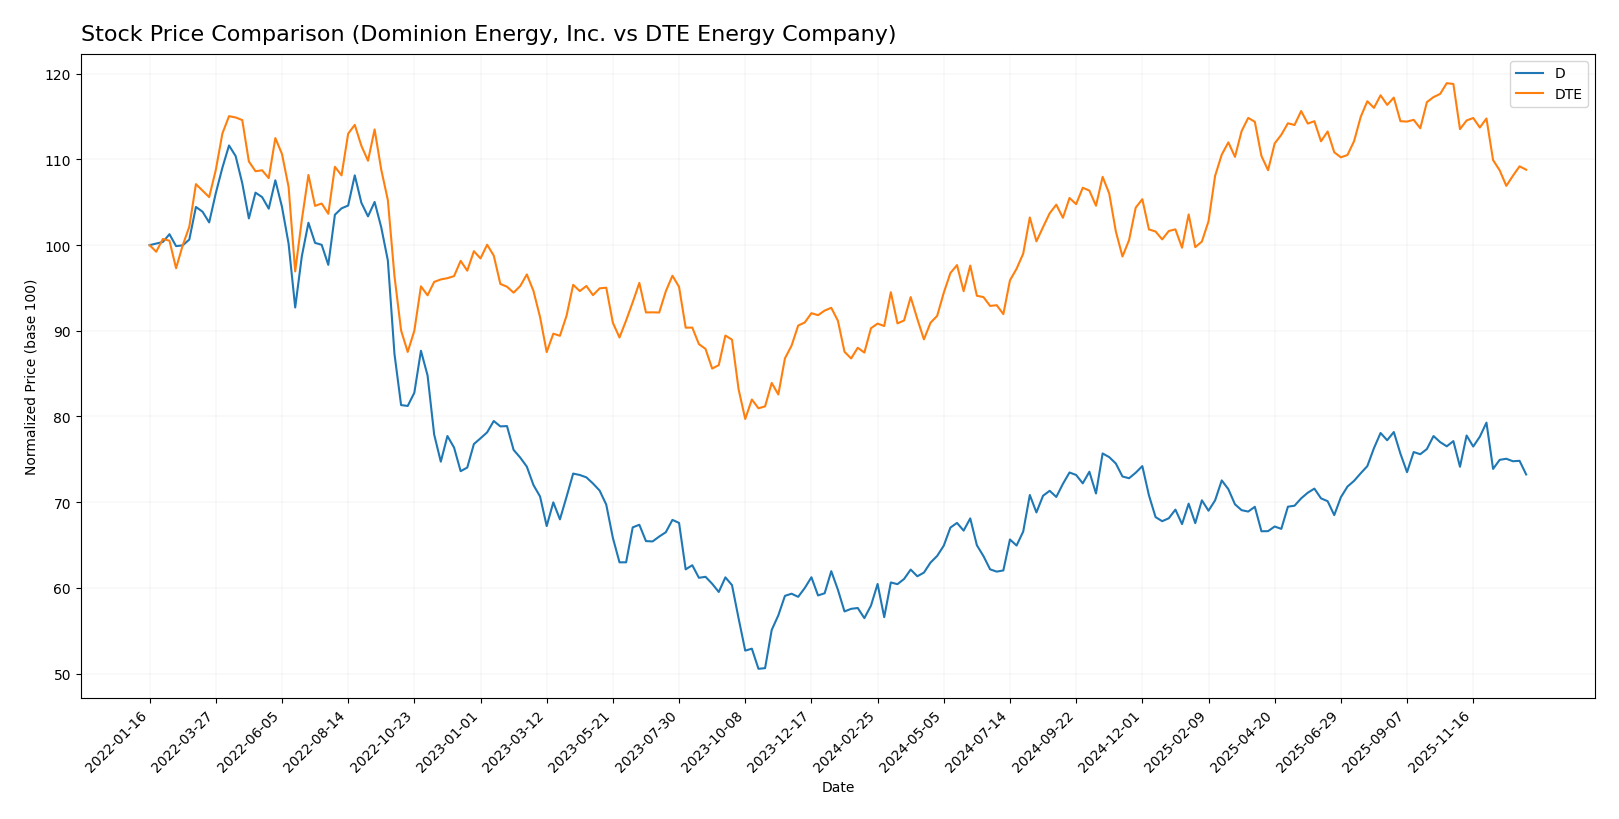
The stock prices of Dominion Energy, Inc. (D) and DTE Energy Company (DTE) have shown notable bullish trends over the past 12 months, with both experiencing deceleration and recent declines in price.
Trend Analysis
Dominion Energy, Inc. (D) displayed a 26.43% price increase over the past year, indicating a bullish trend with decelerating momentum and a standard deviation of 4.03. The stock reached a high of 62.77 and a low of 44.79.
DTE Energy Company (DTE) recorded a 20.49% price increase over the same period, also bullish with deceleration and higher volatility (std deviation 10.2). Its price fluctuated between 106.25 and 141.95.
Comparing both, Dominion Energy delivered the highest market performance with a larger price gain and more moderate volatility than DTE during the analyzed period.
Target Prices
Analysts present a clear target price consensus for Dominion Energy, Inc. and DTE Energy Company.
| Company | Target High | Target Low | Consensus |
|---|---|---|---|
| Dominion Energy, Inc. | 70 | 63 | 66 |
| DTE Energy Company | 157 | 138 | 148.29 |
The consensus target prices for both companies suggest moderate upside potential compared to their current prices, reflecting cautious optimism among analysts. Dominion Energy’s consensus target is about 14% above its current price of 57.98, while DTE Energy’s target consensus is roughly 14% higher than its current price of 129.89.
Analyst Opinions Comparison
This section compares analysts’ ratings and grades for Dominion Energy, Inc. (D) and DTE Energy Company (DTE):
Rating Comparison
D Rating
- Rating: C+, considered very favorable according to the evaluation.
- Discounted Cash Flow Score: 4, indicating a favorable outlook on valuation.
- ROE Score: 3, reflecting moderate efficiency in generating equity returns.
- ROA Score: 1, showing very unfavorable asset utilization efficiency.
- Debt To Equity Score: 3, a moderate level indicating balanced financial risk.
DTE Rating
- Rating: C, also considered very favorable by analysts.
- Discounted Cash Flow Score: 1, rated very unfavorable for valuation.
- ROE Score: 3, similarly moderate in return on equity performance.
- ROA Score: 2, considered moderate in how assets generate earnings.
- Debt To Equity Score: 1, very unfavorable, suggesting higher financial risk.
Which one is the best rated?
Based strictly on the provided data, Dominion Energy, Inc. (D) holds a better rating due to its higher discounted cash flow and debt-to-equity scores, despite both sharing the same overall score and return on equity grade.
Scores Comparison
Here is the comparison of the companies’ financial scores based on the Altman Z-Score and Piotroski Score:
Dominion Energy, Inc. Scores
- Altman Z-Score: Not available for Dominion Energy, Inc.
- Piotroski Score: 7, indicating strong financial health
DTE Energy Company Scores
- Altman Z-Score: 1.03, indicating financial distress zone risk
- Piotroski Score: 7, indicating strong financial health
Which company has the best scores?
DTE Energy Company has a measurable Altman Z-Score of 1.03, placing it in the distress zone, while Dominion Energy’s Altman Z-Score is unavailable. Both companies share a Piotroski Score of 7, reflecting strong financial health.
Grades Comparison
The comparison of recent grades and ratings for Dominion Energy, Inc. and DTE Energy Company reveals the following:
Dominion Energy, Inc. Grades
This table summarizes recent grades assigned to Dominion Energy, Inc. by reputable grading companies.
| Grading Company | Action | New Grade | Date |
|---|---|---|---|
| Barclays | Maintain | Overweight | 2025-12-17 |
| JP Morgan | Maintain | Underweight | 2025-12-11 |
| BMO Capital | Maintain | Market Perform | 2025-11-03 |
| Morgan Stanley | Maintain | Equal Weight | 2025-10-22 |
| Barclays | Maintain | Overweight | 2025-10-07 |
| Morgan Stanley | Maintain | Equal Weight | 2025-09-25 |
| JP Morgan | Maintain | Underweight | 2025-08-21 |
| JP Morgan | Maintain | Underweight | 2025-07-15 |
| Morgan Stanley | Maintain | Equal Weight | 2025-06-18 |
| Morgan Stanley | Maintain | Equal Weight | 2025-05-22 |
Dominion Energy’s grades indicate a mix of “Overweight,” “Equal Weight,” and “Underweight” ratings, with a consensus rating of “Hold” reflecting moderate confidence among analysts.
DTE Energy Company Grades
This table presents recent grades assigned to DTE Energy Company by established grading firms.
| Grading Company | Action | New Grade | Date |
|---|---|---|---|
| BMO Capital | Maintain | Market Perform | 2025-12-24 |
| UBS | Maintain | Buy | 2025-12-17 |
| JP Morgan | Maintain | Neutral | 2025-12-11 |
| Jefferies | Upgrade | Buy | 2025-12-11 |
| B of A Securities | Maintain | Buy | 2025-11-05 |
| Scotiabank | Maintain | Sector Perform | 2025-10-31 |
| Morgan Stanley | Maintain | Overweight | 2025-10-22 |
| Barclays | Maintain | Equal Weight | 2025-10-14 |
| UBS | Maintain | Buy | 2025-10-10 |
| Scotiabank | Downgrade | Sector Perform | 2025-10-03 |
DTE Energy’s grades show multiple “Buy” and “Overweight” ratings, alongside “Market Perform” and “Sector Perform,” with a consensus rating also at “Hold,” indicating generally positive analyst sentiment.
Which company has the best grades?
DTE Energy Company has received more “Buy” and “Overweight” grades than Dominion Energy, which features a substantial number of “Equal Weight” and “Underweight” ratings. This suggests stronger analyst endorsement for DTE, potentially impacting investor perception and portfolio allocation decisions accordingly.
Strengths and Weaknesses
Below is a comparative overview of key strengths and weaknesses for Dominion Energy, Inc. (D) and DTE Energy Company (DTE) based on the most recent data available in 2026.
| Criterion | Dominion Energy, Inc. (D) | DTE Energy Company (DTE) |
|---|---|---|
| Diversification | Strong regional energy segments: Virginia and South Carolina focus; diversified energy sources including contracted energy | Balanced mix of Electric, Gas, Energy Trading, and DTE Vantage segments with exposure to energy trading growth |
| Profitability | Net margin strong at 14.69%, but ROIC (2.86%) below WACC (5.34%), indicating value destruction | Net margin solid at 11.27%, ROIC (4.65%) below WACC (5.08%), also indicates value destruction though less severe |
| Innovation | Moderate innovation with expansion in contracted energy; slower asset turnover suggests operational inefficiencies | Innovation driven by strong Energy Trading segment; higher asset turnover than Dominion but still unfavorable |
| Global presence | Primarily regional US presence, limited global footprint | Primarily regional US focus, no significant global presence |
| Market Share | Strong in Virginia market with $10.2B revenue; dominant in regional energy supply | Well-established in Michigan with diversified revenue streams, including $5.8B in Electric segment |
Key takeaways: Both companies face challenges in generating returns above their cost of capital, signaling value destruction despite improving profitability trends. Dominion Energy’s strength lies in its dominant regional market share, while DTE benefits from a more diversified business model with significant energy trading exposure. Investors should monitor operational efficiency and ROIC improvements cautiously.
Risk Analysis
Below is a comparative table summarizing key risk factors for Dominion Energy, Inc. (D) and DTE Energy Company (DTE) based on the most recent data from 2024 and 2026 market conditions:
| Metric | Dominion Energy, Inc. (D) | DTE Energy Company (DTE) |
|---|---|---|
| Market Risk | Beta 0.70 (moderate volatility) | Beta 0.48 (lower volatility) |
| Debt level | Debt/Equity 1.53 (high), Debt to Assets 41% (neutral) | Debt/Equity 1.99 (very high), Debt to Assets 48% (neutral) |
| Regulatory Risk | High, due to extensive regulated electric & gas operations in multiple states | High, with regulated utilities and energy trading exposure in Michigan |
| Operational Risk | Large asset base with complex operations; potential issues in transmission and distribution | Diverse energy mix includes fossil fuels and renewables; operational complexity in energy trading |
| Environmental Risk | Exposure to transition risks; nonregulated renewable assets mitigate somewhat | Fossil fuel generation exposure increases environmental risk; transition to renewables ongoing |
| Geopolitical Risk | US-focused, low geopolitical risk | US-focused, low geopolitical risk |
Synthesis: Both companies face significant regulatory and debt-related risks, with DTE carrying a higher leverage load, increasing financial risk. Market risk is moderate, with Dominion slightly more volatile. Environmental transition pressures are notable, especially for DTE due to fossil fuel reliance. Operational complexity and regulated market exposure remain primary concerns. Investors should carefully monitor debt levels and regulatory developments as these are the most impactful risks currently.
Which Stock to Choose?
Dominion Energy, Inc. (D) shows a mostly favorable income statement with a strong net margin of 14.69% and positive growth in net income and EPS over 2020-2024. However, financial ratios reveal mixed signals: while dividend yield and WACC are favorable, returns on equity and invested capital are weak, and leverage ratios are high. The company’s rating stands at C+ with a moderate overall score, reflecting cautious financial health and a slightly unfavorable moat due to ROIC below WACC despite improving profitability.
DTE Energy Company (DTE) presents a less favorable income profile with a net margin of 11.25% and declining EPS over the same period, coupled with a negative net margin growth trend. Its financial ratios are slightly better than Dominion’s in terms of returns on equity and capital employed but face challenges in leverage and liquidity. The company holds a C rating with moderate overall scores, a strong Piotroski score of 7, yet is in the distress zone for bankruptcy risk by Altman Z-Score, and similarly a slightly unfavorable moat with growing ROIC but below WACC.
Investors prioritizing income statement strength and dividend yield might find Dominion Energy’s profile more appealing due to its favorable profitability and stable rating, while those focused on financial strength indicators such as Piotroski score and moderate returns could view DTE as potentially suitable despite its income growth challenges and liquidity risks. The choice could thus depend on whether an investor favors income stability or financial robustness amidst moderate risk.
Disclaimer: Investment carries a risk of loss of initial capital. The past performance is not a reliable indicator of future results. Be sure to understand risks before making an investment decision.
Go Further
I encourage you to read the complete analyses of Dominion Energy, Inc. and DTE Energy Company to enhance your investment decisions: