Home > Comparison > Industrials > XYL vs DOV
The strategic rivalry between Xylem Inc. and Dover Corporation shapes the industrial machinery sector’s evolution. Xylem focuses on engineered water solutions, blending hardware with smart analytics. Dover operates a diversified portfolio across engineered products, clean energy, and climate tech. This head-to-head pits specialized innovation against broad industrial exposure. I will assess which trajectory offers a superior risk-adjusted return, guiding investors seeking durable exposure in industrials.
Table of contents
Companies Overview
Xylem Inc. and Dover Corporation stand as key players in the industrial machinery sector, shaping water and equipment solutions globally.
Xylem Inc.: Water Technology Pioneer
Xylem Inc. specializes in engineered water solutions across infrastructure, applied water, and measurement segments. Its core revenue derives from pumps, filtration systems, and smart water technology sales. In 2026, the company strategically focuses on expanding digital analytics and remote monitoring services to enhance water management efficiency worldwide.
Dover Corporation: Diverse Industrial Innovator
Dover Corporation operates as a multifaceted industrial equipment provider spanning engineered products, clean energy, imaging, pumps, and climate technologies. Revenue streams come from equipment sales, aftermarket services, and software solutions. Its 2026 strategy emphasizes growth in clean energy fueling and automation to capture emerging industrial market demands.
Strategic Collision: Similarities & Divergences
Both companies leverage broad industrial expertise but diverge in focus—Xylem centers on water-centric infrastructure while Dover pursues a diversified industrial portfolio. Their competition primarily unfolds in specialized equipment and service innovation. Xylem offers a niche, tech-driven investment profile, whereas Dover presents broader industrial exposure with multiple growth vectors.
Income Statement Comparison
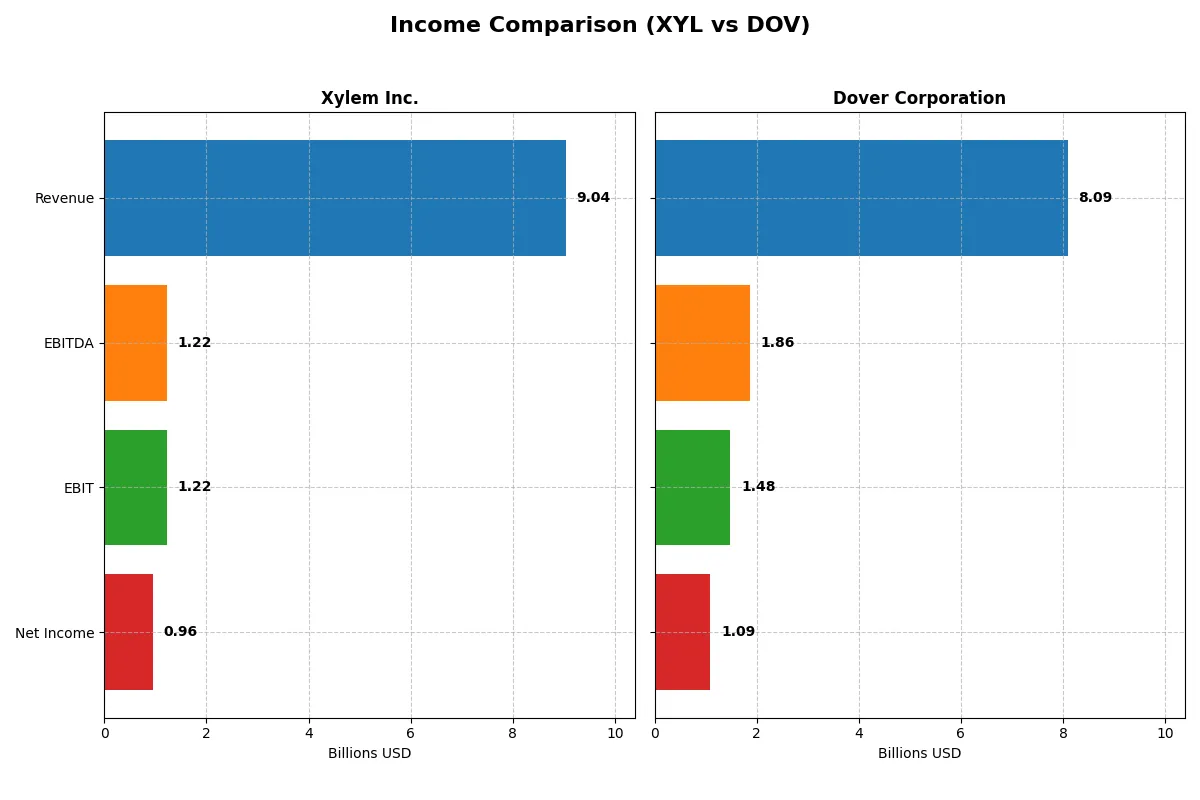
The following data dissects the core profitability and scalability of both corporate engines to reveal who dominates the bottom line:
| Metric | Xylem Inc. (XYL) | Dover Corporation (DOV) |
|---|---|---|
| Revenue | 9.04B | 8.09B |
| Cost of Revenue | 5.56B | 4.87B |
| Operating Expenses | 2.25B | 1.84B |
| Gross Profit | 3.48B | 3.22B |
| EBITDA | 1.22B | 1.86B |
| EBIT | 1.22B | 1.48B |
| Interest Expense | 29M | 110M |
| Net Income | 957M | 1.09B |
| EPS | 3.93 | 7.97 |
| Fiscal Year | 2025 | 2025 |
Income Statement Analysis: The Bottom-Line Duel
This income statement comparison reveals which company runs the more efficient and profitable corporate engine in today’s competitive landscape.
Xylem Inc. Analysis
Xylem’s revenue grew steadily to 9.04B in 2025, with net income rising to 957M. Gross margin holds firm at 38.5%, and net margin improves to 10.6%. The company’s EBIT margin at 13.5% signals solid operational efficiency. Recent momentum shows favorable profit growth and disciplined expense control supporting sustainable earnings expansion.
Dover Corporation Analysis
Dover’s revenue reached 8.09B in 2025, with net income at 1.09B. It maintains a slightly higher gross margin of 39.8% and a superior net margin of 13.5%. However, Dover’s EBIT margin stands stronger at 18.3% but recent one-year growth faltered with declines in EBIT and net margin. Expense growth outpaced revenue, signaling margin pressure despite scale.
Margin Discipline vs. Growth Trajectory
Xylem demonstrates consistent profit and margin expansion, reflecting efficient capital allocation and operational leverage. Dover’s stronger margin base contrasts with recent profit volatility and weak growth trends. For investors, Xylem’s profile offers a growth-oriented, margin-expanding engine, while Dover presents a more mature but currently challenged earnings model.
Financial Ratios Comparison
These vital ratios act as a diagnostic tool to expose the underlying fiscal health, valuation premiums, and capital efficiency of the companies compared here:
| Ratios | Xylem Inc. (XYL) | Dover Corporation (DOV) |
|---|---|---|
| ROE | 8.3% | 14.8% |
| ROIC | 6.4% | 9.4% |
| P/E | 34.6 | 24.5 |
| P/B | 2.89 | 3.62 |
| Current Ratio | 1.63 | 1.79 |
| Quick Ratio | 1.28 | 1.28 |
| D/E | 0.17 | 0.45 |
| Debt-to-Assets | 11.0% | 24.8% |
| Interest Coverage | 42.2 | 12.5 |
| Asset Turnover | 0.51 | 0.60 |
| Fixed Asset Turnover | 7.80 | 7.23 |
| Payout ratio | 40.9% | 25.9% |
| Dividend yield | 1.18% | 1.06% |
| Fiscal Year | 2025 | 2025 |
Efficiency & Valuation Duel: The Vital Signs
Financial ratios act as a company’s DNA, unveiling hidden operational strengths and risks behind surface-level numbers.
Xylem Inc.
Xylem posts a solid 10.6% net margin but a modest 8.3% ROE, suggesting limited profitability despite efficient cost control. Its elevated P/E of 34.6 signals an expensive valuation relative to earnings. Shareholders receive a moderate 1.18% dividend yield, balancing returns while the company reinvests in R&D for future growth.
Dover Corporation
Dover delivers stronger profitability with a 13.5% net margin and a robust 14.8% ROE, reflecting efficient capital use. Its P/E of 24.5 appears more reasonable, although a higher P/B of 3.62 marks some premium pricing. The dividend yield stands near 1.06%, indicating stable shareholder payouts alongside steady operational performance.
Premium Valuation vs. Operational Safety
Xylem trades at a stretched valuation with moderate returns, while Dover offers higher profitability at a fairer price. Dover’s metrics suggest a better balance of risk and reward. Investors prioritizing operational strength may prefer Dover’s profile over Xylem’s growth-focused stance.
Which one offers the Superior Shareholder Reward?
I see Xylem (XYL) offers a 1.18% dividend yield with a payout ratio near 41%, showing solid free cash flow coverage at 73%. Its buybacks are moderate but consistent. Dover (DOV) yields slightly less at 1.06%, with a much lower payout ratio of 26%, preserving cash for buybacks and growth. Dover’s free cash flow conversion is stronger at 83%, supporting more aggressive buybacks that enhance total returns. Historically, Dover’s capital allocation balances income and buybacks more sustainably. I conclude Dover offers a superior total shareholder reward in 2026, blending yield with capital return and reinvestment efficiency.
Comparative Score Analysis: The Strategic Profile
The radar chart reveals the fundamental DNA and trade-offs of Xylem Inc. and Dover Corporation, highlighting their core financial strengths and weaknesses:
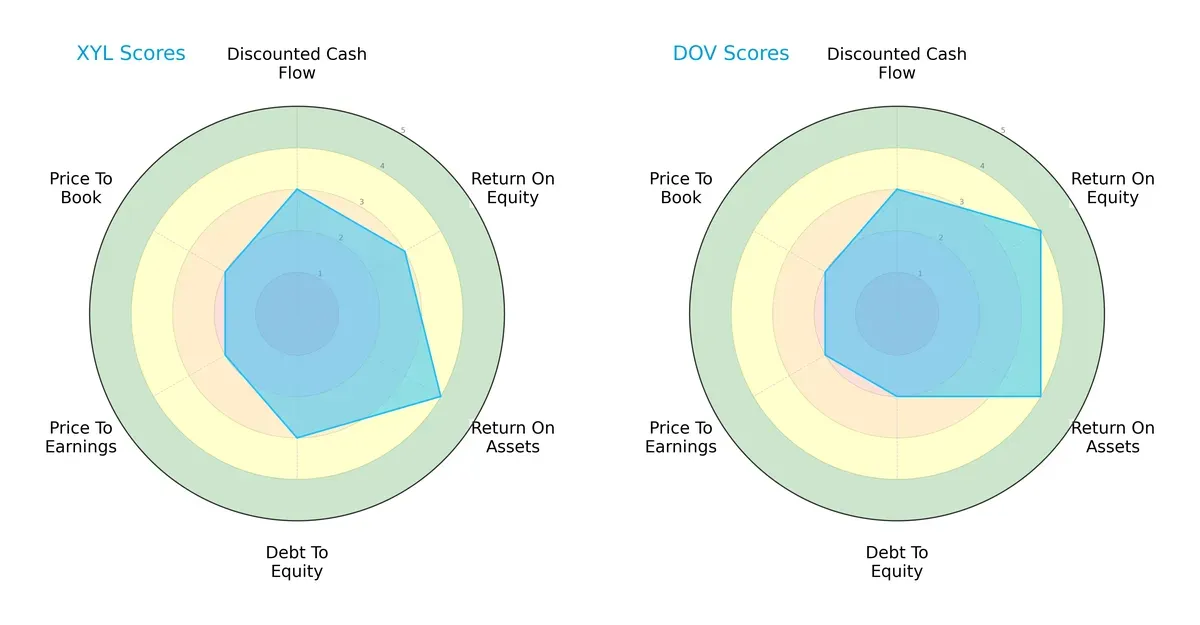
Xylem Inc. shows a balanced profile with solid ROA (4) and moderate DCF, ROE, and Debt/Equity scores (3 each). Dover Corporation edges ahead in profitability with higher ROE (4) and matches Xylem’s ROA (4), but carries more financial risk with a lower Debt/Equity score (2). Both firms share weak valuation scores (PE and PB at 2), signaling potential overvaluation or market skepticism. Dover relies more on operational efficiency, while Xylem maintains steadier leverage control.
Bankruptcy Risk: Solvency Showdown
The Altman Z-Score difference signals Dover Corporation’s stronger buffer against bankruptcy risk in this cycle compared to Xylem Inc.:
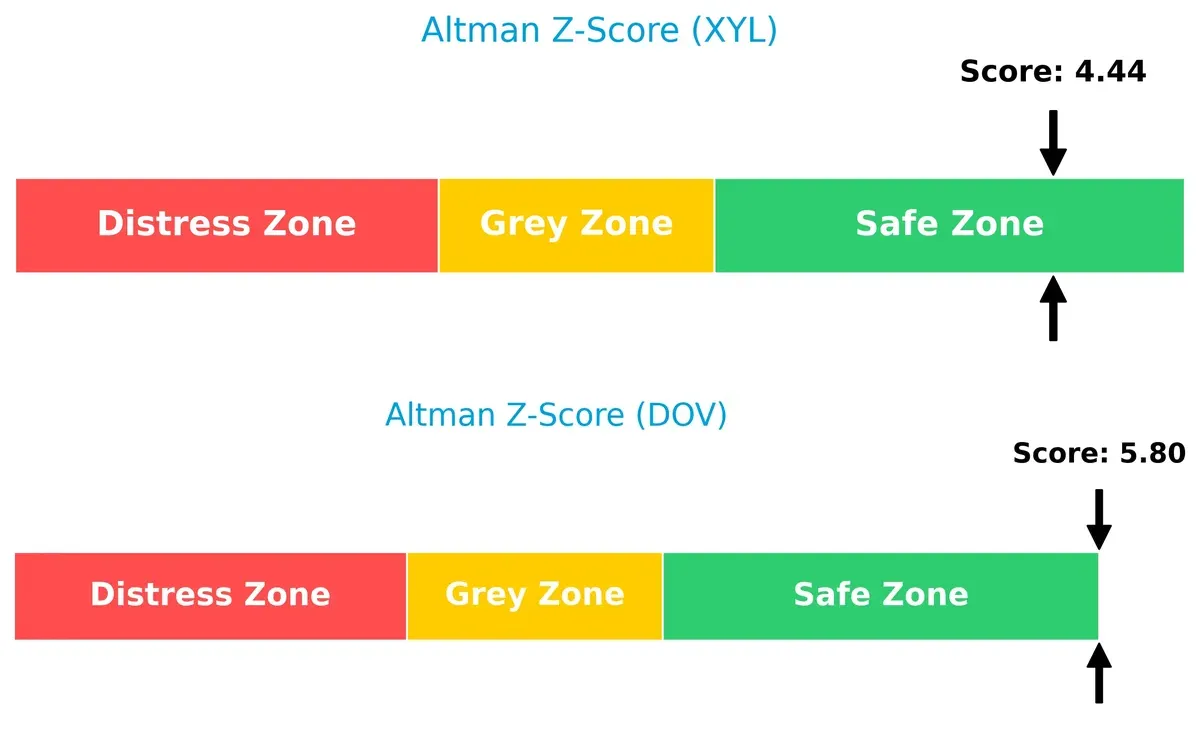
Dover’s 5.80 comfortably sits in the safe zone, indicating robust solvency and lower default risk. Xylem’s 4.44 also places it safely above distress thresholds but reflects slightly less financial cushion. Historically, firms with Z-scores above 3 withstand downturns better, and Dover’s lead suggests it manages leverage and liquidity more conservatively.
Financial Health: Quality of Operations
Xylem Inc. demonstrates stronger operational health with a Piotroski F-Score indicating solid internal fundamentals compared to Dover Corporation’s average score:
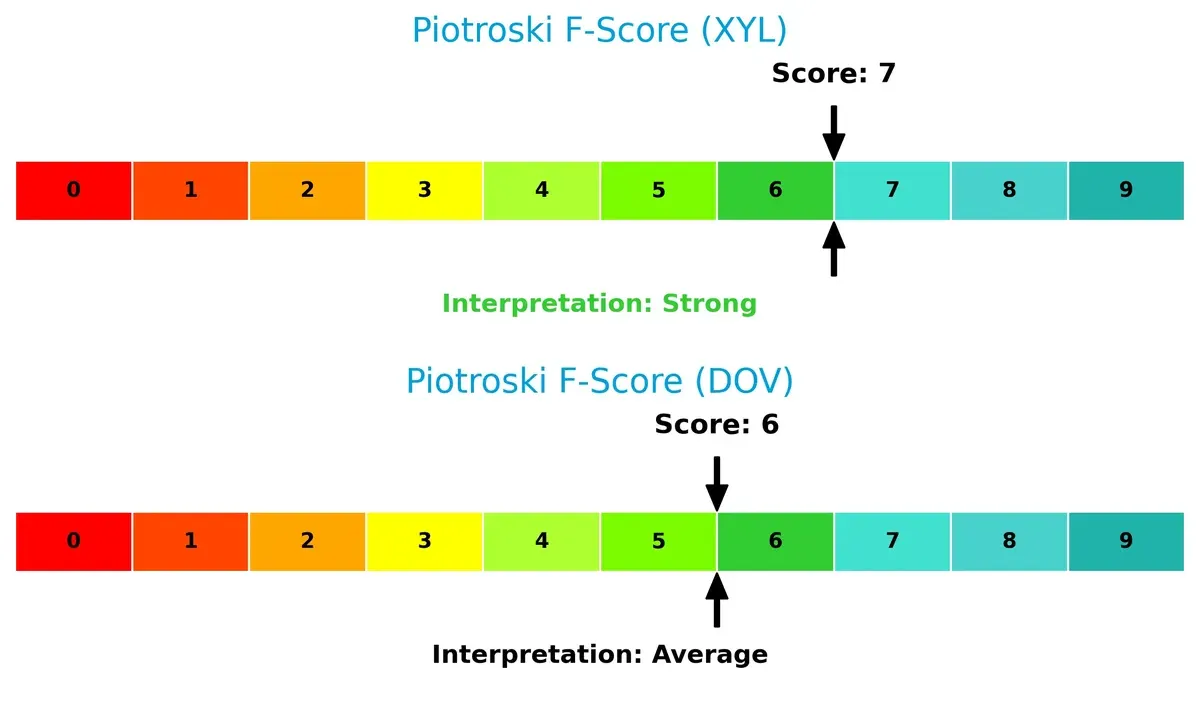
Xylem scores 7/9, reflecting efficient profitability, prudent leverage, and good liquidity. Dover’s 6/9 is respectable but hints at weaker internal metrics or marginal red flags. In my experience, a score above 7 signals peak financial health, so Xylem is currently better positioned to sustain earnings quality and operational resilience.
How are the two companies positioned?
This section dissects the operational DNA of Xylem and Dover by comparing their revenue distribution and internal dynamics. The goal is to confront their economic moats to identify the most resilient, sustainable competitive advantage today.
Revenue Segmentation: The Strategic Mix
This visual comparison dissects how Xylem Inc. and Dover Corporation diversify their income streams and reveals where their primary sector bets lie:
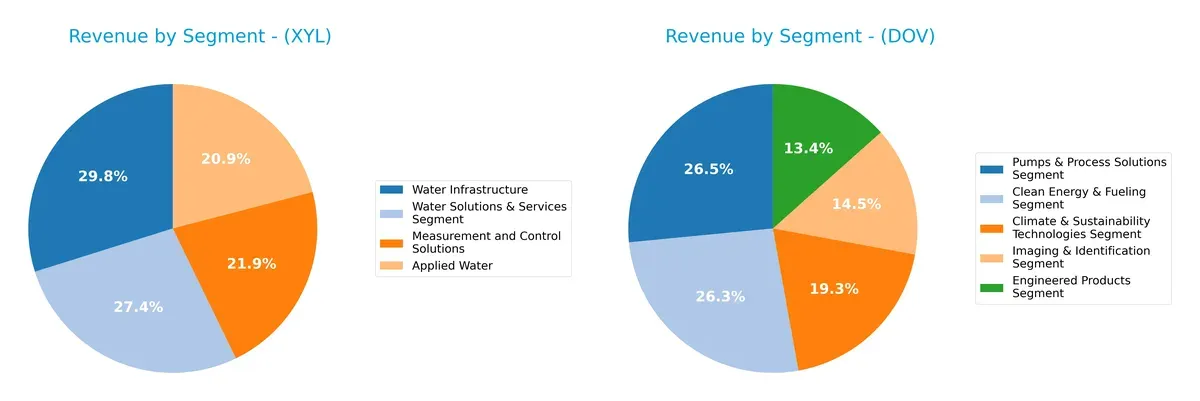
Xylem leans on Water Infrastructure at $2.56B, but balances Applied Water ($1.79B) and Measurement and Control ($1.87B), showing moderate diversification. Dover spreads revenue more evenly across five segments, each near $1.1B–2.1B, with Pumps & Process Solutions ($2.15B) and Clean Energy ($2.13B) anchoring its mix. Dover’s broad portfolio mitigates concentration risk, while Xylem’s focused water infrastructure dominance signals strong ecosystem lock-in but elevated segment dependency.
Strengths and Weaknesses Comparison
This table compares the strengths and weaknesses of Xylem Inc. and Dover Corporation:
Xylem Inc. Strengths
- Diverse water-focused product segments
- Strong liquidity ratios (current 1.62, quick 1.28)
- Low debt-to-assets (11.01%) with high interest coverage (42.17)
- Favorable net margin (10.59%)
- Favorable fixed asset turnover (7.8)
- Significant US revenue base ($4.86B in 2024)
Dover Corporation Strengths
- More diversified industrial product segments
- Favorable net margin (13.52%)
- Solid liquidity ratios (current 1.79, quick 1.28)
- Moderate debt-to-assets (24.79%) with good interest coverage (13.52)
- Favorable fixed asset turnover (7.23)
- Larger US revenue base ($4.40B in 2025)
Xylem Inc. Weaknesses
- Below cost of capital ROE (8.34% vs. 8.75% WACC)
- High P/E ratio (34.64) may indicate overvaluation
- Moderate asset turnover (0.51)
- Neutral ROIC (6.42%)
- Less diversified geographically with heavy US concentration
Dover Corporation Weaknesses
- Higher price-to-book ratio (3.62) signals potential valuation risk
- ROE moderate (14.77%) but only neutral status
- Neutral ROIC (9.45%) close to WACC (9.08%)
- Neutral asset turnover (0.6)
- Geographic revenue more balanced but still US dominant
Xylem’s strengths lie in liquidity, conservative leverage, and focused water solutions, though its valuation and returns raise caution. Dover shows stronger profitability and product diversification but faces valuation and efficiency scrutiny. Both companies maintain slightly favorable financial profiles, shaping cautious strategic approaches.
The Moat Duel: Analyzing Competitive Defensibility
A structural moat is the only true shield protecting long-term profits from relentless competition erosion. Let’s dissect the moat dynamics of two industrial machinery leaders:
Xylem Inc.: Intangible Assets and Innovation-Driven Moat
Xylem’s competitive edge stems from proprietary water technology and integrated smart solutions. This manifests in steady margin stability and favorable profitability metrics. However, declining ROIC signals mounting pressure on sustaining its moat in 2026.
Dover Corporation: Diversified Product Portfolio with Scale Advantages
Dover leverages a broad industrial equipment portfolio and scale-driven cost advantages, delivering higher margins than Xylem. Despite slight value erosion and declining ROIC, Dover’s diversified markets offer expansion opportunities, potentially reinforcing its moat.
Moat Strength Showdown: Specialized Innovation vs. Scale and Diversification
Both firms face declining ROIC trends, but Dover’s broader product scope and scale grant it a slightly wider moat. I conclude Dover is better positioned to defend market share amid industrial headwinds.
Which stock offers better returns?
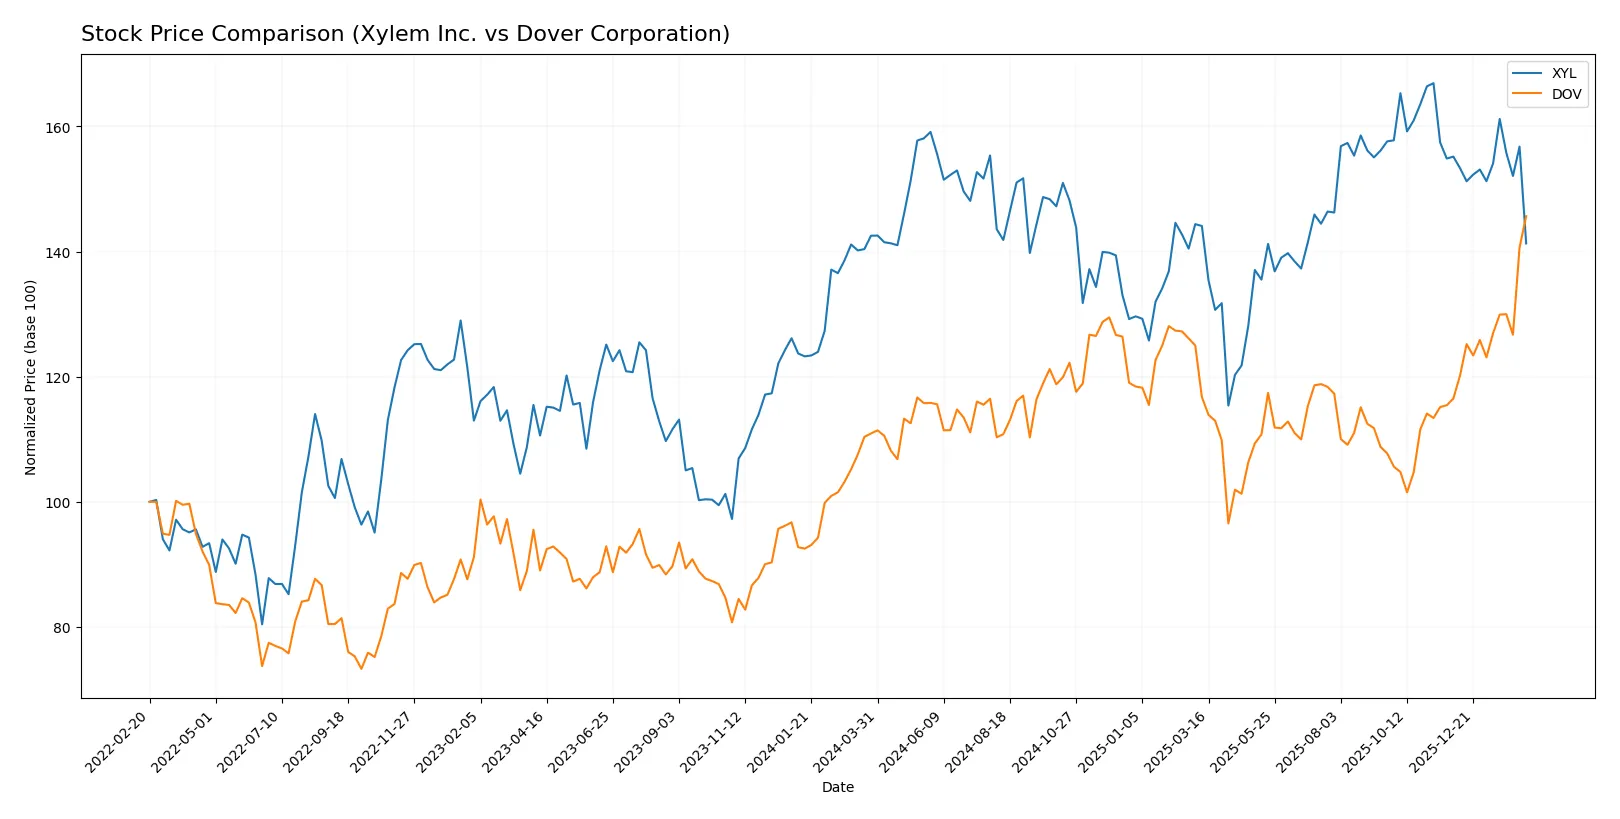
Over the past year, Xylem Inc. and Dover Corporation showed contrasting price dynamics, with Xylem facing a mild decline and Dover achieving a strong gain, reflecting divergent trading momentum.
Trend Comparison
Xylem Inc.’s stock declined by 0.87% over the last 12 months, marking a bearish trend with decelerating losses. The price ranged from $104.6 to $151.31, showing moderate volatility (9.59% std deviation).
Dover Corporation’s stock rose 31.3% in the same period, indicating a bullish trend with accelerating gains. It traded between $153.55 and $231.63, exhibiting higher volatility (12.76% std deviation).
Dover outperformed Xylem significantly, delivering the highest market return with sustained upward momentum and stronger buyer dominance.
Target Prices
Analysts present a confident upside for both Xylem Inc. and Dover Corporation based on consensus targets.
| Company | Target Low | Target High | Consensus |
|---|---|---|---|
| Xylem Inc. | 138 | 176 | 162.67 |
| Dover Corporation | 195 | 256 | 223.7 |
Xylem’s consensus target sits about 27% above its current price, indicating growth potential. Dover’s target implies a 4% upside, suggesting a more moderate but positive outlook.

Don’t Let Luck Decide Your Entry Point
Optimize your entry points with our advanced ProRealTime indicators. You’ll get efficient buy signals with precise price targets for maximum performance. Start outperforming now!
How do institutions grade them?
The following tables show recent institutional grades for Xylem Inc. and Dover Corporation:
Xylem Inc. Grades
This table summarizes recent grades from reputable financial institutions for Xylem Inc.
| Grading Company | Action | New Grade | Date |
|---|---|---|---|
| Citigroup | Maintain | Buy | 2026-02-11 |
| Stifel | Maintain | Buy | 2026-02-11 |
| RBC Capital | Maintain | Outperform | 2026-02-11 |
| Barclays | Maintain | Overweight | 2026-02-11 |
| Barclays | Maintain | Overweight | 2026-01-07 |
| Mizuho | Maintain | Neutral | 2026-01-05 |
| TD Cowen | Maintain | Hold | 2025-12-05 |
| UBS | Maintain | Buy | 2025-11-06 |
| Stifel | Maintain | Buy | 2025-10-29 |
| RBC Capital | Maintain | Outperform | 2025-10-29 |
Dover Corporation Grades
This table details recent grades from notable financial institutions for Dover Corporation.
| Grading Company | Action | New Grade | Date |
|---|---|---|---|
| JP Morgan | Maintain | Overweight | 2026-01-30 |
| Wells Fargo | Maintain | Equal Weight | 2026-01-30 |
| RBC Capital | Maintain | Sector Perform | 2026-01-30 |
| Oppenheimer | Maintain | Outperform | 2026-01-26 |
| JP Morgan | Maintain | Overweight | 2026-01-16 |
| Barclays | Maintain | Equal Weight | 2026-01-07 |
| Wells Fargo | Maintain | Equal Weight | 2026-01-07 |
| UBS | Upgrade | Buy | 2026-01-05 |
| Wells Fargo | Maintain | Equal Weight | 2025-12-15 |
| Oppenheimer | Maintain | Outperform | 2025-11-14 |
Which company has the best grades?
Xylem Inc. holds a stronger consensus with multiple Buy and Outperform ratings. Dover shows mixed views, with several Equal Weight and Sector Perform grades but also an Upgrade to Buy. Investors may see Xylem’s grades as more bullish, while Dover’s ratings suggest cautious optimism.
Risks specific to each company
The following categories identify the critical pressure points and systemic threats facing both firms in the 2026 market environment:
1. Market & Competition
Xylem Inc.
- Competes in water technology with growing demand, but faces intense competition in industrial machinery.
Dover Corporation
- Operates diverse segments including clean energy and industrial automation, facing broad competitive pressures.
2. Capital Structure & Debt
Xylem Inc.
- Low debt-to-equity (0.17) and strong interest coverage (42.17) indicate a conservative capital structure.
Dover Corporation
- Higher debt-to-equity (0.45) and lower interest coverage (13.52) suggest greater leverage risk, though still manageable.
3. Stock Volatility
Xylem Inc.
- Beta of 1.16 signals moderate volatility, close to sector norms.
Dover Corporation
- Slightly higher beta at 1.29 reflects greater stock price sensitivity to market swings.
4. Regulatory & Legal
Xylem Inc.
- Exposure to water infrastructure regulations and environmental compliance.
Dover Corporation
- Faces regulatory risks across multiple industries, including clean energy and aerospace sectors.
5. Supply Chain & Operations
Xylem Inc.
- Global supply chain complexity in engineered water solutions, vulnerable to raw material cost fluctuations.
Dover Corporation
- Diverse product lines increase operational complexity and supply chain fragility.
6. ESG & Climate Transition
Xylem Inc.
- Positioned well with water sustainability focus, critical in climate transition strategies.
Dover Corporation
- Increasing exposure via clean energy and climate tech segments, but transition risks remain significant.
7. Geopolitical Exposure
Xylem Inc.
- International operations in multiple regions, subject to geopolitical tensions affecting water infrastructure projects.
Dover Corporation
- Broad international footprint with risks from trade policies and geopolitical instability impacting supply chains.
Which company shows a better risk-adjusted profile?
Xylem’s most impactful risk lies in competitive pressure within the water technology sector, while Dover faces significant leverage and regulatory complexity risks. Xylem’s conservative capital structure and strong interest coverage give it a more favorable risk-adjusted profile. Dover’s higher debt amplifies financial risk despite its diversified business. Xylem’s Altman Z-Score near 4.44 confirms solid financial health, whereas Dover’s higher leverage and complex operations introduce more uncertainty.
Final Verdict: Which stock to choose?
Xylem Inc. (XYL) impresses with its operational efficiency and consistent cash generation despite its unfavorable ROIC trend. Its key vulnerability lies in value destruction, a point of vigilance for disciplined investors. It suits portfolios targeting steady growth with a tolerance for strategic turnaround risks.
Dover Corporation (DOV) boasts a strategic moat anchored in robust asset returns and solid profitability, supporting a more resilient earnings profile. While its profitability trends show some softness, it offers better stability than XYL and fits well in GARP portfolios seeking balanced growth and value.
If you prioritize capital efficiency and operational resilience, Dover outshines with stronger returns and safer financial footing. However, if you seek a company with efficient cash flow and potential for operational improvement, Xylem might offer compelling upside, albeit with higher risk.
Disclaimer: Investment carries a risk of loss of initial capital. The past performance is not a reliable indicator of future results. Be sure to understand risks before making an investment decision.
Go Further
I encourage you to read the complete analyses of Xylem Inc. and Dover Corporation to enhance your investment decisions: