Home > Comparison > Industrials > SYM vs DOV
The strategic rivalry between Symbotic Inc. and Dover Corporation shapes the industrial machinery landscape. Symbotic pioneers warehouse automation with a cutting-edge robotics model, while Dover excels as a diversified equipment and components powerhouse. This analysis examines their contrasting operational approaches and growth vectors. I aim to identify which company offers a superior risk-adjusted return profile for diversified portfolios navigating the evolving industrial sector in 2026.
Table of contents
Companies Overview
Symbotic Inc. and Dover Corporation both hold significant influence in the industrial machinery sector, shaping automation and equipment supply markets in the US.
Symbotic Inc.: Innovative Warehouse Automation Leader
Symbotic Inc. specializes in automation technology for retail and wholesale warehouse efficiency. Its core revenue driver is the Symbotic System, a full-service robotics automation platform that cuts costs and boosts inventory management. In 2026, Symbotic focuses on expanding its technological edge in warehouse automation to capture greater market share.
Dover Corporation: Diversified Industrial Equipment Provider
Dover Corporation operates as a broad industrial machinery supplier with a diverse portfolio including engineered products, clean energy equipment, and process solutions. Its revenue stems from equipment sales, digital solutions, and aftermarket services across multiple sectors. Dover’s 2026 strategy emphasizes innovation in clean energy and digital integration to support sustainable growth.
Strategic Collision: Similarities & Divergences
Symbotic pursues a high-tech, specialized automation approach, while Dover leverages its diversified industrial product range and service network. Their primary competition centers on automation and efficiency solutions for industrial clients. Symbotic offers a focused, tech-driven profile, contrasting with Dover’s broad, multi-segment industrial footprint and steady cash flow generation.
Income Statement Comparison
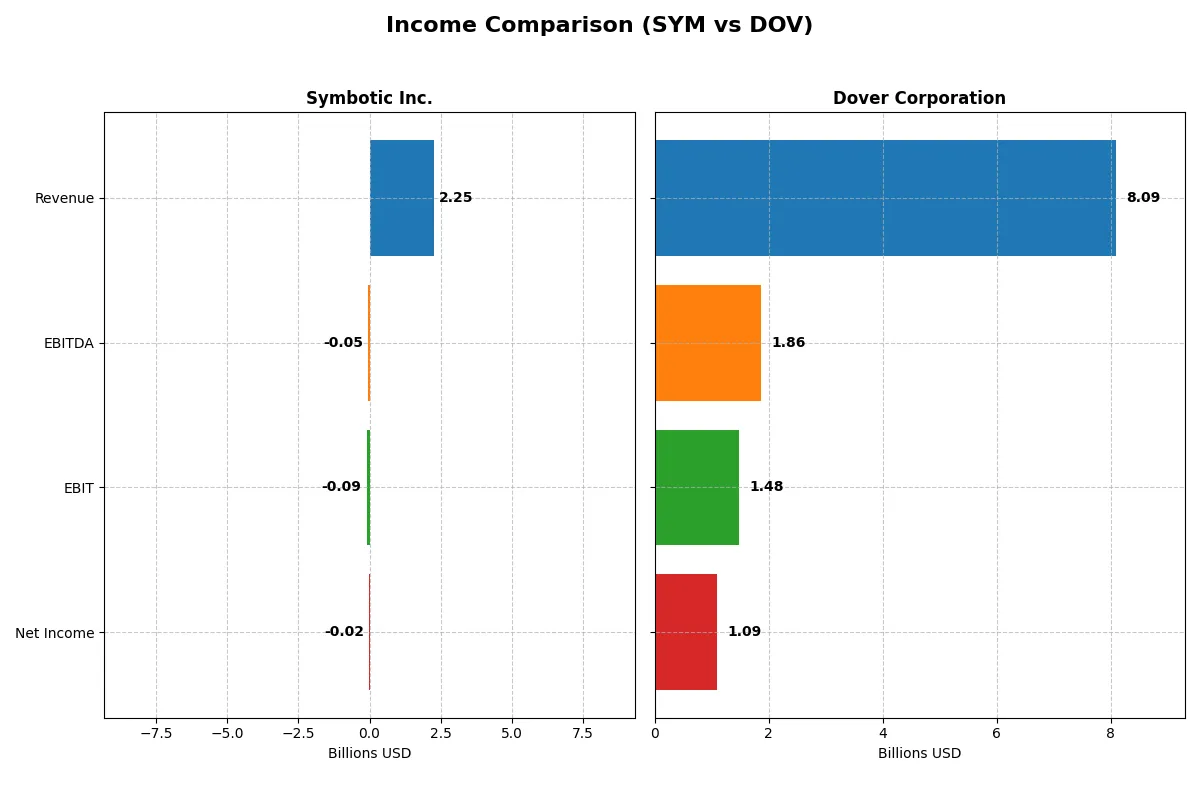
The following data dissects the core profitability and scalability of both corporate engines to reveal who dominates the bottom line:
| Metric | Symbotic Inc. (SYM) | Dover Corporation (DOV) |
|---|---|---|
| Revenue | 2.25B | 8.09B |
| Cost of Revenue | 1.82B | 4.87B |
| Operating Expenses | 538M | 1.84B |
| Gross Profit | 423M | 3.22B |
| EBITDA | -48M | 1.86B |
| EBIT | -92M | 1.48B |
| Interest Expense | 0 | 110M |
| Net Income | -17M | 1.09B |
| EPS | -0.16 | 7.97 |
| Fiscal Year | 2025 | 2025 |
Income Statement Analysis: The Bottom-Line Duel
This income statement comparison reveals which company operates with superior efficiency and sustainable profitability amid their sector dynamics.
Symbotic Inc. Analysis
Symbotic’s revenue surged from 250M in 2021 to 2.25B in 2025, showing strong top-line momentum. However, it consistently posts negative net income, with a slight improvement to -17M in 2025. Its gross margin holds steady near 19%, but operating losses persist, reflecting heavy R&D and SG&A costs impeding profitability despite robust growth.
Dover Corporation Analysis
Dover delivers stable revenue around 7.9B in 2021 rising to 8.1B in 2025, with a solid gross margin near 40%. Net income reached 1.09B in 2025, though it declined from a peak in 2024. EBIT margin remains healthy at 18%, signaling operational efficiency, but recent margin compression and EPS decline caution on near-term momentum.
Growth Surge vs. Margin Strength
Symbotic impresses with rapid revenue growth and improving net margin from deep losses, but remains unprofitable and heavily invested in expansion. Dover shows consistent profitability and strong margins but faces pressure on earnings growth and margin sustainability. Investors seeking growth may prefer Symbotic’s trajectory; those favoring stable profits lean toward Dover’s steady cash generation.
Financial Ratios Comparison
These vital ratios act as a diagnostic tool to expose the underlying fiscal health, valuation premiums, and capital efficiency of the companies compared below:
| Ratios | Symbotic Inc. (SYM) | Dover Corporation (DOV) |
|---|---|---|
| ROE | -7.65% | 38.79% |
| ROIC | -16.63% | 8.93% |
| P/E | -335 | 24.49 |
| P/B | 25.60 | — |
| Current Ratio | 1.08 | — |
| Quick Ratio | 0.99 | — |
| D/E | 0.14 | — |
| Debt-to-Assets | 1.32% | — |
| Interest Coverage | 0 | 12.51 |
| Asset Turnover | 0.94 | — |
| Fixed Asset Turnover | 15.92 | — |
| Payout ratio | 0% | 25.87% |
| Dividend yield | 0% | 1.06% |
| Fiscal Year | 2025 | 2025 |
Note: Dover’s current, quick, debt, and asset turnover ratios are unavailable for 2025. Symbotic’s negative P/E reflects ongoing losses, signaling caution.
Efficiency & Valuation Duel: The Vital Signs
Ratios serve as a company’s DNA, uncovering hidden risks and revealing operational excellence beneath surface numbers.
Symbotic Inc.
Symbotic shows negative profitability with ROE at -7.65% and net margin at -0.75%, signaling operational struggles. Its P/E is deeply negative, suggesting market skepticism, while P/B is stretched at 25.6. The company pays no dividend, reinvesting heavily in R&D (9.6% of revenue) to drive future growth despite current losses.
Dover Corporation
Dover delivers solid profitability, with a favorable net margin of 13.52%, though ROE and ROIC data are unavailable or neutral. The P/E of 24.5 indicates fair valuation relative to peers. It maintains a modest dividend yield of 1.06%, balancing shareholder returns with capital allocation for steady operations.
Valuation Stress vs. Profitability Stability
Symbotic’s stretched valuation and negative returns contrast sharply with Dover’s stable profitability and moderate valuation. Dover offers a safer risk-reward profile. Investors seeking operational steadiness may prefer Dover’s profile, while Symbotic fits those focused on growth potential despite current inefficiencies.
Which one offers the Superior Shareholder Reward?
I compare Symbotic Inc. (SYM) and Dover Corporation (DOV) by their shareholder reward strategies. SYM pays no dividends and has no buybacks, focusing on reinvestment for growth, evident from its negative margins but strong free cash flow per share (~7.25). DOV offers a 1.06% dividend yield, a 26% payout ratio, and consistent buybacks, supported by solid profitability (net margin ~13.5%) and robust free cash flow (~8.1 per share). DOV’s balanced dividend and buyback approach delivers steady returns, while SYM’s model assumes successful future growth. I find DOV provides a more sustainable and attractive total return profile for 2026 investors, grounded in cash flow and established distributions.
Comparative Score Analysis: The Strategic Profile
The radar chart reveals the fundamental DNA and trade-offs of Symbotic Inc. and Dover Corporation, highlighting their core financial strengths and vulnerabilities:
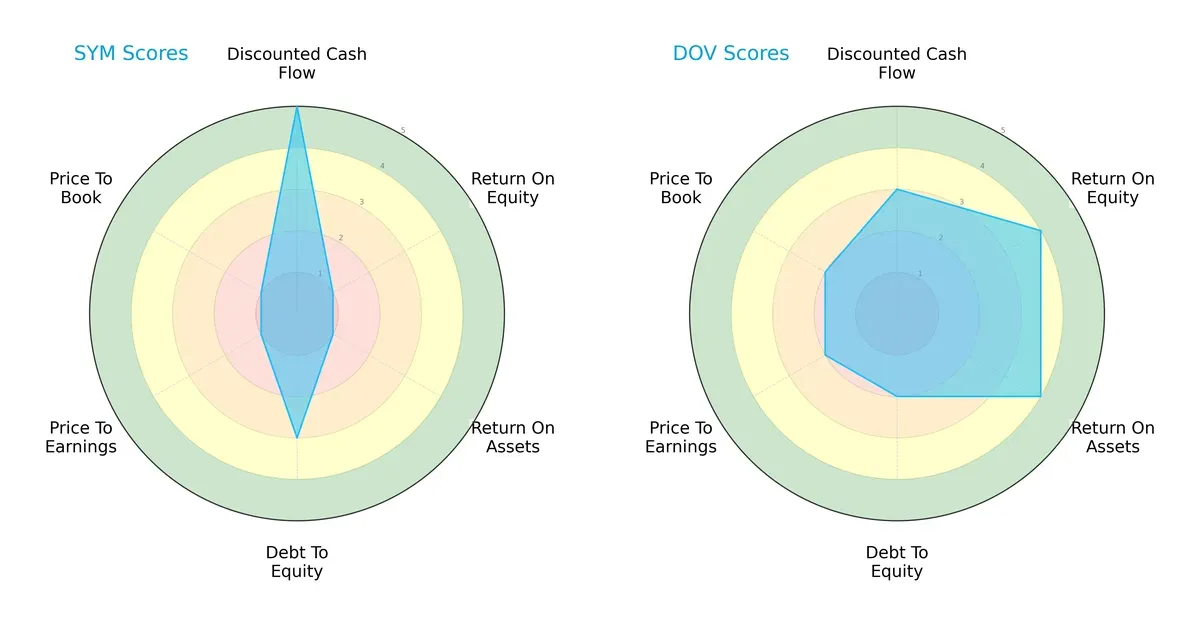
Symbotic Inc. excels in discounted cash flow valuation, scoring a strong 5, but struggles significantly with profitability metrics like ROE and ROA, both at 1. Dover shows a more balanced profile with solid ROE and ROA scores of 4, moderate debt levels, and fair valuation scores. Dover’s diversified strengths contrast with Symbotic’s reliance on valuation appeal despite weak profitability.
Bankruptcy Risk: Solvency Showdown
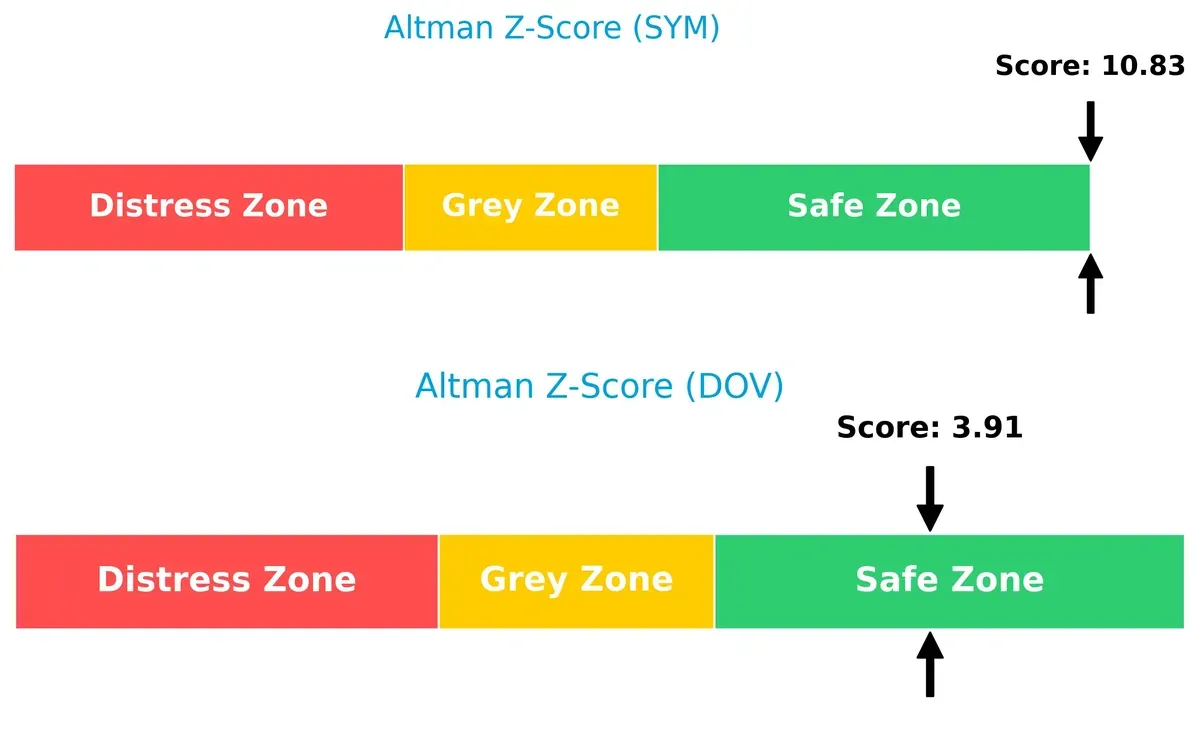
Dover’s Altman Z-Score of 3.91 surpasses Symbotic’s 10.83, both comfortably in the safe zone, but Symbotic’s extremely high score signals exceptional financial stability and low bankruptcy risk for the current cycle:
Financial Health: Quality of Operations
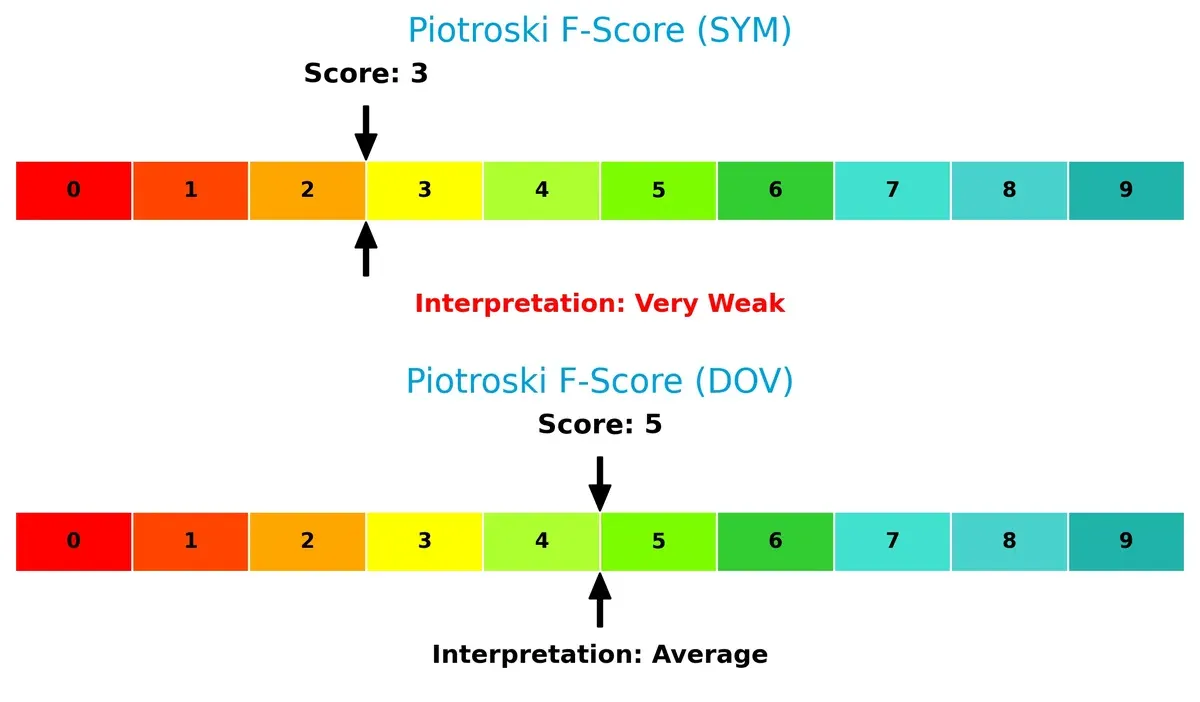
Dover’s Piotroski F-Score of 5 indicates average financial health, outperforming Symbotic’s weak score of 3. This suggests Dover maintains better internal operational quality and fewer red flags compared to Symbotic:
How are the two companies positioned?
This section dissects Symbotic Inc. and Dover Corporation’s operational DNA by comparing revenue distribution and internal strengths and weaknesses. The goal is to confront their economic moats and identify which model offers the most resilient, sustainable competitive advantage today.
Revenue Segmentation: The Strategic Mix
This visual comparison dissects how Symbotic Inc. and Dover Corporation diversify their income streams and reveals where their primary sector bets lie:
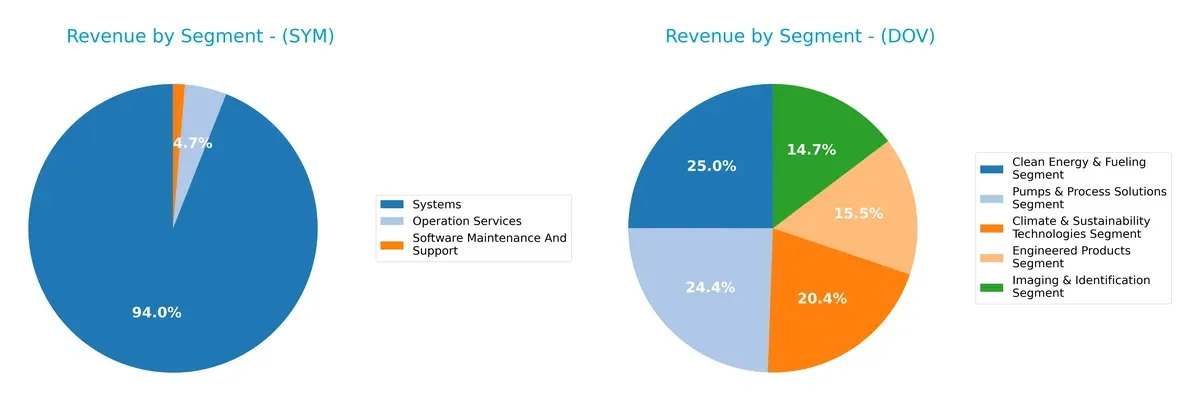
Symbotic leans heavily on Systems, generating $2.12B in 2025, which dwarfs its $105M Operation Services and $30M Software Maintenance revenues. Dover showcases a balanced portfolio, with five segments each contributing around $1.1B to $1.9B in 2024. Symbotic’s concentration in Systems signals reliance on infrastructure dominance but raises concentration risk. Dover’s diversified mix reduces risk and anchors its ecosystem across industrial and sustainability sectors.
Strengths and Weaknesses Comparison
This table compares the strengths and weaknesses of Symbotic Inc. and Dover Corporation based on key financial and operational metrics:
Symbotic Inc. Strengths
- Low debt-to-assets ratio at 1.32%
- Favorable debt-to-equity at 0.14
- High fixed asset turnover at 15.92
- Large US market presence with $2.2B revenue
- Growing systems segment revenue at $2.1B
Dover Corporation Strengths
- Diverse product segments with five strong revenue streams
- Favorable net margin at 13.52%
- Strong interest coverage ratio at 13.52
- Extensive global footprint with significant US, Europe, Asia sales
- Favorable price-to-book ratio at 0
Symbotic Inc. Weaknesses
- Negative net margin of -0.75%
- Negative ROE and ROIC at -7.65% and -16.63%
- High weighted average cost of capital (13.84%)
- Unfavorable interest coverage at zero
- High price-to-book ratio at 25.6
- No dividend yield
Dover Corporation Weaknesses
- Zero current and quick ratios indicating liquidity concerns
- ROE and ROIC at zero
- Unfavorable asset and fixed asset turnover ratios
- Neutral dividend yield at 1.06%
- Slightly unfavorable global ratios opinion
Symbotic’s strengths lie in conservative leverage and operational asset efficiency, but profitability and liquidity challenges stand out. Dover shows solid profitability and diversification but faces liquidity and efficiency headwinds. Both companies exhibit slightly unfavorable overall financial ratios, highlighting areas for strategic focus.
The Moat Duel: Analyzing Competitive Defensibility
Only a structural moat can shield long-term profits from relentless competitive erosion and preserve shareholder value over market cycles:
Symbotic Inc.: Innovation-Driven Automation Moat
Symbotic’s primary advantage lies in its proprietary warehouse automation system, creating switching costs through integration. Despite a negative ROIC trend, its 25% revenue growth signals potential moat deepening if it scales efficiently in 2026.
Dover Corporation: Diversified Industrial Legacy Moat
Dover’s moat emerges from broad market reach and product diversity, contrasting Symbotic’s niche focus. Strong margins and scale underpin its moat, though recent EBIT declines hint at emerging operational headwinds; expansion in clean energy tech offers upside.
Moat Innovation vs. Industrial Scale: Who Defends Best?
Symbotic’s innovation moat is promising but unproven in sustained profitability, with declining ROIC a red flag. Dover’s entrenched scale and margin strength offer a wider moat, better suited to defend market share amid economic shifts.
Which stock offers better returns?
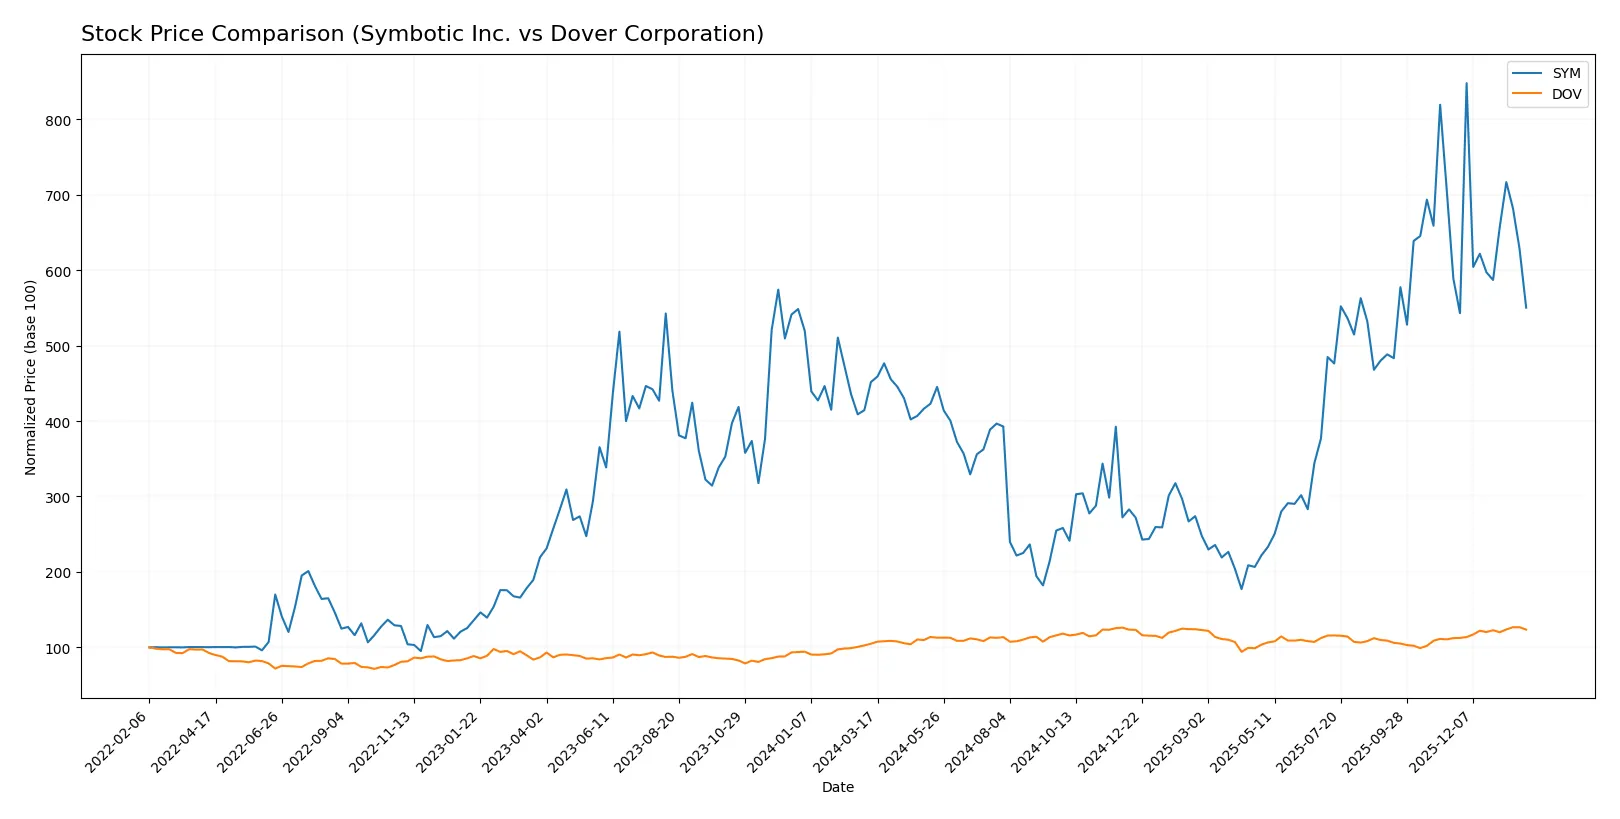
Over the past year, both Symbotic Inc. and Dover Corporation showed strong upward price movements, with Symbotic decelerating recently while Dover accelerated its gains.
Trend Comparison
Symbotic Inc. recorded a 21.85% bullish price change over 12 months, with deceleration and a high volatility level (15.66 std deviation). Its price ranged from 17.5 to 83.77.
Dover Corporation posted a 17.81% bullish price change in the same period, showing acceleration and moderate volatility (11.33 std deviation). Its price moved between 153.55 and 206.71.
Symbotic’s overall return exceeds Dover’s, but Dover shows stronger recent momentum with accelerating gains.
Target Prices
Analysts present a clear consensus on target prices for Symbotic Inc. and Dover Corporation.
| Company | Target Low | Target High | Consensus |
|---|---|---|---|
| Symbotic Inc. | 42 | 83 | 65.56 |
| Dover Corporation | 195 | 256 | 221.38 |
The consensus target price for Symbotic sits about 21% above its current price of $54.37, signaling moderate upside. Dover’s consensus is roughly 10% higher than its $201.49 trading price, indicating steady analyst confidence.

Don’t Let Luck Decide Your Entry Point
Optimize your entry points with our advanced ProRealTime indicators. You’ll get efficient buy signals with precise price targets for maximum performance. Start outperforming now!
How do institutions grade them?
Symbotic Inc. Grades
The following table summarizes recent institutional grades for Symbotic Inc.:
| Grading Company | Action | New Grade | Date |
|---|---|---|---|
| Barclays | Maintain | Underweight | 2026-01-12 |
| Goldman Sachs | Downgrade | Sell | 2025-12-02 |
| Barclays | Maintain | Underweight | 2025-11-26 |
| Baird | Maintain | Neutral | 2025-11-26 |
| DA Davidson | Maintain | Neutral | 2025-11-25 |
| Citigroup | Maintain | Buy | 2025-11-25 |
| Needham | Maintain | Buy | 2025-11-25 |
| Craig-Hallum | Upgrade | Buy | 2025-11-25 |
| Northland Capital Markets | Maintain | Outperform | 2025-11-25 |
| Cantor Fitzgerald | Maintain | Overweight | 2025-11-25 |
Dover Corporation Grades
The following table summarizes recent institutional grades for Dover Corporation:
| Grading Company | Action | New Grade | Date |
|---|---|---|---|
| JP Morgan | Maintain | Overweight | 2026-01-30 |
| Wells Fargo | Maintain | Equal Weight | 2026-01-30 |
| RBC Capital | Maintain | Sector Perform | 2026-01-30 |
| Oppenheimer | Maintain | Outperform | 2026-01-26 |
| JP Morgan | Maintain | Overweight | 2026-01-16 |
| Barclays | Maintain | Equal Weight | 2026-01-07 |
| Wells Fargo | Maintain | Equal Weight | 2026-01-07 |
| UBS | Upgrade | Buy | 2026-01-05 |
| Wells Fargo | Maintain | Equal Weight | 2025-12-15 |
| Oppenheimer | Maintain | Outperform | 2025-11-14 |
Which company has the best grades?
Dover Corporation consistently receives higher grades such as Overweight and Outperform from major firms, indicating stronger market confidence. Symbotic Inc. shows a mixed profile with several Underweight and Sell ratings, which may signal caution for investors.
Risks specific to each company
The following categories identify the critical pressure points and systemic threats facing both firms in the 2026 market environment:
1. Market & Competition
Symbotic Inc.
- Faces intense competition with high volatility and negative margins, signaling challenges in scaling and profitability.
Dover Corporation
- Operates diversified industrial segments with stable margins but faces pressure from automation and clean energy shifts.
2. Capital Structure & Debt
Symbotic Inc.
- Maintains low debt levels (D/E 0.14) but struggles with zero interest coverage, indicating weak earnings to cover debt costs.
Dover Corporation
- Holds favorable debt metrics with strong interest coverage (13.52), reflecting solid capacity to meet obligations.
3. Stock Volatility
Symbotic Inc.
- High beta (2.14) and wide trading range expose investors to significant price fluctuations and risk.
Dover Corporation
- Lower beta (1.31) and less volatile price range provide a more stable investment profile.
4. Regulatory & Legal
Symbotic Inc.
- Emerging tech sector exposes Symbotic to evolving regulations around automation and data security.
Dover Corporation
- Faces complex compliance demands across global industrial and clean energy markets.
5. Supply Chain & Operations
Symbotic Inc.
- Relies on integrated warehouse automation, vulnerable to hardware supply delays and tech disruptions.
Dover Corporation
- Diverse operations and global footprint reduce supply chain concentration risks but increase complexity.
6. ESG & Climate Transition
Symbotic Inc.
- Limited ESG history; automation tech may align with sustainability but lacks clear climate transition strategy.
Dover Corporation
- Active in clean energy tech and sustainability segments, facing both opportunity and regulatory scrutiny.
7. Geopolitical Exposure
Symbotic Inc.
- Primarily US-focused; less exposed to geopolitical risks but limited global diversification.
Dover Corporation
- Global operations increase exposure to trade tensions and geopolitical instability but also offer market diversification.
Which company shows a better risk-adjusted profile?
Symbotic’s highest risk lies in its negative profitability and high stock volatility, undermining financial stability. Dover’s main concern is operational complexity amid shifting regulatory landscapes. Dover’s stronger debt coverage and stable margins offer a more balanced risk-adjusted profile. Symbotic’s 2.14 beta and negative ROIC worry me most, while Dover’s solid interest coverage and diversification anchor its relative safety.
Final Verdict: Which stock to choose?
Symbotic Inc. wields a clear superpower in rapid revenue expansion and innovation-driven growth, positioning itself as a potential disruptor. Its point of vigilance lies in persistent value destruction and weak profitability metrics, signaling risk. It fits portfolios chasing aggressive growth and willing to endure volatility.
Dover Corporation boasts a robust strategic moat in stable cash flow generation and diversified industrial operations. Its financial profile offers better safety and resilience than Symbotic, appealing to investors favoring steady income and capital preservation. It suits Growth at a Reasonable Price (GARP) portfolios.
If you prioritize high-growth potential and can tolerate operational and profitability uncertainties, Symbotic emerges as the compelling choice due to its innovation momentum. However, if you seek better stability and consistent cash flow, Dover offers superior risk-adjusted fundamentals and a proven track record.
Disclaimer: Investment carries a risk of loss of initial capital. The past performance is not a reliable indicator of future results. Be sure to understand risks before making an investment decision.
Go Further
I encourage you to read the complete analyses of Symbotic Inc. and Dover Corporation to enhance your investment decisions: