Home > Comparison > Industrials > ROP vs DOV
The strategic rivalry between Roper Technologies, Inc. and Dover Corporation defines the trajectory of the industrial machinery sector. Roper excels as a diversified software-driven industrial innovator, while Dover operates as a broad-based equipment and components manufacturer. Their competition centers on innovation-led growth versus traditional industrial scale. This analysis will assess which company presents a superior risk-adjusted opportunity for diversified portfolios navigating a complex macroeconomic environment.
Table of contents
Companies Overview
Roper Technologies and Dover Corporation stand as pivotal players within the industrial machinery sector.
Roper Technologies, Inc.: Diversified Software and Engineered Products Leader
Roper Technologies dominates by designing software and engineered solutions spanning diagnostics, supply chain, and cloud-based analytics. Its revenue engine thrives on specialized software for multiple industries including healthcare and insurance. In 2026, Roper’s strategic focus emphasizes expanding cloud-based capabilities and integrating data analytics to enhance operational efficiency and customer value.
Dover Corporation: Equipment and Component Solutions Specialist
Dover Corporation excels in providing equipment, components, and digital solutions across diverse end-markets like industrial automation and clean energy. Its core revenues derive from engineered products and aftermarket services. For 2026, Dover prioritizes innovation in clean energy fueling and climate technologies, reinforcing its footprint in sustainability and industrial automation sectors.
Strategic Collision: Similarities & Divergences
Both companies anchor their strength in engineered industrial solutions but diverge in business philosophy—Roper leans on a software-driven, data-centric model while Dover integrates hardware with digital services. They compete primarily in industrial automation and specialty equipment markets. Roper’s growth hinges on scalable software platforms; Dover’s on diversified industrial hardware. Their distinct models shape contrasting risk and growth profiles.
Income Statement Comparison
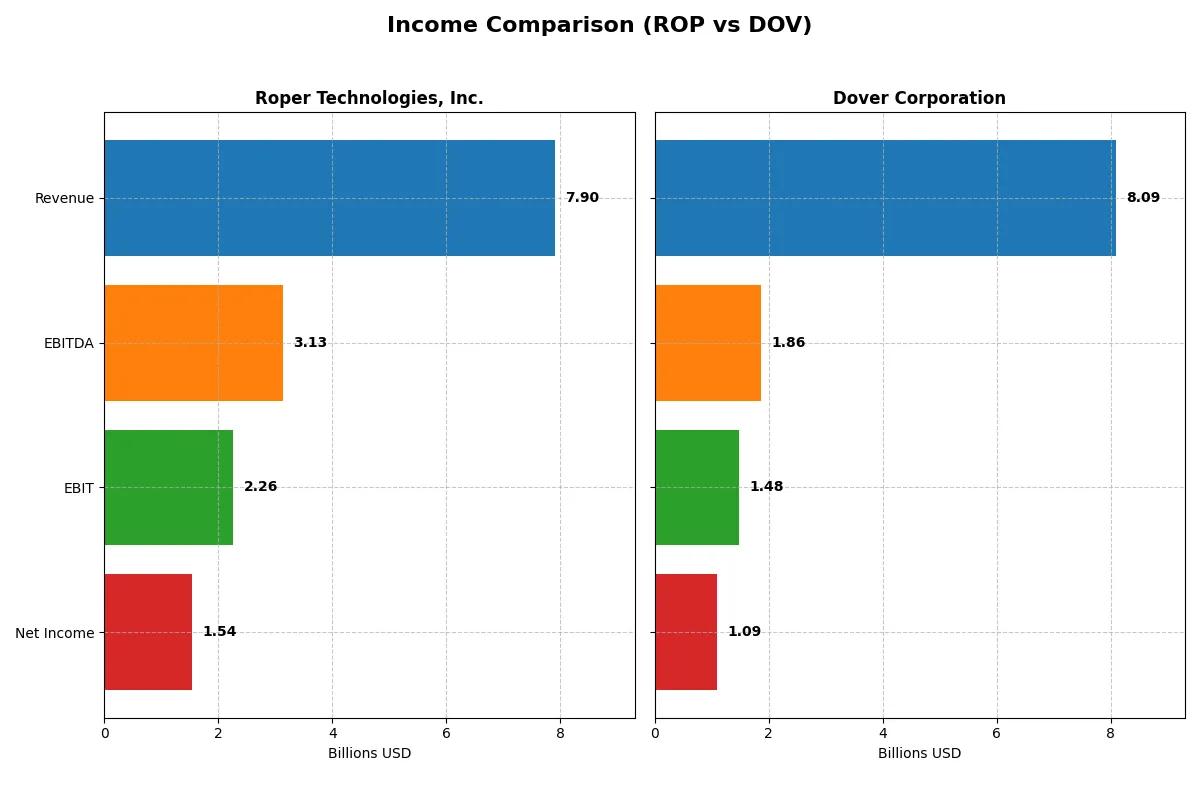
This data dissects the core profitability and scalability of both corporate engines to reveal who dominates the bottom line:
| Metric | Roper Technologies, Inc. (ROP) | Dover Corporation (DOV) |
|---|---|---|
| Revenue | 7.90B | 8.09B |
| Cost of Revenue | 2.43B | 4.87B |
| Operating Expenses | 3.24B | 1.84B |
| Gross Profit | 5.47B | 3.22B |
| EBITDA | 3.13B | 1.86B |
| EBIT | 2.26B | 1.48B |
| Interest Expense | 325M | 110M |
| Net Income | 1.54B | 1.09B |
| EPS | 14.31 | 7.97 |
| Fiscal Year | 2025 | 2025 |
Income Statement Analysis: The Bottom-Line Duel
This income statement comparison reveals which company operates with superior efficiency and sustainable profit generation in a competitive market.
Roper Technologies, Inc. Analysis
Roper Technologies delivers strong revenue growth, up 12.3% year-over-year to 7.9B in 2025, with net income near 1.54B. Its gross margin remains robust at 69.2%, sustaining a healthy net margin of 19.4%. Despite slight net margin contraction, Roper’s consistent EBIT margin of 28.6% signals operational resilience and high capital efficiency.
Dover Corporation Analysis
Dover Corporation posts 2025 revenue of 8.1B, growing modestly by 4.5%, but net income falls sharply to 1.09B with a net margin of 13.5%. Its gross margin of 39.8% lags behind Roper, and EBIT margin at 18.3% declined notably. Dover’s earnings show volatility, reflecting operational challenges and weaker momentum compared to Roper.
Margin Strength vs. Revenue Scale
Roper dominates with superior margins and stronger profitability growth, despite Dover’s slightly higher top-line. Dover’s declining net income and margins highlight operational inefficiencies. For investors prioritizing earnings quality and margin power, Roper presents a more attractive profile due to its consistent income growth and robust profitability.
Financial Ratios Comparison
These vital ratios act as a diagnostic tool to expose underlying fiscal health, valuation premiums, and capital efficiency for these two industrial conglomerates:
| Ratios | Roper Technologies, Inc. (ROP) | Dover Corporation (DOV) |
|---|---|---|
| ROE | 8.2% (2024) | 38.8% (2024) |
| ROIC | 5.5% (2024) | 8.9% (2024) |
| P/E | 35.9 (2024) | 9.6 (2024) |
| P/B | 2.95 (2024) | 3.72 (2024) |
| Current Ratio | 0.40 (2024) | 2.04 (2024) |
| Quick Ratio | 0.37 (2024) | 1.52 (2024) |
| D/E | 0.41 (2024) | 0.45 (2024) |
| Debt-to-Assets | 24.5% (2024) | 25.2% (2024) |
| Interest Coverage | 7.7x (2024) | 9.2x (2024) |
| Asset Turnover | 0.22 (2024) | 0.62 (2024) |
| Fixed Asset Turnover | 47.0 (2024) | 7.8 (2024) |
| Payout Ratio | 20.8% (2024) | 10.5% (2024) |
| Dividend Yield | 0.58% (2024) | 1.10% (2024) |
| Fiscal Year | 2024 | 2024 |
Efficiency & Valuation Duel: The Vital Signs
Financial ratios act as a company’s DNA, revealing hidden risks and operational excellence that raw numbers alone cannot show.
Roper Technologies, Inc.
Roper’s net margin at 19.44% signals solid profitability, yet its P/E at 31.06 marks the stock as expensive compared to sector norms. Return on equity and invested capital show weaknesses, undermining operational efficiency. The modest 0.74% dividend yield suggests limited shareholder return, likely favoring reinvestment in growth or innovation.
Dover Corporation
Dover posts a favorable 13.52% net margin with a more reasonable P/E of 24.49, indicating fair valuation. Return ratios remain unavailable or weak, but interest coverage at 13.52 is robust. The 1.06% dividend yield and neutral payout metrics imply balanced capital allocation between shareholder returns and business reinvestment.
Premium Valuation vs. Balanced Operational Metrics
Roper trades at a premium with strong margins but suffers from low returns on equity and reinvestment clarity. Dover offers a more balanced profile with fair valuation and stronger interest coverage. Investors seeking operational safety might prefer Dover, while those tolerating valuation risk may consider Roper’s margin strength.
Which one offers the Superior Shareholder Reward?
I compare Roper Technologies (ROP) and Dover Corporation (DOV) based on their dividend yields, payout ratios, and buyback intensity. ROP yields 0.74% with a payout ratio near 23%, supported by strong free cash flow (FCF) coverage above 6x. Dover offers a higher yield of 1.06% but with a riskier payout ratio around 26%, and weaker FCF coverage near 2.7x. Both deploy buybacks, but ROP’s free cash flow per share (~$23.25) and capital efficiency suggest more robust buyback capacity. DOV’s reinvestment is hampered by lower margins and volatile cash flow ratios. I see ROP’s distribution model as more sustainable and value-accretive. For long-term total return in 2026, I favor Roper Technologies.
Comparative Score Analysis: The Strategic Profile
The radar chart reveals the fundamental DNA and trade-offs of Roper Technologies, Inc. and Dover Corporation, highlighting their financial strengths and weaknesses:
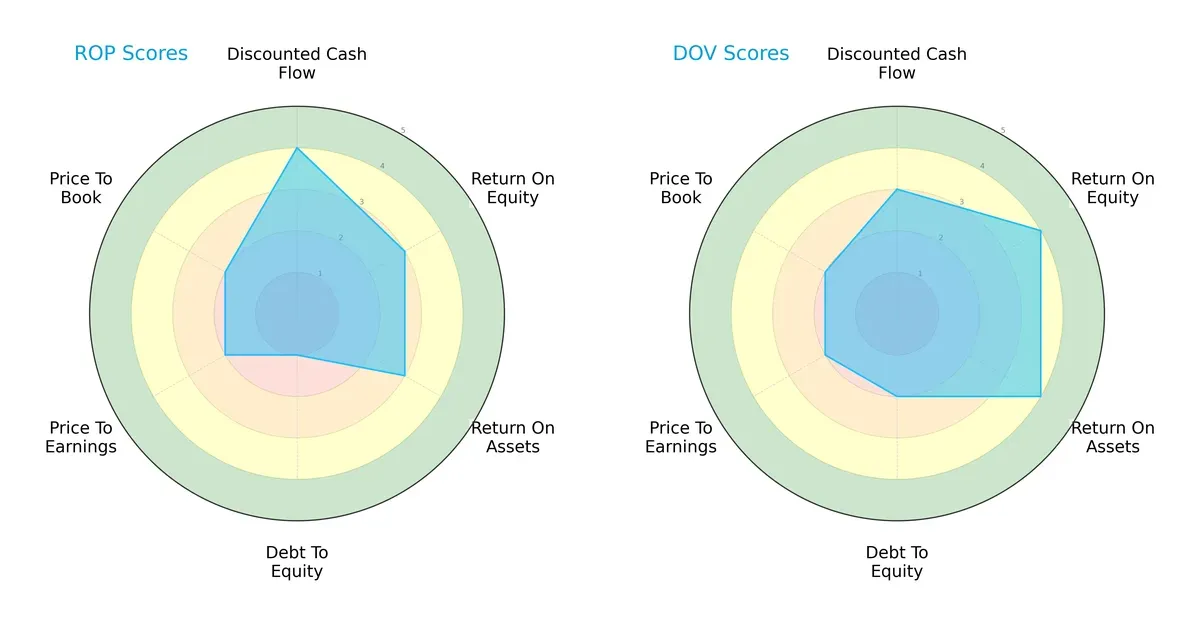
Roper excels in discounted cash flow with a score of 4, but suffers from a very unfavorable debt-to-equity score of 1, signaling high leverage risk. Dover shows stronger profitability metrics with ROE and ROA scores of 4 each and a more moderate debt profile at 2. Both have similar overall scores of 3, but Dover offers a more balanced financial profile, while Roper relies heavily on cash flow strength despite its debt concerns.
Bankruptcy Risk: Solvency Showdown
The Altman Z-Score gap between Roper (2.7, grey zone) and Dover (3.9, safe zone) signals differing bankruptcy risks:
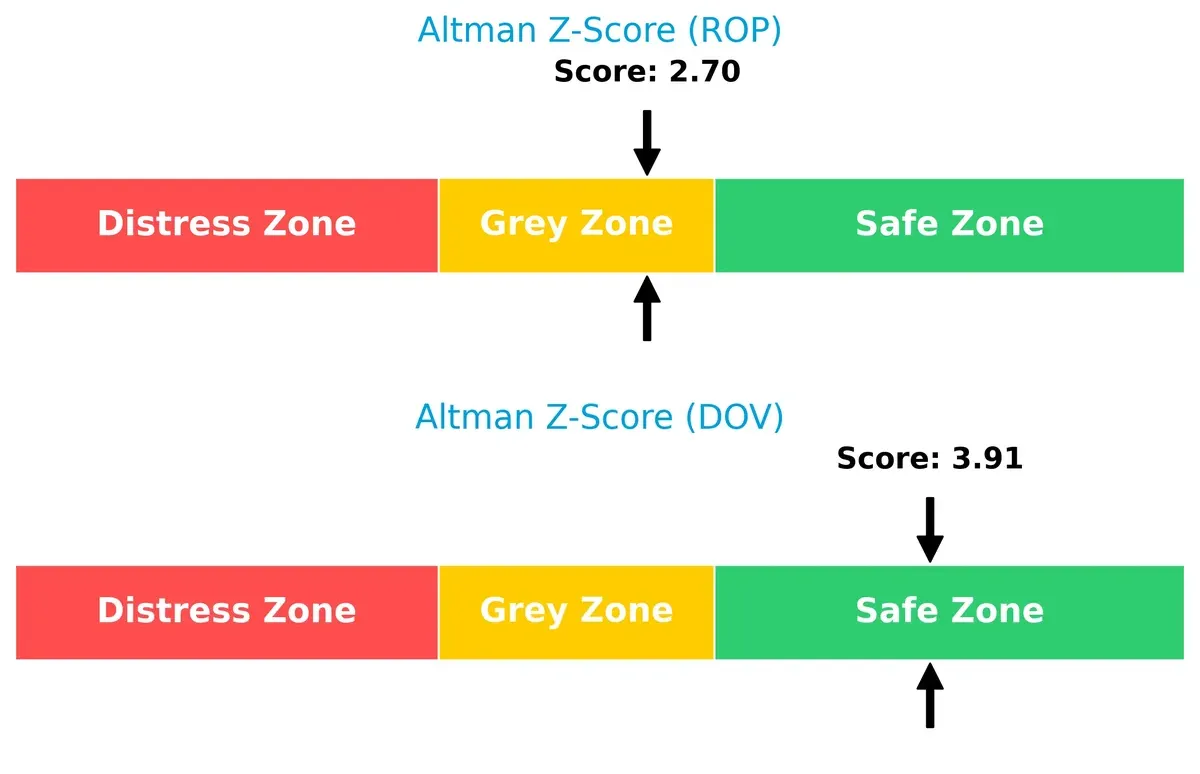
Dover’s score suggests solid solvency and low bankruptcy risk in the current cycle. Roper’s grey zone score warns of moderate financial distress risk, likely due to its higher leverage, demanding cautious monitoring.
Financial Health: Quality of Operations
Piotroski F-Scores reveal operational quality and financial health contrasts between Roper (9, very strong) and Dover (5, average):
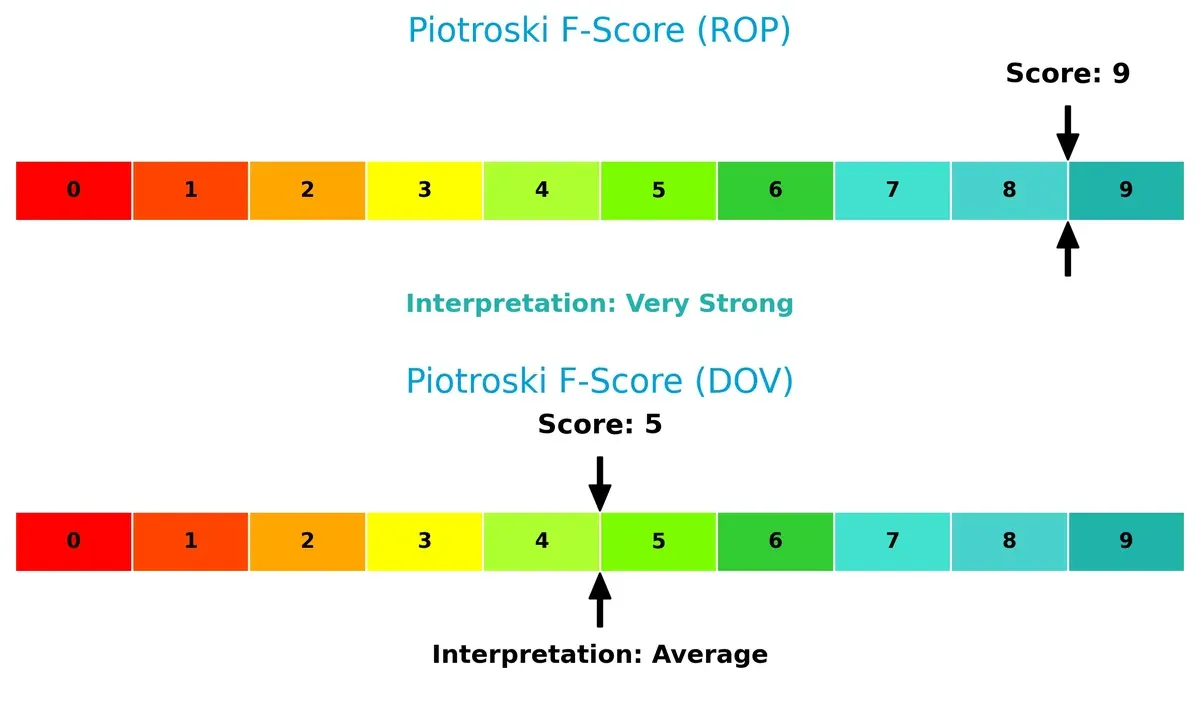
Roper demonstrates peak financial health, excelling in profitability, liquidity, and efficiency metrics. Dover’s average score indicates potential internal red flags and room for improvement in operational robustness. This divergence highlights Roper’s superior internal financial discipline despite its leverage challenges.
How are the two companies positioned?
This section dissects the operational DNA of ROP and DOV by comparing their revenue distribution by segment and internal dynamics. The goal is to confront their economic moats to reveal which model offers the most resilient, sustainable competitive advantage today.
Revenue Segmentation: The Strategic Mix
This visual comparison dissects how Roper Technologies and Dover Corporation diversify their income streams and where their primary sector bets lie:
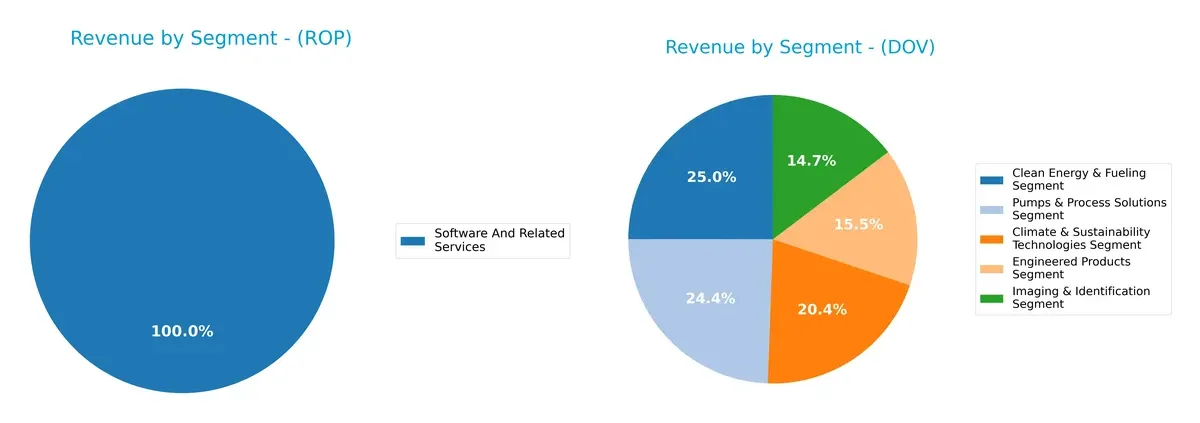
Roper Technologies anchors its revenue heavily in Software and Related Services, with $10.7B in 2024, showing a dominant tech-driven focus. Dover Corporation, by contrast, exhibits a balanced mix across five segments, each near $1.2B to $1.9B, reflecting diversified industrial exposure. Roper’s reliance on software signals ecosystem lock-in and high margin potential, while Dover’s spread reduces concentration risk but may limit scale advantages.
Strengths and Weaknesses Comparison
This table compares the Strengths and Weaknesses of Roper Technologies, Inc. and Dover Corporation:
ROP Strengths
- Strong net margin at 19.44%
- Favorable debt-to-equity and debt-to-assets ratios
- Solid interest coverage at 6.96x
DOV Strengths
- Favorable net margin at 13.52%
- Strong interest coverage at 13.52x
- Favorable debt-to-equity and debt-to-assets ratios
ROP Weaknesses
- Unfavorable ROE and ROIC at 0%
- Poor liquidity ratios: current and quick ratio at 0
- High P/E ratio at 31.06 indicates expensive valuation
DOV Weaknesses
- Unfavorable ROE and ROIC at 0%
- Weak liquidity ratios: current and quick ratio at 0
- Dividend yield neutral at 1.06% with moderate P/E at 24.49
Both companies share challenges in profitability metrics like ROE and ROIC and liquidity concerns. Roper shows higher profitability but at a more expensive valuation. Dover’s stronger interest coverage may support its financial resilience.
The Moat Duel: Analyzing Competitive Defensibility
A structural moat is the only reliable barrier protecting long-term profits from relentless competitive pressure and market erosion:
Roper Technologies, Inc.: Diversified Intangible Assets Moat
Roper’s moat stems from its vast portfolio of specialized software and engineered products. This supports strong gross margins (~69%) and margin stability. Expanding cloud-based solutions in 2026 could deepen its intangible asset moat but rising opex pressures margin growth.
Dover Corporation: Broad Industrial Equipment Moat
Dover relies on diverse industrial equipment and service segments, contrasting Roper’s software focus. Its moat manifests in steady gross margins (~40%) and global reach. However, slower revenue growth and margin erosion threaten moat durability amid evolving clean energy demands.
Margin Strength vs. Industrial Scale: The Moat Showdown
Roper’s intangible asset-driven moat delivers higher margins and faster revenue growth than Dover’s industrial equipment moat. Despite both facing margin pressures, Roper’s software edge better equips it to defend and expand market share in 2026.
Which stock offers better returns?
The stock prices of Roper Technologies, Inc. and Dover Corporation reveal contrasting dynamics over the past 12 months, marked by divergent trends and distinct volume patterns.
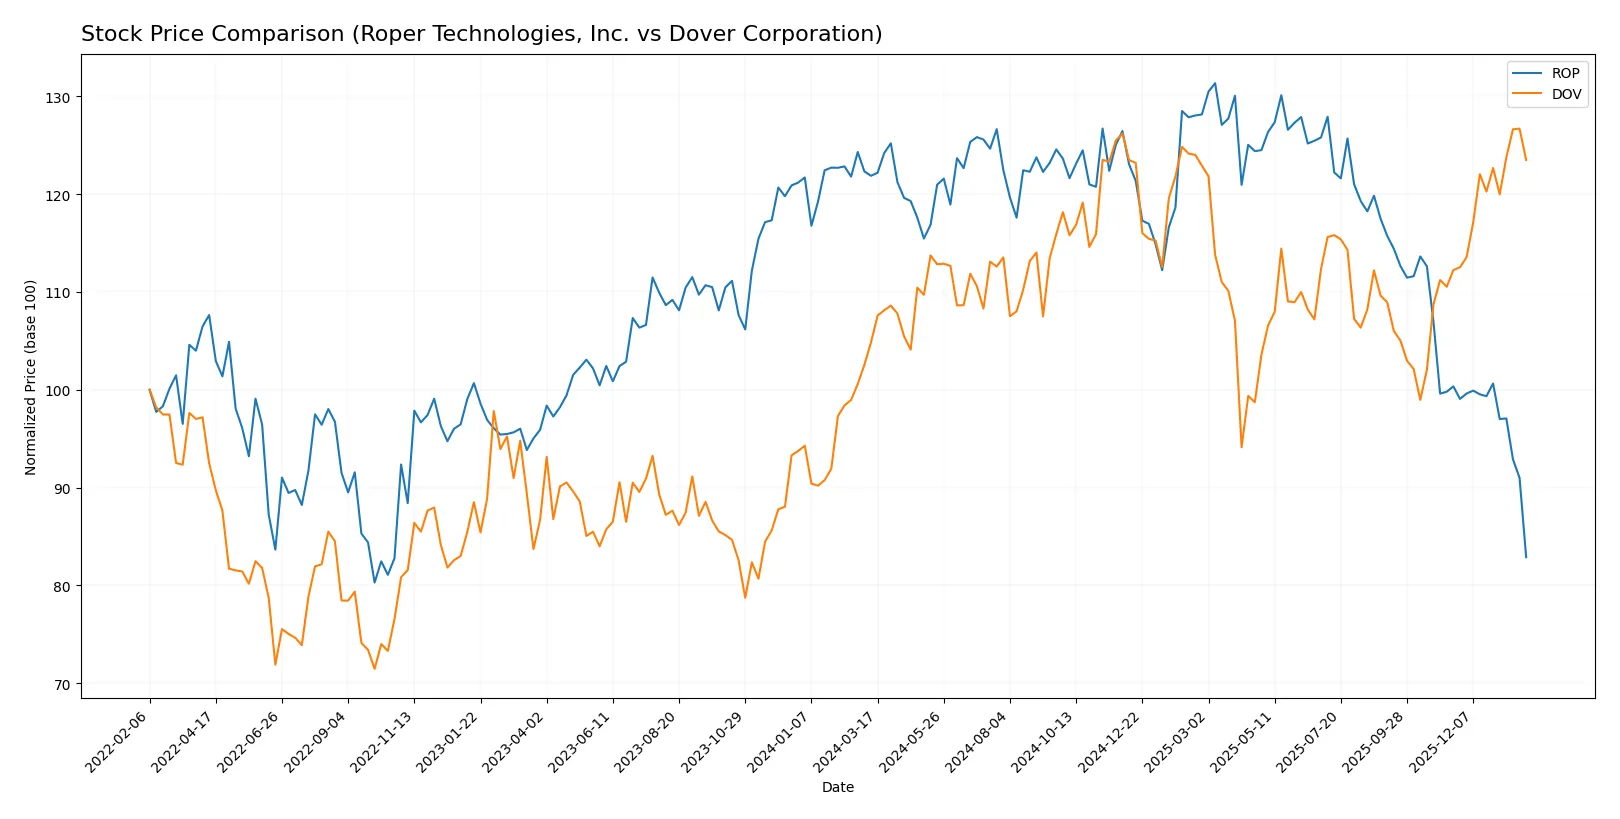
Trend Comparison
Roper Technologies, Inc. experienced a bearish trend with a 32.0% price decline over the past year. The trend shows deceleration, hitting a high of 588.38 and a low of 371.23, accompanied by high volatility (44.8% std deviation).
Dover Corporation posted a bullish trend with a 17.81% price increase over the past year. The trend accelerated, reaching a high of 206.71 and a low of 153.55, with moderate volatility (11.33% std deviation).
Dover’s stock outperformed Roper’s by a wide margin, delivering positive returns amid accelerating momentum, while Roper’s share price declined significantly with decelerating bearish pressure.
Target Prices
Analysts present a bullish consensus for both Roper Technologies, Inc. and Dover Corporation, indicating upside potential.
| Company | Target Low | Target High | Consensus |
|---|---|---|---|
| Roper Technologies, Inc. | 365 | 575 | 475.5 |
| Dover Corporation | 195 | 256 | 221.38 |
The target consensus for Roper sits roughly 28% above its current price of 371, reflecting strong growth expectations. Dover’s consensus target exceeds the current 201 by about 10%, signaling moderate upside potential.

Don’t Let Luck Decide Your Entry Point
Optimize your entry points with our advanced ProRealTime indicators. You’ll get efficient buy signals with precise price targets for maximum performance. Start outperforming now!
How do institutions grade them?
I compare the latest institutional grades for Roper Technologies, Inc. and Dover Corporation below:
Roper Technologies, Inc. Grades
The table summarizes recent grade changes and maintenances by key analysts for Roper Technologies:
| Grading Company | Action | New Grade | Date |
|---|---|---|---|
| Goldman Sachs | Maintain | Neutral | 2026-01-29 |
| Argus Research | Downgrade | Hold | 2026-01-28 |
| Truist Securities | Maintain | Buy | 2026-01-28 |
| Mizuho | Maintain | Underperform | 2026-01-28 |
| Oppenheimer | Downgrade | Perform | 2026-01-28 |
| RBC Capital | Maintain | Sector Perform | 2026-01-28 |
| Barclays | Maintain | Underweight | 2026-01-28 |
| Stifel | Downgrade | Hold | 2026-01-28 |
| Citigroup | Maintain | Buy | 2026-01-28 |
| JP Morgan | Maintain | Underweight | 2026-01-28 |
Dover Corporation Grades
Below is a summary of recent analyst ratings and changes for Dover Corporation:
| Grading Company | Action | New Grade | Date |
|---|---|---|---|
| JP Morgan | Maintain | Overweight | 2026-01-30 |
| Wells Fargo | Maintain | Equal Weight | 2026-01-30 |
| RBC Capital | Maintain | Sector Perform | 2026-01-30 |
| Oppenheimer | Maintain | Outperform | 2026-01-26 |
| JP Morgan | Maintain | Overweight | 2026-01-16 |
| Barclays | Maintain | Equal Weight | 2026-01-07 |
| Wells Fargo | Maintain | Equal Weight | 2026-01-07 |
| UBS | Upgrade | Buy | 2026-01-05 |
| Wells Fargo | Maintain | Equal Weight | 2025-12-15 |
| Oppenheimer | Maintain | Outperform | 2025-11-14 |
Which company has the best grades?
Dover Corporation consistently receives higher ratings, including multiple Overweight and Outperform grades. Roper Technologies shows a mixed picture with several Hold and Underweight ratings. Investors may perceive Dover as having stronger institutional confidence.
Risks specific to each company
The following categories identify the critical pressure points and systemic threats facing both firms in the 2026 market environment:
1. Market & Competition
Roper Technologies, Inc.
- Diversified software and engineered products face intense tech innovation and sector disruption risks.
Dover Corporation
- Broad industrial portfolio exposed to cyclical demand swings and competitive pressures in machinery markets.
2. Capital Structure & Debt
Roper Technologies, Inc.
- Shows very favorable debt-to-assets and interest coverage but flagged for unfavorable debt-to-equity ratio.
Dover Corporation
- Maintains moderate debt-to-equity risk with strong interest coverage, indicating safer leverage management.
3. Stock Volatility
Roper Technologies, Inc.
- Beta near 0.94 indicates slightly below-market volatility, offering more stability amid market fluctuations.
Dover Corporation
- Beta at 1.31 signals higher stock volatility, increasing risk during market downturns or shocks.
4. Regulatory & Legal
Roper Technologies, Inc.
- Exposed to regulatory shifts in software, healthcare, and utility sectors, requiring constant compliance vigilance.
Dover Corporation
- Faces regulatory risks across clean energy, aerospace, and industrial automation sectors with evolving standards.
5. Supply Chain & Operations
Roper Technologies, Inc.
- Complex global operations reliant on software and precision instruments face supply chain disruptions and tech integration challenges.
Dover Corporation
- Diverse manufacturing footprint with exposure to raw material price volatility and operational bottlenecks.
6. ESG & Climate Transition
Roper Technologies, Inc.
- Moderate ESG risks with growing pressure to enhance sustainability in software and engineering product lines.
Dover Corporation
- Higher exposure via climate technologies and clean energy segments; transition risks and opportunities are significant.
7. Geopolitical Exposure
Roper Technologies, Inc.
- Primarily US-based but global tech exposure subjects it to international trade policies and geopolitical tensions.
Dover Corporation
- Global industrial supply chains and energy segments increase sensitivity to geopolitical instability and trade disputes.
Which company shows a better risk-adjusted profile?
Dover Corporation’s superior Altman Z-Score (3.91, safe zone) and moderate leverage mark it as financially steadier. Roper’s higher stock stability (beta 0.94) and strong Piotroski score (9) reflect operational strength but debt concerns temper risk appetite. Dover balances risk better in 2026’s volatile industrial landscape.
Final Verdict: Which stock to choose?
Roper Technologies, Inc. (ROP) demonstrates a superpower in generating strong gross and EBIT margins, reflecting operational excellence and pricing power. However, its weak liquidity and high intangible assets pose points of vigilance. ROP suits investors chasing aggressive growth with tolerance for balance sheet nuances.
Dover Corporation (DOV) benefits from a robust financial moat supported by solid returns on assets and equity, alongside superior interest coverage. Its more conservative balance sheet and recent bullish price trend offer better stability than ROP. DOV fits well in a GARP portfolio seeking balanced growth and risk control.
If you prioritize high-margin operational efficiency and growth potential, ROP is the compelling choice due to its superior profitability metrics despite liquidity concerns. However, if you seek better financial stability and a steadier price momentum, DOV offers superior risk management and a healthier balance sheet, commanding a premium in defensive positioning.
Disclaimer: Investment carries a risk of loss of initial capital. The past performance is not a reliable indicator of future results. Be sure to understand risks before making an investment decision.
Go Further
I encourage you to read the complete analyses of Roper Technologies, Inc. and Dover Corporation to enhance your investment decisions: