Home > Comparison > Industrials > ROK vs DOV
The strategic rivalry between Rockwell Automation, Inc. and Dover Corporation shapes the industrial machinery sector’s evolution. Rockwell Automation operates as a technology-driven industrial automation leader, focusing on software and lifecycle services. Dover Corporation, by contrast, delivers diversified engineered products across multiple industrial end-markets. This analysis examines their differing operational models and competitive moats to identify which offers superior risk-adjusted returns within a diversified portfolio context.

Table of contents
Companies Overview
Rockwell Automation and Dover Corporation stand as key players in the industrial machinery sector, shaping automation and equipment markets globally.
Rockwell Automation, Inc.: Industrial Automation Leader
Rockwell Automation commands the industrial automation market with hardware, software, and services. Its core revenue arises from Intelligent Devices, Software & Control, and Lifecycle Services segments. In 2026, it focuses on digital transformation solutions to boost operational efficiency across discrete, hybrid, and process industries, maintaining a stronghold in automation innovation.
Dover Corporation: Diversified Industrial Equipment Provider
Dover Corporation excels in providing specialized equipment and components across multiple industrial end-markets. Revenue streams derive from Engineered Products, Clean Energy & Fueling, Imaging & Identification, Pumps & Process Solutions, and Climate Technologies. Dover prioritizes expanding clean energy solutions and enhancing its software and service offerings to support industrial automation and sustainability.
Strategic Collision: Similarities & Divergences
Both companies emphasize industrial automation but diverge in scope and approach. Rockwell leans on software-driven digital transformation, while Dover adopts a diversified product portfolio with a strong clean energy push. Their primary battleground is the automation software versus equipment integration market. Investors face distinct profiles: Rockwell offers a focused automation play; Dover provides broad industrial exposure with sustainability tilt.
Income Statement Comparison
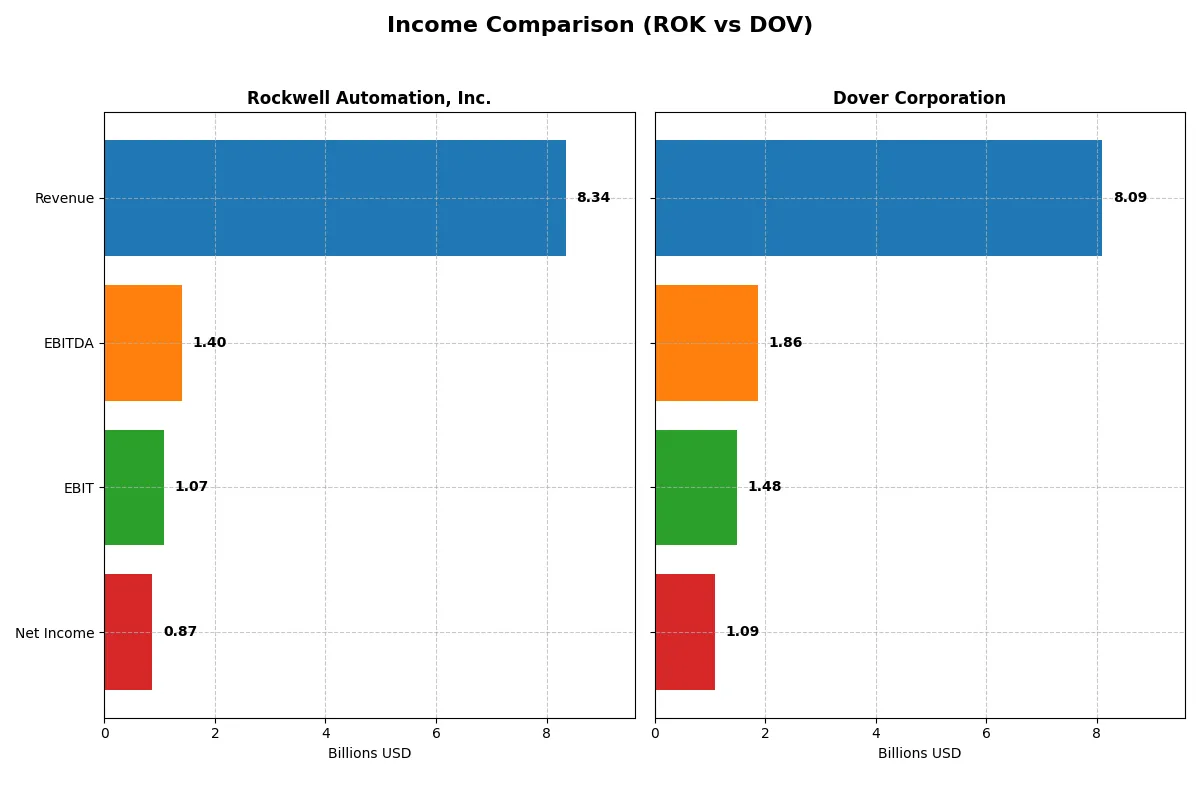
This data dissects the core profitability and scalability of both corporate engines to reveal who dominates the bottom line:
| Metric | Rockwell Automation, Inc. (ROK) | Dover Corporation (DOV) |
|---|---|---|
| Revenue | 8.34B | 8.09B |
| Cost of Revenue | 4.33B | 4.87B |
| Operating Expenses | 2.59B | 1.84B |
| Gross Profit | 4.02B | 3.22B |
| EBITDA | 1.40B | 1.86B |
| EBIT | 1.07B | 1.48B |
| Interest Expense | 156M | 110M |
| Net Income | 869M | 1.09B |
| EPS | 7.69 | 7.97 |
| Fiscal Year | 2025 | 2025 |
Income Statement Analysis: The Bottom-Line Duel
This income statement comparison reveals the true operational efficiency and profitability trends of two industrial giants over recent years.
Rockwell Automation, Inc. Analysis
Rockwell’s revenue grew 19% from 2021 to 2025, reaching $8.3B in 2025, but net income declined 36% to $867M. Its gross margin improved to 48.1%, signaling strong cost control, yet net margin fell to 10.4%. The latest year shows margin compression and shrinking net income despite stable revenue, indicating efficiency challenges.
Dover Corporation Analysis
Dover’s revenue remained relatively flat, growing only 2.4% over five years to $8.1B in 2025. Net income decreased slightly by 2.7% to $1.1B, but it maintained a robust net margin of 13.5%. Dover’s higher EBIT margin of 18.3% versus Rockwell’s 12.9% reflects superior operating leverage, despite some volatility in earnings growth.
Margin Strength vs. Revenue Expansion
Rockwell drives revenue growth but suffers declining profitability and compressed margins. Dover delivers steadier net income with stronger margins but lacks meaningful top-line expansion. For investors, Dover’s disciplined margin profile may offer more attractive stability, while Rockwell’s profile signals riskier efficiency struggles amid revenue gains.
Financial Ratios Comparison
These vital ratios act as a diagnostic tool to expose the underlying fiscal health, valuation premiums, and capital efficiency of the companies compared:
| Ratios | Rockwell Automation (ROK) | Dover Corporation (DOV) |
|---|---|---|
| ROE | 23.78% | — |
| ROIC | 13.71% | — |
| P/E | 45.33 | 24.49 |
| P/B | 10.78 | — |
| Current Ratio | 1.14 | 0 |
| Quick Ratio | 0.77 | 0 |
| D/E | 1.00 | 0 |
| Debt-to-Assets | 32.51% | 0 |
| Interest Coverage | 9.12 | 12.51 |
| Asset Turnover | 0.74 | 0 |
| Fixed Asset Turnover | 6.95 | 0 |
| Payout Ratio | 68.01% | 25.87% |
| Dividend Yield | 1.50% | 1.06% |
| Fiscal Year | 2025 | 2025 |
Efficiency & Valuation Duel: The Vital Signs
Ratios act as a company’s DNA, revealing hidden risks and operational excellence critical for investment decisions.
Rockwell Automation, Inc.
Rockwell Automation shows strong profitability with a 23.78% ROE and a healthy 10.42% net margin, signaling efficient operations. Its valuation appears stretched, trading at a high 45.33 P/E and 10.78 P/B, reflecting market optimism. The company offers a modest 1.5% dividend yield, balancing shareholder returns with ongoing R&D investment.
Dover Corporation
Dover posts a superior net margin of 13.52% but lacks returns data, indicating possible reporting gaps or restructuring. Its 24.49 P/E suggests a fair valuation, while zero debt metrics imply a conservative capital structure. Dover provides a 1.06% dividend yield, suggesting steady shareholder income amid limited reinvestment visibility.
Premium Valuation vs. Operational Safety
Rockwell Automation delivers higher profitability but trades at a premium, increasing valuation risk. Dover offers a safer valuation and stable dividends but lacks clear return metrics. Investors seeking growth might lean toward Rockwell; those favoring capital preservation may prefer Dover’s profile.
Which one offers the Superior Shareholder Reward?
I see Rockwell Automation (ROK) pays a higher dividend yield (~1.5%-1.9%) with a payout ratio near 60-68%, showing strong free cash flow coverage. Dover (DOV) yields lower (~1.0%-1.3%) with a conservative payout below 30%, favoring reinvestment. Both run robust buybacks, but ROK’s higher payout and stable FCF coverage suggest a more balanced distribution. Dover’s lower payout and greater R&D reinvestment signal growth focus but less immediate income. I judge Rockwell Automation offers the superior total shareholder reward in 2026, blending dependable income with sustainable capital returns.
Comparative Score Analysis: The Strategic Profile
The radar chart reveals the fundamental DNA and trade-offs of Rockwell Automation and Dover Corporation, highlighting their financial strengths and valuation contrasts:
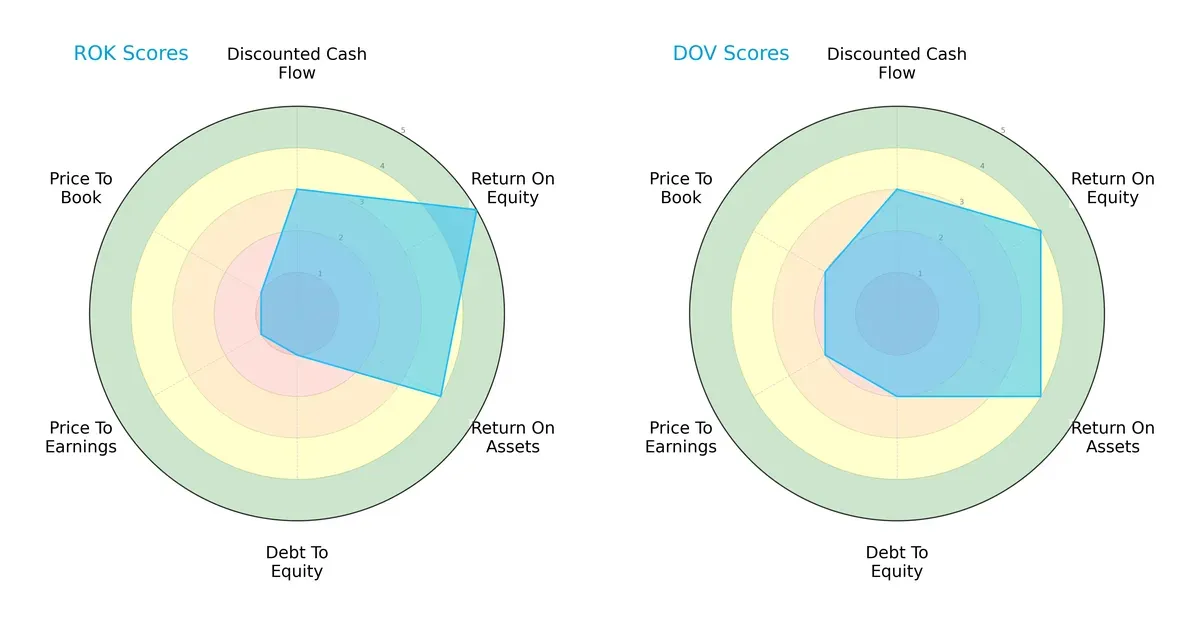
Rockwell Automation excels in return on equity (ROE 5 vs. 4) and return on assets (ROA 4 vs. 4), signaling superior profit generation. Dover shows a more balanced debt-to-equity (2 vs. 1) and valuation profile (P/E and P/B scores 2 vs. 1), indicating less financial risk and more reasonable pricing. Rockwell’s edge is its operational efficiency, but Dover offers steadier financial stability and valuation discipline.
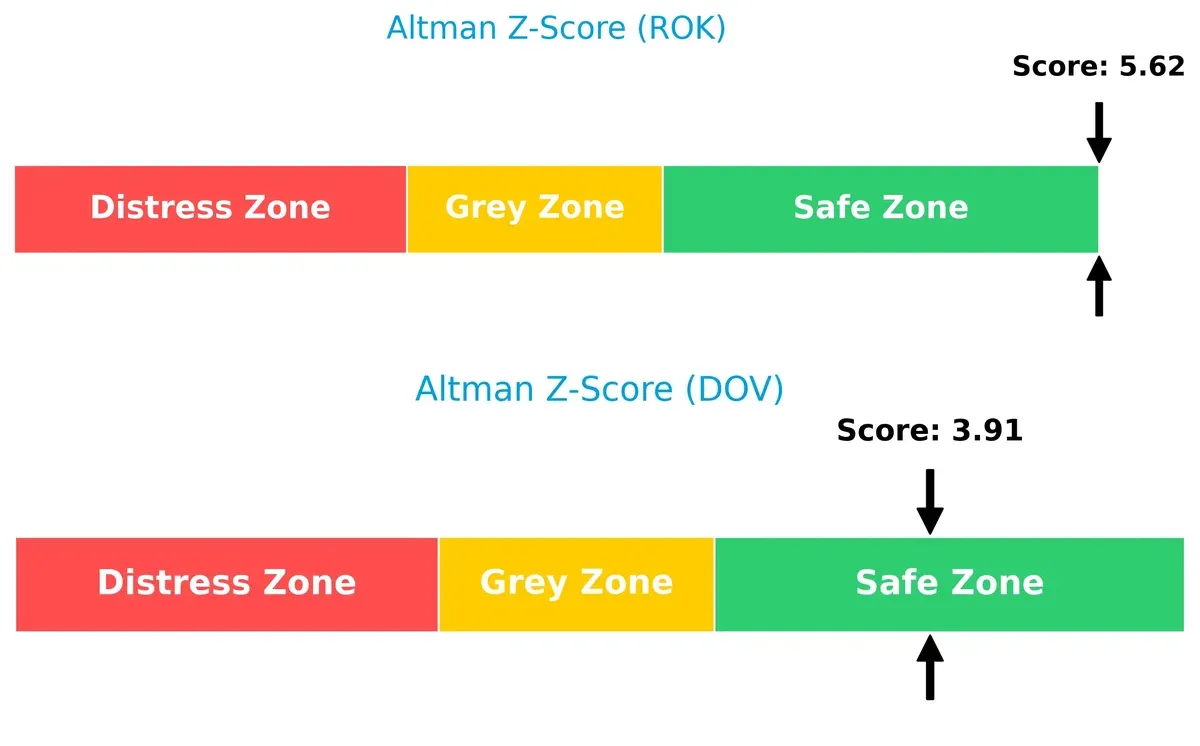
Bankruptcy Risk: Solvency Showdown
Rockwell Automation’s Altman Z-Score of 5.62 significantly surpasses Dover’s 3.91, both safely above the distress threshold, indicating robust solvency for long-term survival in this cycle:
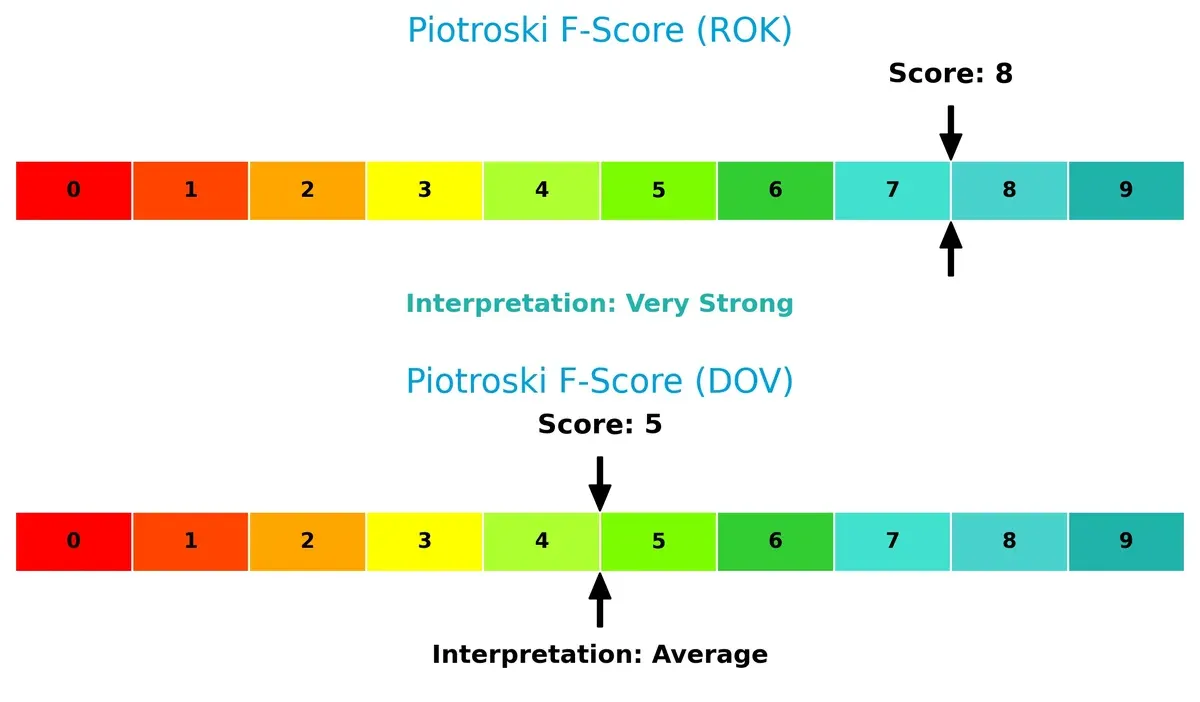
Financial Health: Quality of Operations
Rockwell Automation scores an 8 on the Piotroski F-Score, indicating very strong financial health, while Dover’s 5 suggests average operational quality and potential internal weaknesses:
How are the two companies positioned?
This section dissects the operational DNA of Rockwell Automation and Dover by comparing their revenue distribution and internal dynamics. The goal is to confront their economic moats and identify which model offers the most resilient competitive advantage today.
Revenue Segmentation: The Strategic Mix
This visual comparison dissects how Rockwell Automation and Dover diversify their income streams and where their primary sector bets lie:
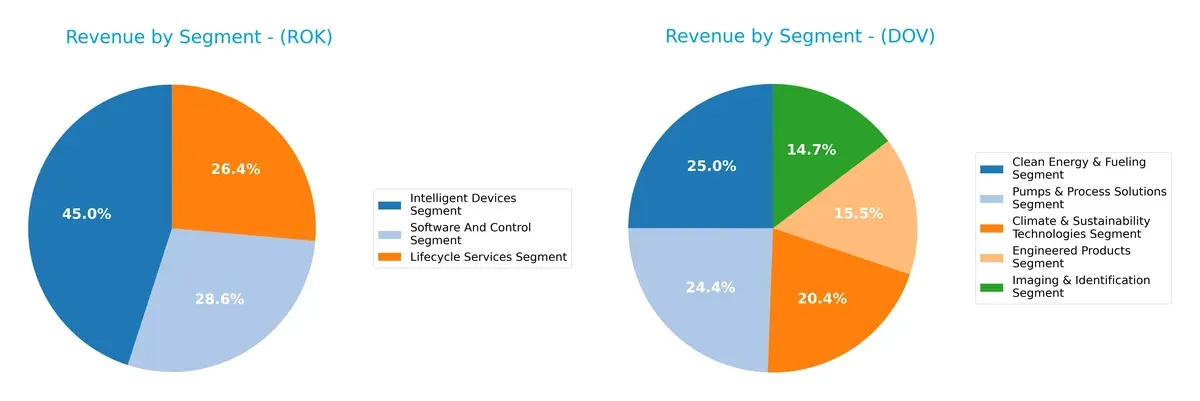
Rockwell Automation anchors its revenue in three balanced segments: Intelligent Devices at $3.76B, Software and Control at $2.38B, and Lifecycle Services at $2.20B. This mix signals a strong ecosystem lock-in through integrated hardware and software solutions. Dover, meanwhile, displays a broader diversification across five segments, each between $1.1B and $1.9B, reducing concentration risk but lacking a single dominant revenue engine. Dover pivots on engineered products and clean energy, reflecting infrastructure breadth rather than platform dominance.
Strengths and Weaknesses Comparison
This table compares the Strengths and Weaknesses of Rockwell Automation, Inc. and Dover Corporation:
ROK Strengths
- Diverse revenue across Intelligent Devices, Lifecycle Services, and Software segments
- Favorable net margin at 10.42% and strong ROE of 23.78%
- Favorable interest coverage at 6.88 and fixed asset turnover of 6.95
- Global presence with significant North America and EMEA sales
DOV Strengths
- Diverse product segments including Clean Energy, Engineered Products, and Imaging
- Favorable net margin at 13.52% and strong interest coverage at 13.52
- Favorable debt-to-equity and debt-to-assets indicating low leverage
- Significant U.S. revenue dominance and broad geographic exposure
ROK Weaknesses
- High PE (45.33) and PB (10.78) ratios indicate elevated valuation
- WACC at 10.44% unfavorable relative to ROIC
- Quick ratio of 0.77 suggests liquidity constraints
- Moderate debt level with 32.51% debt-to-assets
- Asset turnover at 0.74 is only neutral
DOV Weaknesses
- Zero ROE and ROIC suggest profitability concerns
- Unavailable WACC data limits financial insight
- Unfavorable current and quick ratios indicate liquidity risks
- Asset and fixed asset turnover at 0 indicate operational inefficiency
- Elevated unfavorable ratios at 42.86% highlights financial weakness
Overall, ROK shows strengths in profitability and operational efficiency but faces valuation and liquidity concerns. DOV has solid margins and low leverage but struggles with profitability metrics and liquidity, which could pressure its strategy.
The Moat Duel: Analyzing Competitive Defensibility
A structural moat is the only reliable defense protecting long-term profits from relentless competitive erosion. Let’s dissect the competitive moats of two industrial giants:
Rockwell Automation, Inc.: Digital Transformation and Integration Moat
Rockwell Automation leverages its intangible assets in automation software and integrated solutions. This moat shows in a robust ROIC exceeding WACC by 3.27%, with growing profitability. Its expansion into digital twin and cloud services in 2026 could deepen this advantage.
Dover Corporation: Diversified Industrial Solutions Moat
Dover’s strength lies in its diversified product portfolio across multiple industrial segments, contrasting Rockwell’s software focus. However, its declining ROIC trend signals weakening capital efficiency. Opportunities in clean energy tech may offer a turnaround, but competitive pressures remain intense.
Digital Integration vs. Diversification: Who Holds the Deeper Moat?
Rockwell Automation’s growing ROIC and focus on high-value digital solutions create a deeper, more durable moat than Dover’s broad but faltering industrial mix. Rockwell is better positioned to defend and expand market share amid technological shifts.
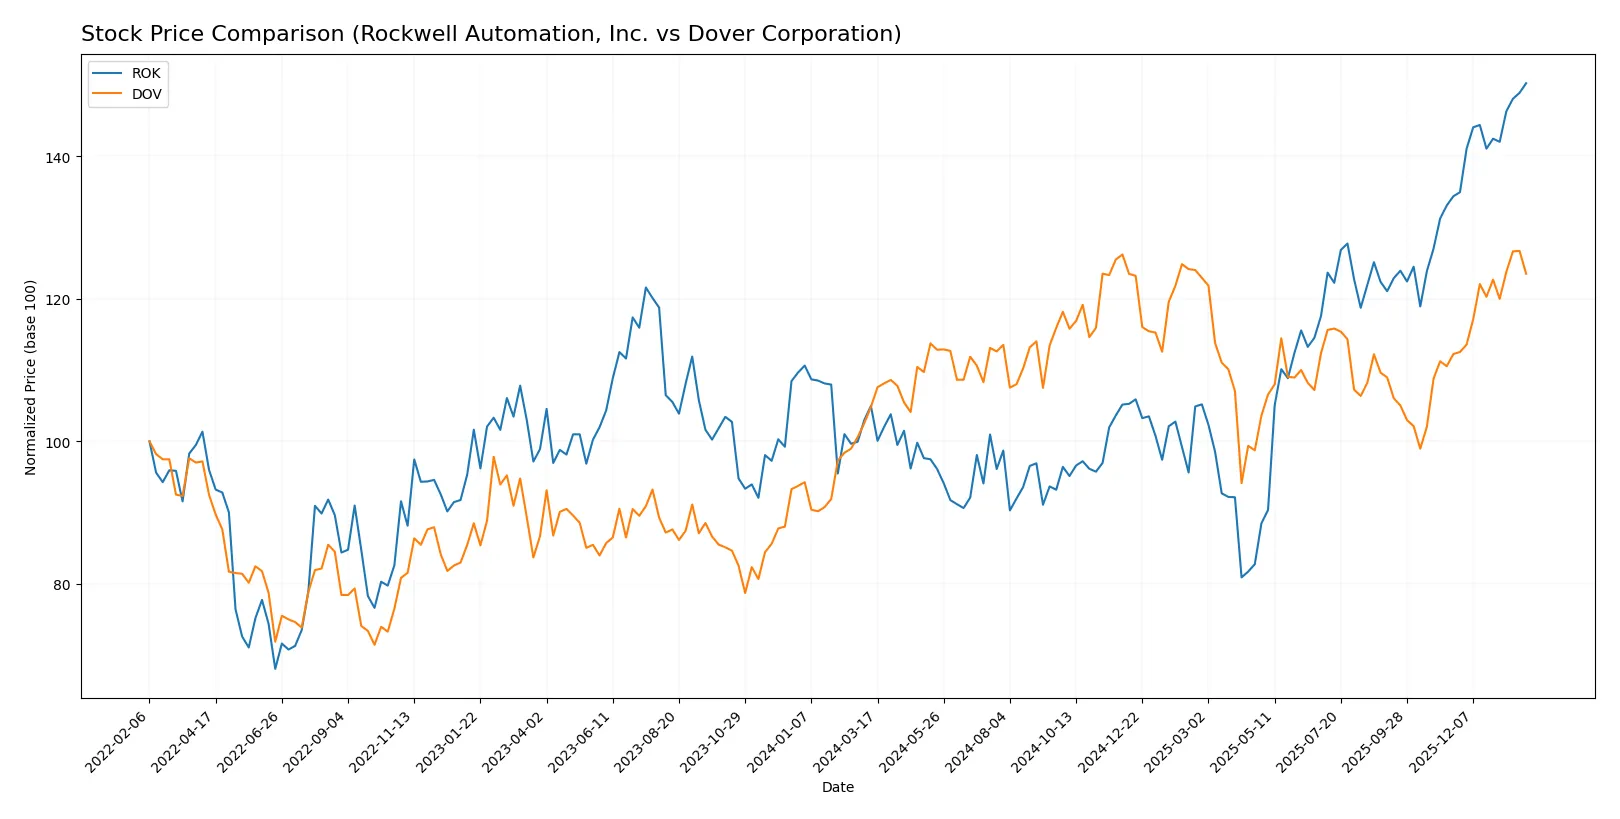
Which stock offers better returns?
The stock price chart highlights significant bullish momentum for both companies over the past year, with Rockwell Automation showing stronger acceleration and wider price swings.
Trend Comparison
Rockwell Automation, Inc. (ROK) exhibits a 43.13% price increase over the last 12 months, with accelerating momentum and a high volatility of 48.69%, reaching a peak of 421.65.
Dover Corporation (DOV) shows a 17.81% gain over the same period, also accelerating but with lower volatility at 11.33%, hitting a high of 206.71.
ROK outperformed DOV by a wide margin, delivering the highest market performance with faster acceleration and greater price appreciation.
Target Prices
Analysts set a clear target consensus for Rockwell Automation, Inc. and Dover Corporation, reflecting moderate upside potential.
| Company | Target Low | Target High | Consensus |
|---|---|---|---|
| Rockwell Automation, Inc. | 380 | 470 | 421.57 |
| Dover Corporation | 195 | 256 | 221.38 |
Rockwell Automation’s consensus target aligns closely with its current price of 421.65, suggesting limited near-term upside. Dover’s target consensus at 221.38 implies roughly 10% potential gain from its current 201.49 price.

Don’t Let Luck Decide Your Entry Point
Optimize your entry points with our advanced ProRealTime indicators. You’ll get efficient buy signals with precise price targets for maximum performance. Start outperforming now!
How do institutions grade them?
Rockwell Automation, Inc. Grades
The following table summarizes recent grades from major financial institutions:
| Grading Company | Action | New Grade | Date |
|---|---|---|---|
| Oppenheimer | Downgrade | Perform | 2026-01-20 |
| JP Morgan | Maintain | Neutral | 2026-01-16 |
| Morgan Stanley | Maintain | Overweight | 2026-01-13 |
| Wells Fargo | Maintain | Equal Weight | 2026-01-07 |
| Barclays | Maintain | Overweight | 2026-01-07 |
| Goldman Sachs | Upgrade | Neutral | 2025-12-16 |
| Jefferies | Maintain | Buy | 2025-12-10 |
| Citigroup | Maintain | Buy | 2025-12-08 |
| Barclays | Maintain | Overweight | 2025-12-04 |
| Baird | Maintain | Outperform | 2025-11-21 |
Dover Corporation Grades
The following table summarizes recent grades from major financial institutions:
| Grading Company | Action | New Grade | Date |
|---|---|---|---|
| JP Morgan | Maintain | Overweight | 2026-01-30 |
| Wells Fargo | Maintain | Equal Weight | 2026-01-30 |
| RBC Capital | Maintain | Sector Perform | 2026-01-30 |
| Oppenheimer | Maintain | Outperform | 2026-01-26 |
| JP Morgan | Maintain | Overweight | 2026-01-16 |
| Barclays | Maintain | Equal Weight | 2026-01-07 |
| Wells Fargo | Maintain | Equal Weight | 2026-01-07 |
| UBS | Upgrade | Buy | 2026-01-05 |
| Wells Fargo | Maintain | Equal Weight | 2025-12-15 |
| Oppenheimer | Maintain | Outperform | 2025-11-14 |
Which company has the best grades?
Dover Corporation consistently holds Overweight and Outperform ratings, with fewer downgrades than Rockwell Automation. This steadier outlook may provide investors clearer confidence in Dover’s near-term prospects.
Risks specific to each company
The following categories identify the critical pressure points and systemic threats facing both firms in the 2026 market environment:
1. Market & Competition
Rockwell Automation, Inc.
- Faces intense competition in industrial automation with high valuation multiples pressuring growth expectations.
Dover Corporation
- Operates diversified industrial segments but shows weaker asset efficiency, limiting competitive agility.
2. Capital Structure & Debt
Rockwell Automation, Inc.
- Maintains a neutral debt-to-equity ratio at 1.0 but scores very unfavorable on debt-to-equity risk metrics.
Dover Corporation
- Shows favorable debt metrics with low leverage but lacks disclosed WACC data, raising transparency concerns.
3. Stock Volatility
Rockwell Automation, Inc.
- Exhibits higher beta at 1.516, indicating more volatility relative to the market.
Dover Corporation
- Displays lower beta of 1.305, suggesting comparatively less stock price volatility.
4. Regulatory & Legal
Rockwell Automation, Inc.
- Industry exposure to evolving industrial safety and cybersecurity regulations may increase compliance costs.
Dover Corporation
- Faces regulatory scrutiny in clean energy and fueling segments, complicating operational compliance.
5. Supply Chain & Operations
Rockwell Automation, Inc.
- Complex global supply chains for hardware and software components expose it to disruption risks.
Dover Corporation
- Diverse product lines and aftermarket parts create operational complexity but with less digital reliance.
6. ESG & Climate Transition
Rockwell Automation, Inc.
- Invests in digital transformation aiding eco-industrial markets, aligning with climate transition trends.
Dover Corporation
- Operates a dedicated Climate & Sustainability Technologies segment, positioning well for energy transition demands.
7. Geopolitical Exposure
Rockwell Automation, Inc.
- Global operations expose it to trade tensions impacting semiconductor and automotive clients.
Dover Corporation
- Exposure to international markets is moderate but includes sensitive defense and fueling sectors.
Which company shows a better risk-adjusted profile?
Dover’s most impactful risk lies in unclear financial transparency and weak asset utilization. Rockwell faces valuation and leverage concerns but benefits from stronger profitability and financial health. Rockwell’s robust Altman Z-Score (5.62) and Piotroski Score (8) confirm superior financial stability. Dover’s scores signal moderate risk, reflecting operational and disclosure weaknesses. Thus, Rockwell Automation offers a better risk-adjusted profile in 2026.
Final Verdict: Which stock to choose?
Rockwell Automation’s superpower lies in its durable competitive advantage and growing profitability. Its ability to generate returns well above its cost of capital signals strong value creation. A point of vigilance is its stretched valuation multiples and moderate liquidity, which could pressure downside in volatile markets. It suits portfolios seeking aggressive growth with tolerance for premium pricing.
Dover Corporation’s strategic moat centers on its steady cash flow and conservative financial structure, offering better safety than Rockwell Automation. While lacking clear ROIC data, its consistent dividend and moderate valuation appeal to investors favoring stability. Dover fits well in GARP portfolios that balance growth potential with reasonable risk.
If you prioritize high-growth and value creation backed by a strong moat, Rockwell Automation outshines as the compelling choice due to its rising ROIC and robust profitability. However, if you seek better financial stability and a more conservative risk profile, Dover offers superior safety and steady income prospects. Both present valid scenarios depending on your investment strategy and risk tolerance.
Disclaimer: Investment carries a risk of loss of initial capital. The past performance is not a reliable indicator of future results. Be sure to understand risks before making an investment decision.
Go Further
I encourage you to read the complete analyses of Rockwell Automation, Inc. and Dover Corporation to enhance your investment decisions: