Home > Comparison > Industrials > DOV vs PNR
The strategic rivalry between Dover Corporation and Pentair plc shapes the industrial machinery sector’s evolution. Dover operates as a diversified industrial equipment provider spanning multiple end-markets, while Pentair focuses on specialized water treatment and fluid management solutions. This head-to-head contrasts broad industrial diversification against niche market leadership. This analysis aims to identify which corporate strategy delivers superior risk-adjusted returns for a balanced portfolio amid evolving global industrial demands.
Table of contents
Companies Overview
Dover Corporation and Pentair plc hold pivotal roles in the industrial machinery sector, shaping market dynamics through distinct approaches.
Dover Corporation: Diverse Industrial Solutions Leader
Dover Corporation dominates with a broad portfolio of equipment and components across multiple industrial markets. It generates revenue by selling engineered products, clean energy fueling systems, and climate technologies. In 2026, Dover focuses on expanding digital solutions and aftermarket services to strengthen its competitive edge and drive sustainable growth.
Pentair plc: Water Solutions Innovator
Pentair plc specializes in comprehensive water treatment and fluid management systems worldwide. Its core revenue stems from residential and industrial water filtration, pumps, and valves. The company’s 2026 strategy centers on enhancing advanced membrane filtration technologies and expanding its consumer and industrial segment footprint globally.
Strategic Collision: Similarities & Divergences
Both firms excel in industrial machinery but diverge in focus—Dover pursues a diversified product ecosystem, while Pentair emphasizes specialized water solutions. Their primary battleground is industrial market share expansion through innovation and service excellence. Investors face contrasting profiles: Dover offers wide industrial exposure, Pentair delivers niche water industry expertise.
Income Statement Comparison
This data dissects the core profitability and scalability of both corporate engines to reveal who dominates the bottom line:
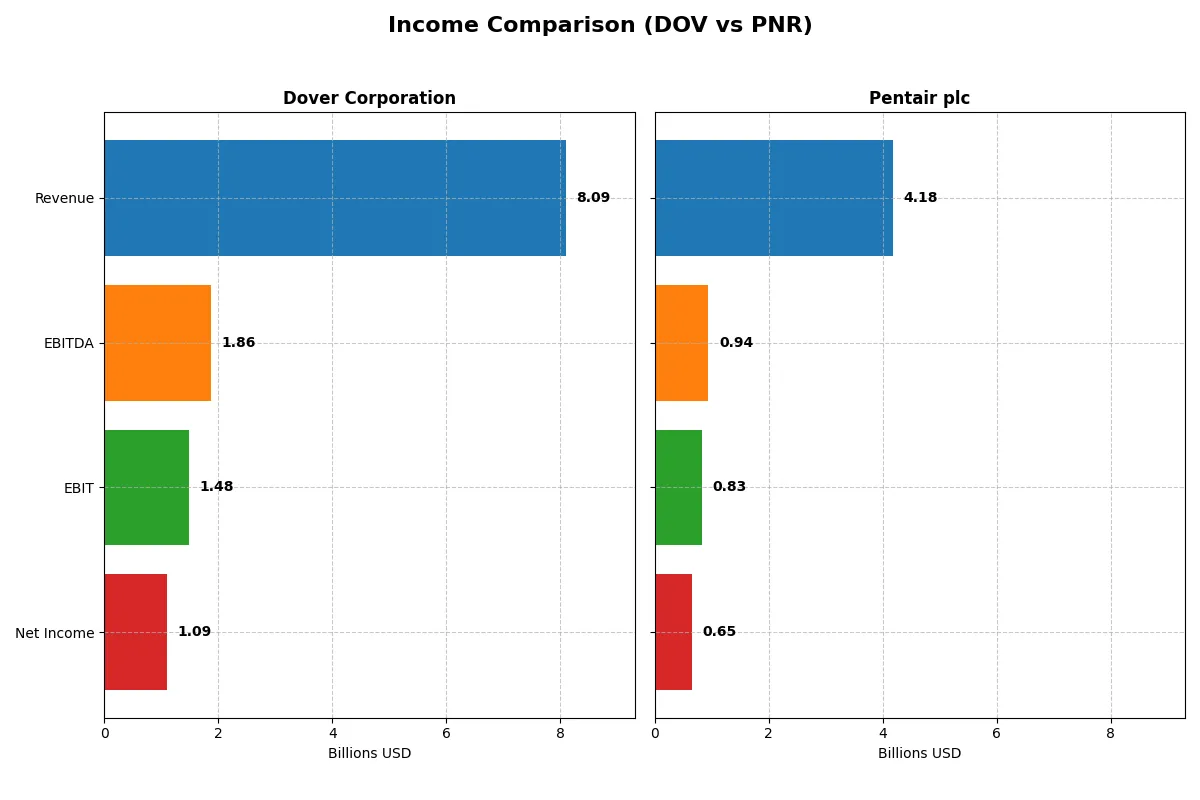
| Metric | Dover Corporation (DOV) | Pentair plc (PNR) |
|---|---|---|
| Revenue | 8.1B | 4.2B |
| Cost of Revenue | 4.9B | 2.5B |
| Operating Expenses | 1.8B | 833M |
| Gross Profit | 3.2B | 1.7B |
| EBITDA | 1.9B | 944M |
| EBIT | 1.5B | 826M |
| Interest Expense | 110M | 69M |
| Net Income | 1.1B | 654M |
| EPS | 7.97 | 3.99 |
| Fiscal Year | 2025 | 2025 |
Income Statement Analysis: The Bottom-Line Duel
This income statement comparison reveals which company converts sales into profit with superior efficiency and sustainable margin performance.
Dover Corporation Analysis
Dover’s revenue showed slight growth from 7.9B in 2021 to 8.1B in 2025, but net income declined modestly, hitting 1.09B in 2025. Its gross margin held strong near 40%, yet net margin contracted sharply to 13.5%, reflecting pressure on profitability. The 2025 drop in EBIT and net margin signals waning operational momentum despite stable top-line trends.
Pentair plc Analysis
Pentair’s revenue rose steadily from 3.76B in 2021 to 4.18B in 2025, with net income surging to 650M. It maintains a slightly higher gross margin at 40.5% and a healthier net margin at 15.7%. Pentair’s 2025 earnings growth, albeit modest, demonstrates improved operational efficiency and margin expansion, reinforcing positive earnings momentum over the period.
Margin Strength vs. Earnings Momentum
Pentair’s income statement outperforms Dover’s in growth and margin expansion, delivering stronger bottom-line gains and improving net margins. Dover’s stable revenue masks deteriorating profitability and margin compression, weakening its earnings quality. For investors prioritizing consistent margin improvement and earnings momentum, Pentair presents a more compelling income profile.
Financial Ratios Comparison
These vital ratios act as a diagnostic tool to expose the underlying fiscal health, valuation premiums, and capital efficiency of the companies compared below:
| Ratios | Dover Corporation (DOV) | Pentair plc (PNR) |
|---|---|---|
| ROE | 14.8% | 16.9% |
| ROIC | 9.4% | 12.5% |
| P/E | 24.5x | 26.1x |
| P/B | 3.62x | 4.42x |
| Current Ratio | 1.79 | 1.61 |
| Quick Ratio | 1.28 | 0.95 |
| D/E (Debt-to-Equity) | 0.45 | 0.42 |
| Debt-to-Assets | 24.8% | 23.9% |
| Interest Coverage | 12.5x | 12.4x |
| Asset Turnover | 0.60 | 0.61 |
| Fixed Asset Turnover | 7.23 | 11.08 |
| Payout Ratio | 25.9% | 25.1% |
| Dividend Yield | 1.06% | 0.96% |
| Fiscal Year | 2025 | 2025 |
Efficiency & Valuation Duel: The Vital Signs
Financial ratios act as a company’s DNA, exposing hidden risks and revealing operational excellence. They provide a snapshot of profitability, valuation, and financial health.
Dover Corporation
Dover posts a moderate ROE of 14.77% with a favorable net margin of 13.52%, signaling steady profitability. The P/E ratio at 24.49 appears neutral, suggesting fair valuation, though the high PB ratio of 3.62 flags potential overvaluation. Dover rewards shareholders with a 1.06% dividend yield, balancing income with reinvestment in growth.
Pentair plc
Pentair delivers stronger profitability, with a 16.9% ROE and a 15.66% net margin. However, its stock trades at a stretched P/E of 26.14 and an elevated PB of 4.42, indicating a premium valuation. Dividend yield is slightly lower at 0.96%, reflecting a cautious income return amid ongoing reinvestment initiatives.
Premium Valuation vs. Operational Safety
Pentair offers higher returns but at a clearly stretched valuation, increasing risk. Dover presents a more balanced profile with solid profitability and a reasonable valuation. Investors seeking operational stability may prefer Dover, while those targeting growth at a premium might lean toward Pentair.
Which one offers the Superior Shareholder Reward?
I see Dover Corporation (DOV) and Pentair plc (PNR) both pay dividends with yields near 1%. Dover yields 1.06% with a 26% payout ratio, well-covered by free cash flow at 84%. Pentair yields less at 0.96%, paying out 25% of earnings, also comfortably covered by free cash flow at 92%. Buybacks differ: Dover maintains modest repurchases supporting total returns, while Pentair runs stronger buyback intensity, boosting shareholder value. Dover’s higher margins and stable cash flows suggest more sustainable distributions. I conclude Dover offers a more attractive total return profile in 2026 due to its balance of dividends, prudent buybacks, and robust cash flow coverage.
Comparative Score Analysis: The Strategic Profile
The radar chart reveals the fundamental DNA and trade-offs of Dover Corporation and Pentair plc, highlighting their financial strengths and weaknesses across key metrics:
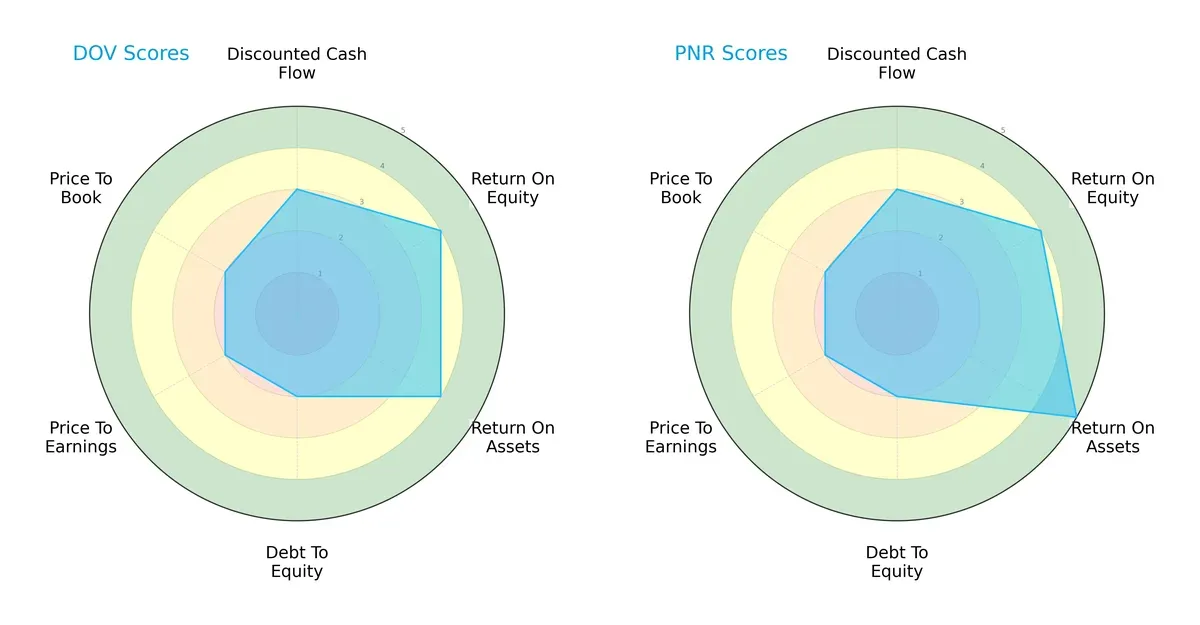
Both firms score equally on overall and discounted cash flow, but Pentair edges Dover with a superior return on assets (5 vs. 4). Both show strong return on equity (4 each). However, each has a weaker debt-to-equity profile (2) and valuation scores (2 for P/E and P/B), signaling balance sheet leverage and pricing concerns. Pentair’s higher ROA suggests it uses assets more efficiently, while Dover offers a more balanced return pattern. Neither dominates decisively, but Pentair’s operational efficiency offers a subtle edge.
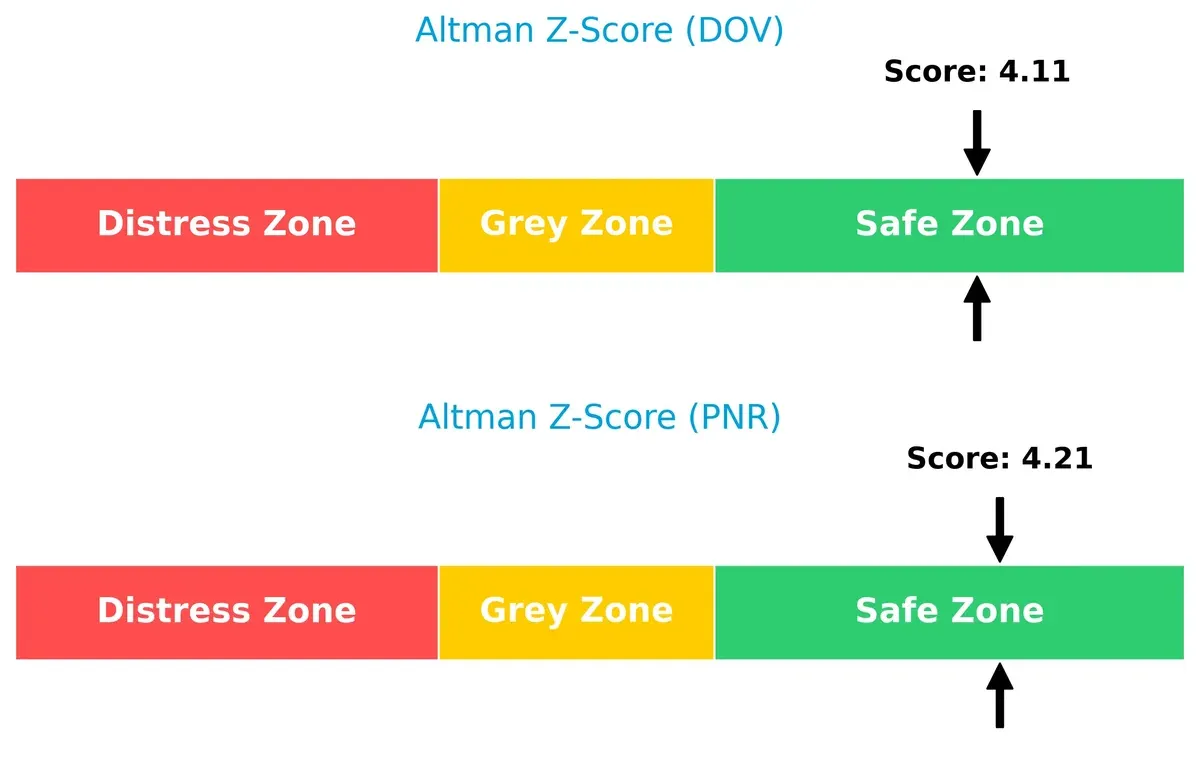
Bankruptcy Risk: Solvency Showdown
The Altman Z-Score delta between Dover (4.11) and Pentair (4.21) places both well within the safe zone, indicating strong solvency and low bankruptcy risk in this economic cycle:
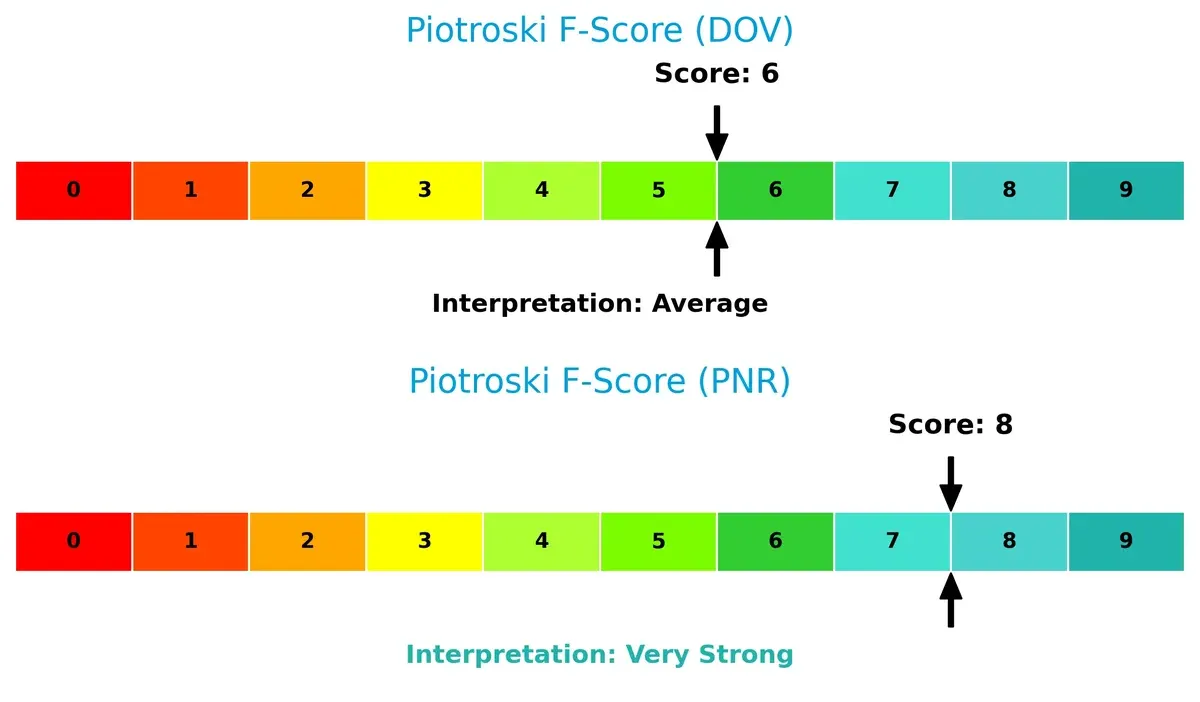
Financial Health: Quality of Operations
Pentair’s Piotroski F-Score of 8 versus Dover’s 6 signals superior financial health and operational quality. Dover’s average score raises moderate caution on internal metrics compared to Pentair’s robust profile:
How are the two companies positioned?
This section dissects Dover and Pentair’s operational DNA by comparing revenue distribution and internal dynamics—strengths and weaknesses. The goal is to confront their economic moats and determine which model offers the most resilient, sustainable competitive advantage today.
Revenue Segmentation: The Strategic Mix
This visual comparison dissects how Dover Corporation and Pentair plc diversify their income streams and where their primary sector bets lie:
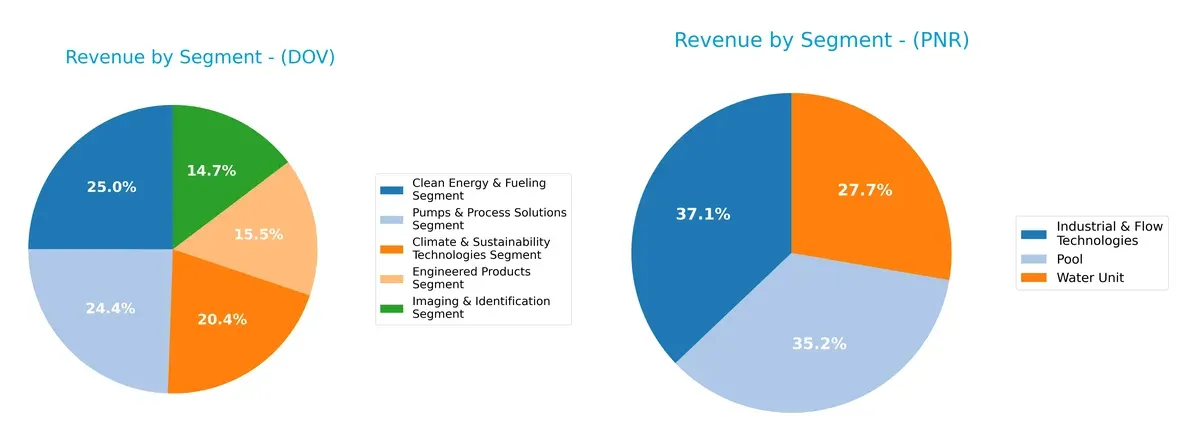
Dover anchors its revenue on five balanced segments, each ranging roughly from $1.1B to $1.9B in 2024, showing a true diversification that mitigates concentration risk. Pentair, by contrast, pivots around three main segments—Industrial & Flow Technologies ($1.5B), Pool ($1.4B), and Water Unit ($1.1B)—with less spread, suggesting focused bets on water and flow solutions. Dover’s mix signals ecosystem lock-in across industrial niches, while Pentair’s concentration invites scrutiny of sector cyclicality.
Strengths and Weaknesses Comparison
This table compares the Strengths and Weaknesses of Dover Corporation and Pentair plc:
Dover Corporation Strengths
- Diversified segments including Clean Energy, Climate Technologies, and Process Solutions
- Favorable net margin at 13.52%
- Strong liquidity ratios with current ratio 1.79
- Low leverage with debt-to-assets at 24.79%
- High fixed asset turnover at 7.23
- Significant global reach including Americas, Asia, and Europe
Pentair plc Strengths
- Higher profitability with net margin 15.66% and ROE 16.9%
- ROIC exceeds WACC indicating value creation
- Favorable liquidity and leverage metrics
- Strong fixed asset turnover at 11.08
- Balanced geographic exposure with large U.S. and developing markets presence
Dover Corporation Weaknesses
- Price-to-book ratio unfavorable at 3.62 signals possible overvaluation
- Neutral ROE and ROIC suggest room for efficiency gains
- Moderate asset turnover at 0.6
- Dividend yield neutral at 1.06%
- Segment revenue mix shows some volatility across years
Pentair plc Weaknesses
- Higher price-to-earnings at 26.14 and price-to-book at 4.42 indicate premium valuation
- Quick ratio neutral at 0.95 hints at tighter short-term liquidity
- Dividend yield unfavorable at 0.96%
- Higher proportion of unfavorable ratios at 21.43%
Dover shows broad diversification and solid financial health with slightly favorable ratios. Pentair excels in profitability and capital efficiency but faces valuation premiums and some liquidity caution. Both companies leverage global operations, shaping strategic priorities around sustaining margins and managing growth risks.
The Moat Duel: Analyzing Competitive Defensibility
A structural moat is the only reliable shield protecting long-term profits from relentless competitive erosion:
Dover Corporation: Diversified Industrial Solutions with Scale Moat
Dover’s moat stems from a broad portfolio across industrial machinery segments, enabling stable margins near 18% EBIT. Yet, declining ROIC signals emerging pressure on capital efficiency in 2026.
Pentair plc: Focused Water Solutions with Cost and Brand Moat
Pentair leverages specialized water treatment technology and strong brand recognition, delivering higher margins around 20%. Its superior ROIC versus WACC underscores ongoing value creation despite a slight profitability dip.
Scale Diversification vs. Specialized Focus: The Moat Face-Off
Pentair’s moat proves deeper, consistently creating value with a 3.5% ROIC premium over WACC. Dover’s diverse assets offer breadth but faltering ROIC weakens its competitive shield. Pentair stands better poised to defend market share in 2026.
Which stock offers better returns?
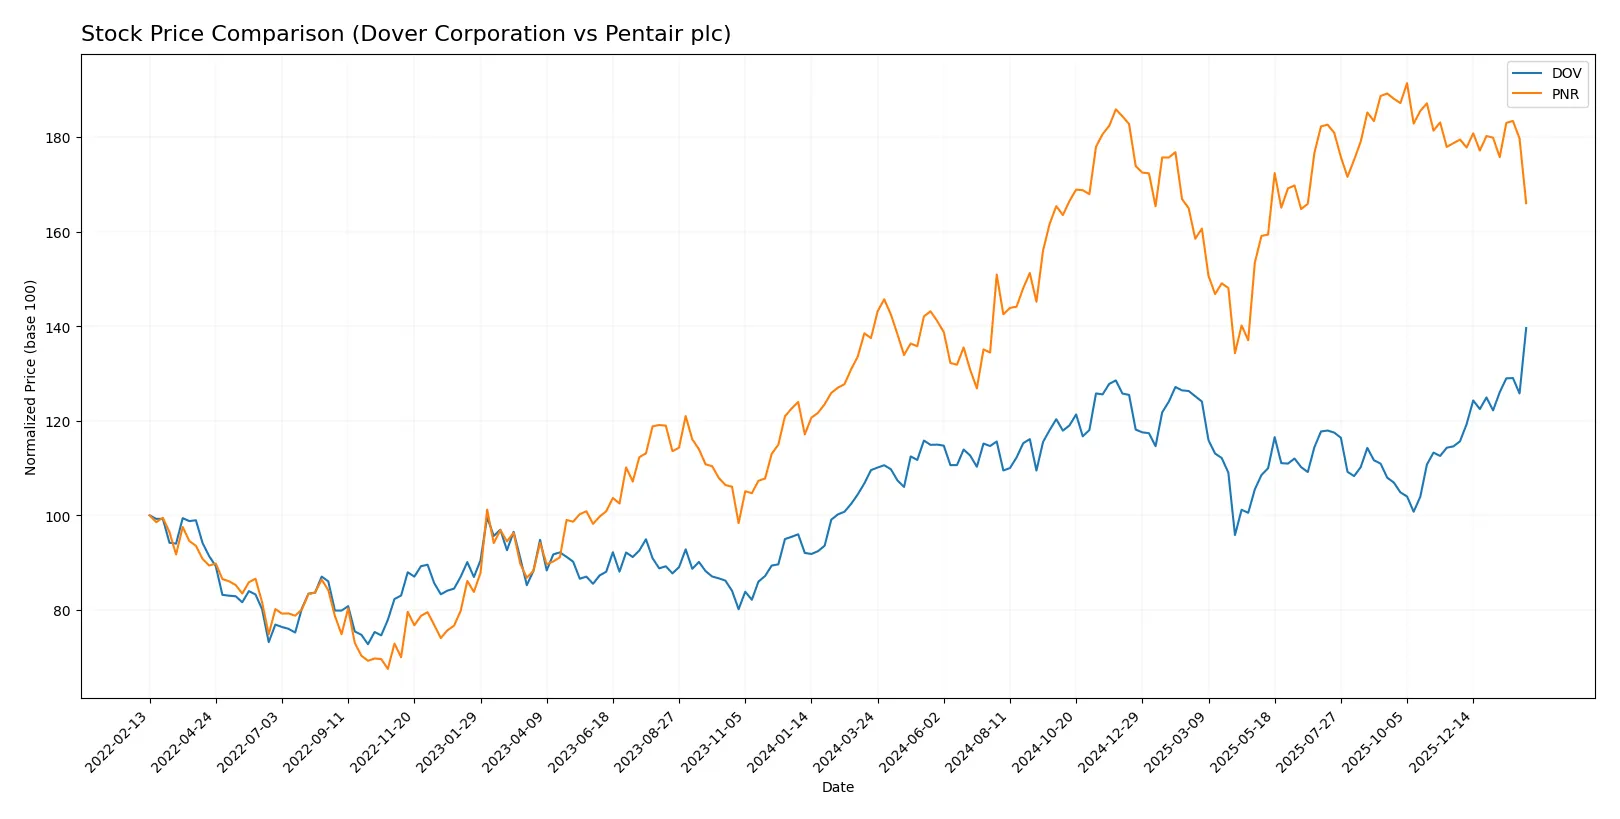
The past year shows Dover Corporation surging 27.4%, with accelerating gains and a peak near 224. Pentair plc climbs 20.7% but slows down, hitting 112 at its high.
Trend Comparison
Dover Corporation’s stock rose 27.4% over the past year, signaling a bullish trend with accelerating momentum and a volatility of 11.92. It reached a high of 223.66, reflecting strong upward price movement.
Pentair plc gained 20.7% over the year, also bullish but with decelerating growth and slightly lower volatility at 10.7. Its peak price was 112.23, showing less dynamic upward pressure.
Dover outperformed Pentair by nearly 7 percentage points and maintains acceleration, making it the stronger market performer in this comparison.
Target Prices
Analysts present a mixed but generally optimistic target consensus for Dover Corporation and Pentair plc.
| Company | Target Low | Target High | Consensus |
|---|---|---|---|
| Dover Corporation | 195 | 256 | 223.7 |
| Pentair plc | 90 | 135 | 118.56 |
Dover’s target consensus aligns closely with its current price of 223.66, suggesting limited upside. Pentair’s consensus at 118.56 implies a notable potential gain versus its current 97.35 price.

Don’t Let Luck Decide Your Entry Point
Optimize your entry points with our advanced ProRealTime indicators. You’ll get efficient buy signals with precise price targets for maximum performance. Start outperforming now!
How do institutions grade them?
Dover Corporation Grades
Here are the recent institutional grades for Dover Corporation from leading firms:
| Grading Company | Action | New Grade | Date |
|---|---|---|---|
| JP Morgan | Maintain | Overweight | 2026-01-30 |
| Wells Fargo | Maintain | Equal Weight | 2026-01-30 |
| RBC Capital | Maintain | Sector Perform | 2026-01-30 |
| Oppenheimer | Maintain | Outperform | 2026-01-26 |
| JP Morgan | Maintain | Overweight | 2026-01-16 |
| Wells Fargo | Maintain | Equal Weight | 2026-01-07 |
| Barclays | Maintain | Equal Weight | 2026-01-07 |
| UBS | Upgrade | Buy | 2026-01-05 |
| Wells Fargo | Maintain | Equal Weight | 2025-12-15 |
| Oppenheimer | Maintain | Outperform | 2025-11-14 |
Pentair plc Grades
Below are the recent institutional grades for Pentair plc from notable agencies:
| Grading Company | Action | New Grade | Date |
|---|---|---|---|
| Citigroup | Maintain | Buy | 2026-02-04 |
| Oppenheimer | Maintain | Outperform | 2026-02-04 |
| JP Morgan | Maintain | Overweight | 2026-01-16 |
| Citigroup | Maintain | Buy | 2026-01-12 |
| BNP Paribas Exane | Downgrade | Underperform | 2026-01-07 |
| TD Cowen | Downgrade | Sell | 2026-01-05 |
| Jefferies | Upgrade | Buy | 2025-12-10 |
| Barclays | Downgrade | Equal Weight | 2025-12-04 |
| Oppenheimer | Maintain | Outperform | 2025-11-20 |
| UBS | Maintain | Buy | 2025-10-22 |
Which company has the best grades?
Dover Corporation holds a consistent set of positive grades with multiple Overweight and Outperform ratings and an upgrade to Buy. Pentair shows mixed signals with high ratings but also recent downgrades to Underperform and Sell. Dover’s steadier positive outlook may suggest more institutional confidence.
Risks specific to each company
The following categories identify the critical pressure points and systemic threats facing both firms in the 2026 market environment:
1. Market & Competition
Dover Corporation
- Operates in diversified industrial machinery with exposure to multiple end-markets, facing broad competitive pressures.
Pentair plc
- Focuses on water solutions, a niche with specialized competition but growing demand for sustainability.
2. Capital Structure & Debt
Dover Corporation
- Moderate leverage with a debt-to-equity ratio of 0.45; interest coverage strong at 13.5x, indicating manageable debt risk.
Pentair plc
- Similar leverage at 0.42 debt-to-equity; interest coverage slightly lower at 11.9x but still comfortable for debt servicing.
3. Stock Volatility
Dover Corporation
- Beta of 1.29 suggests moderately higher volatility than the market, requiring risk tolerance.
Pentair plc
- Beta of 1.22 indicates slightly lower volatility than Dover but still above market average.
4. Regulatory & Legal
Dover Corporation
- Exposed to US industrial and environmental regulations; evolving clean energy policies may impose compliance costs.
Pentair plc
- Subject to UK and EU water treatment regulations; increasing environmental standards may require costly upgrades.
5. Supply Chain & Operations
Dover Corporation
- Complex global supply chains for machinery parts; risks from raw material price volatility and geopolitical disruptions.
Pentair plc
- Supply chain focused on water equipment components; moderately exposed to global logistics risks but more regionalized.
6. ESG & Climate Transition
Dover Corporation
- Faces pressure to innovate clean energy products; climate transition presents both risk and opportunity.
Pentair plc
- Strong ESG focus in water conservation and filtration; well positioned but must maintain innovation pace.
7. Geopolitical Exposure
Dover Corporation
- Primarily US-based with international sales; trade tensions and tariffs can impact export markets.
Pentair plc
- UK-headquartered with global operations; Brexit and other geopolitical shifts pose moderate risks.
Which company shows a better risk-adjusted profile?
Pentair faces its most impactful risk in regulatory and ESG transition demands, given its niche in water solutions. Dover’s key risk lies in market competition and supply chain complexity due to its diversified industrial footprint. Pentair’s higher Piotroski score (8 vs. 6) and favorable Altman Z-Score reflect stronger financial health. Despite slightly higher stock volatility, Pentair offers a superior risk-adjusted profile, supported by robust operational efficiencies and proactive ESG initiatives.
Final Verdict: Which stock to choose?
Dover Corporation’s superpower lies in its resilient operational efficiency and strong liquidity, which have underpinned steady cash flow generation. However, its declining profitability trend is a point of vigilance. Dover might suit investors targeting aggressive growth with a tolerance for cyclical earnings swings.
Pentair plc builds its edge on a solid strategic moat of consistent value creation through efficient capital deployment and strong returns above cost of capital. It offers a safer profile than Dover, albeit at a higher valuation. Pentair fits well within GARP portfolios seeking stable growth with quality.
If you prioritize dynamic operational efficiency and are comfortable navigating earnings variability, Dover appears compelling due to its robust cash conversion. However, if you seek better stability and proven value creation with less risk, Pentair outshines as the more prudent choice, commanding a premium for its steadier financial health.
Disclaimer: Investment carries a risk of loss of initial capital. The past performance is not a reliable indicator of future results. Be sure to understand risks before making an investment decision.
Go Further
I encourage you to read the complete analyses of Dover Corporation and Pentair plc to enhance your investment decisions: