Home > Comparison > Industrials > DOV vs PSN
The strategic rivalry between Dover Corporation and Parsons Corporation shapes the Industrials sector’s evolution. Dover operates as a diversified industrial machinery provider with strong exposure to equipment and digital solutions. Parsons focuses on integrated defense and critical infrastructure services, emphasizing technology and cybersecurity. This analysis contrasts their operational models and competitive moats to identify which offers superior risk-adjusted returns for a diversified portfolio amid an increasingly complex industrial landscape.
Table of contents
Companies Overview
Dover Corporation and Parsons Corporation shape critical industrial and defense markets with distinct approaches.
Dover Corporation: Industrial Equipment Innovator
Dover Corporation dominates industrial machinery by supplying equipment, components, and digital solutions globally. Its revenue stems from diversified segments including engineered products, clean energy fueling, imaging, pumps, and climate technologies. In 2026, Dover’s strategic focus targets expanding aftermarket services and digital integration to enhance customer retention and operational efficiency.
Parsons Corporation: Defense and Infrastructure Specialist
Parsons Corporation excels in integrated defense and critical infrastructure solutions. It generates revenue from federal contracts in cybersecurity, geospatial intelligence, missile defense, and infrastructure management. In 2026, Parsons emphasizes advancing cybersecurity platforms and smart infrastructure systems to meet evolving government and public-sector demands.
Strategic Collision: Similarities & Divergences
Both companies operate in industrial sectors but diverge sharply in business philosophy: Dover pursues broad industrial diversification, while Parsons focuses on specialized federal and critical infrastructure contracts. Their primary battleground lies in technology-driven service innovation. Dover offers a steady industrial play with aftermarket strengths; Parsons presents a growth profile tied to government spending and advanced defense technology.
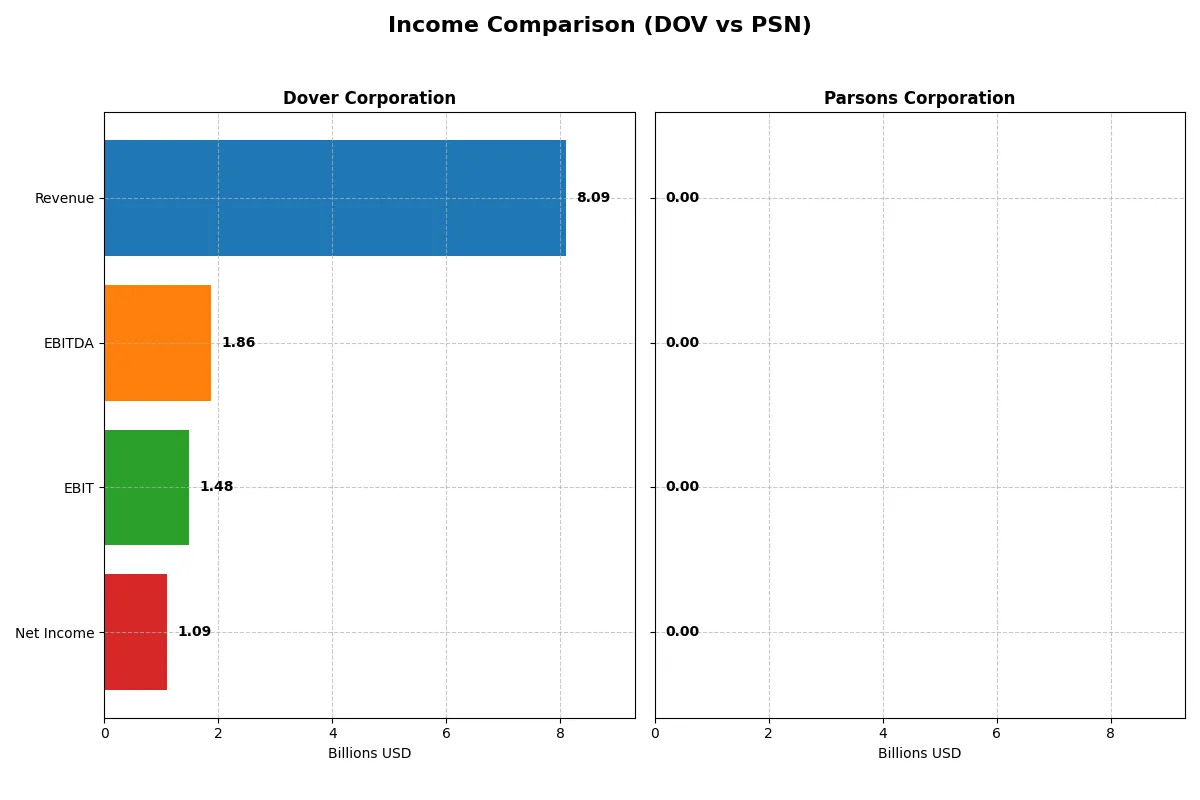
Income Statement Comparison
This data dissects the core profitability and scalability of both corporate engines to reveal who dominates the bottom line:
| Metric | Dover Corporation (DOV) | Parsons Corporation (PSN) |
|---|---|---|
| Revenue | 8.1B | 100K |
| Cost of Revenue | 4.9B | 0 |
| Operating Expenses | 1.8B | 16K |
| Gross Profit | 3.2B | 0 |
| EBITDA | 1.9B | 6.6K |
| EBIT | 1.5B | 0 |
| Interest Expense | 110M | -800 |
| Net Income | 1.1B | 3.8K |
| EPS | 7.97 | 0 |
| Fiscal Year | 2025 | 2025 |
Income Statement Analysis: The Bottom-Line Duel
This income statement comparison reveals which company’s financial engine runs more efficiently and sustainably over recent years.
Dover Corporation Analysis
Dover’s revenue hovered around 7.7B–8.1B from 2021 to 2025, with net income fluctuating near 1B in the last fiscal year. Its gross margin remains strong at 39.8%, but net margin slid to 13.5%. Despite a 4.5% revenue increase in 2025, EBIT and net income declined, signaling margin pressure and operational challenges.
Parsons Corporation Analysis
Parsons posted a steep decline in 2025, with revenue collapsing to just 100K from over 6.7B in 2024. Gross profit and EBIT fell to zero, wiping out operating momentum. The net margin held a modest 3.8%, but this followed a near-total revenue wipeout, reflecting severe disruption in earnings capacity.
Revenue Resilience vs. Collapse Risk
Dover sustains sizable revenue and better margin health despite recent setbacks, while Parsons faces a near-complete revenue collapse that undermines profit stability. Dover’s scale and margin control offer a clearer fundamental advantage. Investors favor steadier earnings profiles over volatile, collapsing revenue streams.
Financial Ratios Comparison
These vital ratios act as a diagnostic tool to expose the underlying fiscal health, valuation premiums, and capital efficiency of the companies compared below:
| Ratios | Dover Corporation (DOV) | Parsons Corporation (PSN) |
|---|---|---|
| ROE | 14.8% | 0.00014% |
| ROIC | 9.4% | 0.00015% |
| P/E | 24.5 | N/A |
| P/B | 3.62 | N/A |
| Current Ratio | 1.79 | 1.75 |
| Quick Ratio | 1.28 | 1.75 |
| D/E (Debt-to-Equity) | 0.45 | 0.52 |
| Debt-to-Assets | 24.8% | 23.9% |
| Interest Coverage | 12.5 | -8.25 |
| Asset Turnover | 0.60 | 0.000017 |
| Fixed Asset Turnover | 7.23 | 0.00036 |
| Payout ratio | 25.9% | 0% |
| Dividend yield | 1.06% | 0% |
| Fiscal Year | 2025 | 2025 |
Efficiency & Valuation Duel: The Vital Signs
Financial ratios act as the company’s DNA, uncovering hidden risks and operational strengths vital for informed investment decisions.
Dover Corporation
Dover posts a solid 14.8% ROE and a healthy 13.5% net margin, reflecting consistent profitability. Its P/E at 24.5 suggests a fairly valued stock in line with sector norms. The 1.06% dividend yield rewards shareholders, while moderate reinvestment in R&D supports sustainable growth.
Parsons Corporation
Parsons struggles with negligible ROE and net margin around 3.8%, signaling weak profitability. The absence of a dividend and near-zero returns highlight operational inefficiency. Although its current and quick ratios are favorable, valuation metrics are unavailable, limiting traditional value assessment.
Operational Strength vs. Profitability Challenge
Dover offers a balanced profile with moderate valuation and clear profitability, while Parsons presents significant profitability concerns despite solid liquidity. Investors prioritizing stable returns and operational resilience may find Dover a more fitting choice. Parsons may appeal only to those seeking turnaround potential under high risk.
Which one offers the Superior Shareholder Reward?
I see Dover Corporation (DOV) balances dividends and buybacks, yielding ~1.06% with a 26% payout ratio and strong FCF coverage. Parsons Corporation (PSN) pays no dividends but reinvests heavily in growth, supported by improving margins and zero payout. DOV’s steady buybacks enhance returns, while PSN’s reinvestment drives future potential. I judge Dover offers a more attractive total return profile in 2026, blending income and capital appreciation with greater distribution sustainability.
Comparative Score Analysis: The Strategic Profile
The radar chart reveals the fundamental DNA and trade-offs of Dover Corporation and Parsons Corporation, highlighting their financial strengths and valuation nuances:
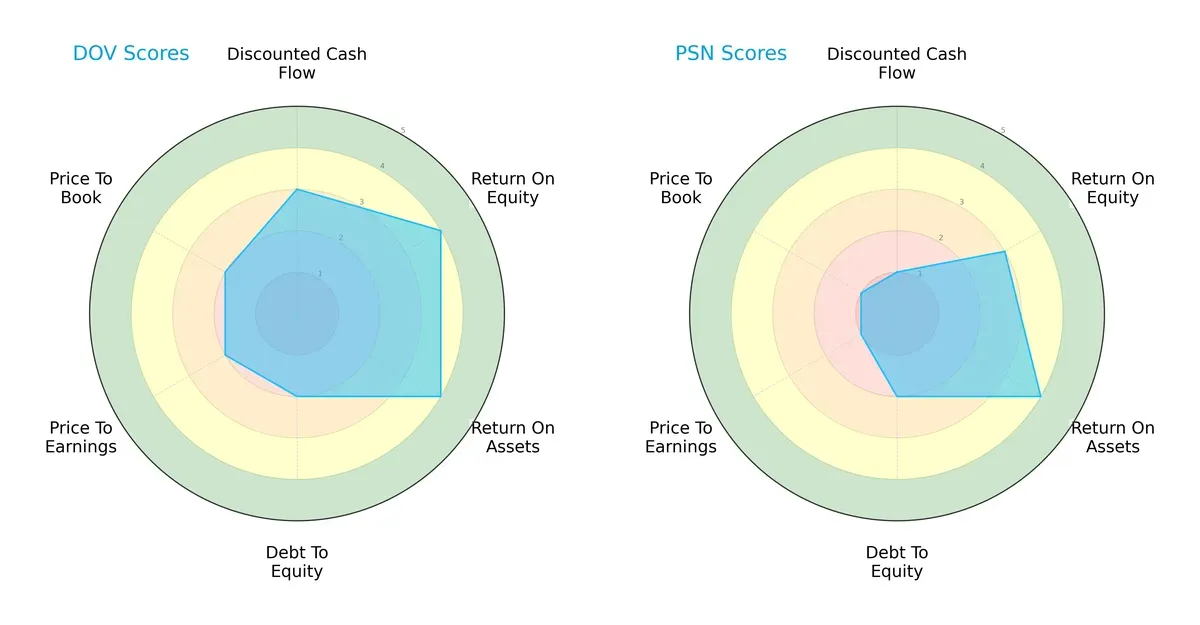
Dover shows a more balanced profile with moderate DCF and strong ROE and ROA scores, but suffers from weak valuation metrics. Parsons relies heavily on asset efficiency but scores poorly on DCF and valuation, reflecting riskier perceived growth. Dover’s diversified strengths offer a steadier investment base.
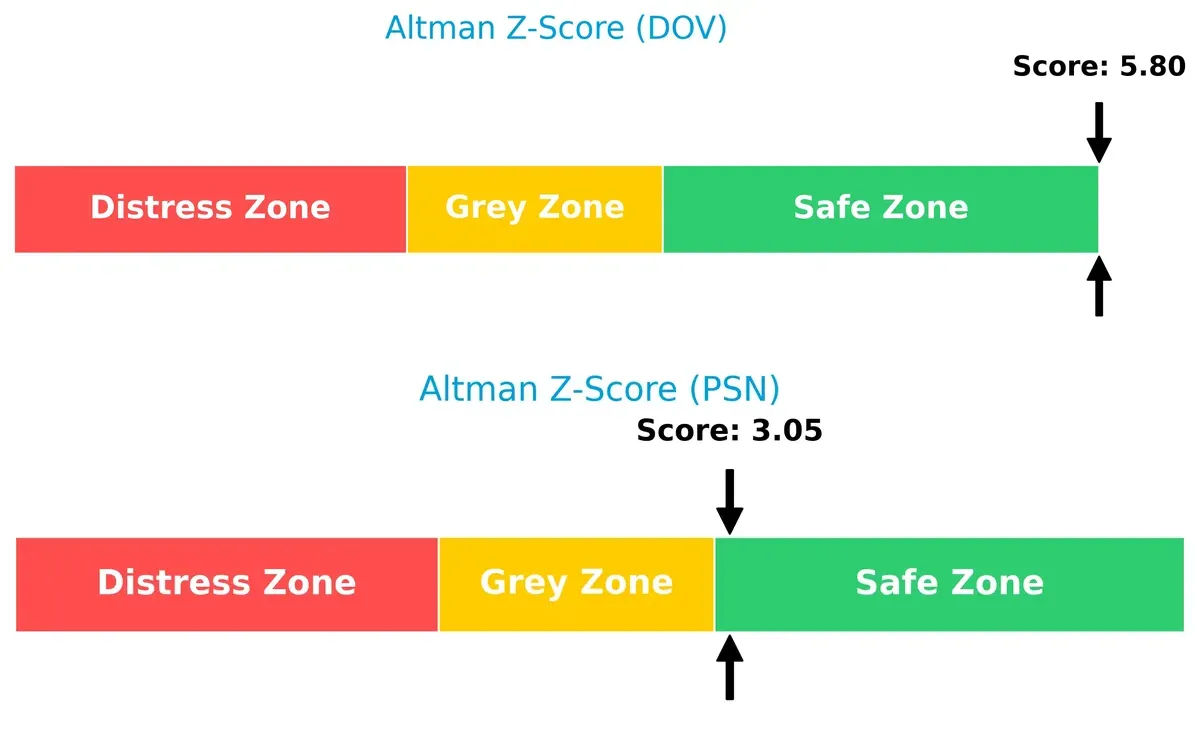
Bankruptcy Risk: Solvency Showdown
Dover’s Altman Z-Score of 5.80 significantly outpaces Parsons’ 3.05, signaling stronger solvency and lower bankruptcy risk in this economic cycle:
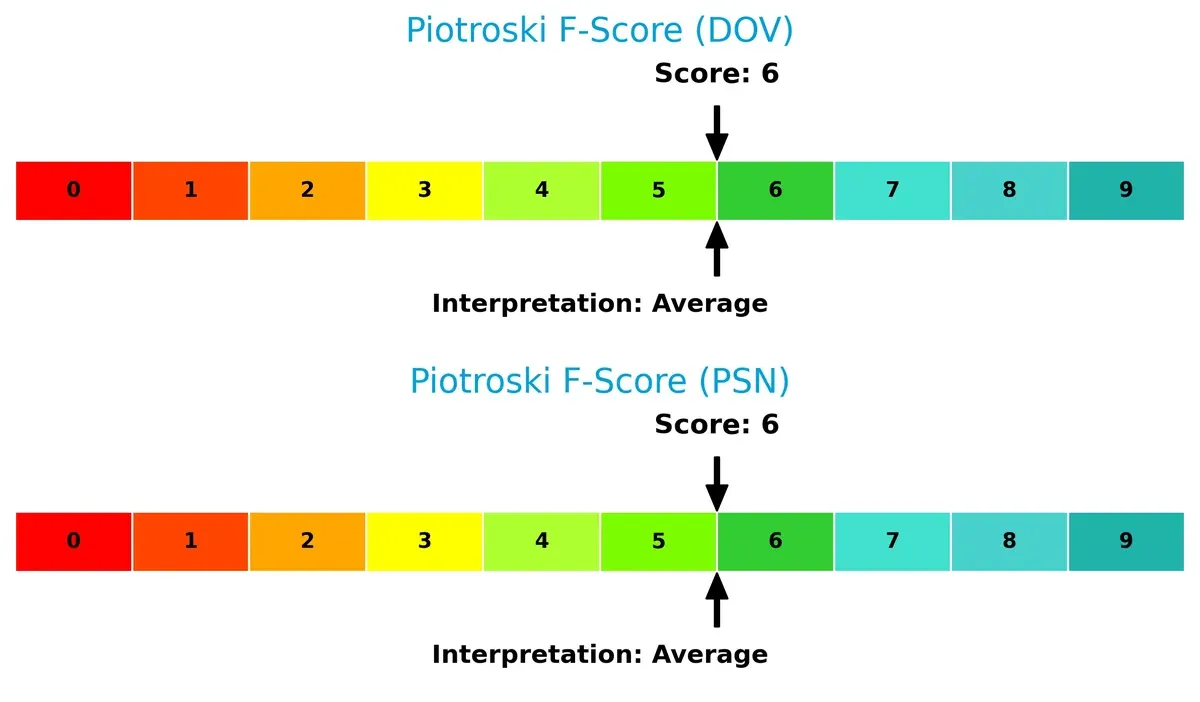
Financial Health: Quality of Operations
Both companies score a 6 on the Piotroski F-Score, indicating average financial health without glaring red flags in operational quality:
How are the two companies positioned?
This section dissects Dover and Parsons’ operational DNA by comparing revenue distribution and internal strengths and weaknesses. The goal is to confront their economic moats, revealing which model delivers the most resilient competitive advantage today.
Revenue Segmentation: The Strategic Mix
This visual comparison dissects how Dover Corporation and Parsons Corporation diversify their income streams and reveals their primary sector bets:
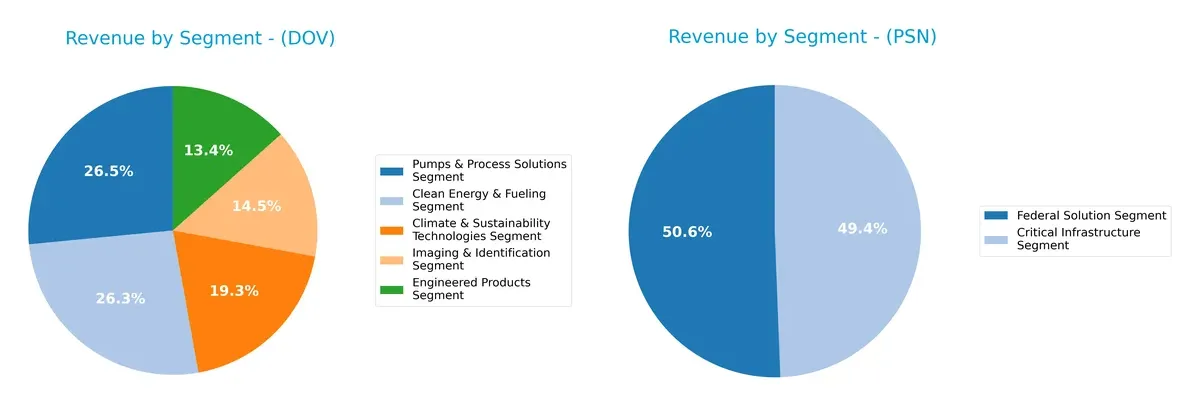
Dover exhibits a well-balanced revenue mix, with Pumps & Process Solutions leading at $2.15B and Clean Energy close behind at $2.13B. Its five segments range from $1.1B to $2.15B, showcasing diversification that mitigates concentration risk. Parsons, by contrast, pivots heavily on Federal Solutions at $3.22B and Critical Infrastructure near $3.14B, reflecting a focused defense and infrastructure play. Dover’s broad portfolio suggests resilience; Parsons banks on sector specialization and government contracts.
Strengths and Weaknesses Comparison
This table compares the Strengths and Weaknesses of Dover Corporation and Parsons Corporation:
Dover Corporation Strengths
- Diverse product segments with five key areas
- Favorable net margin at 13.52%
- Strong liquidity ratios (current 1.79, quick 1.28)
- Low debt-to-assets at 24.79%
- Solid interest coverage at 13.52
Parsons Corporation Strengths
- Favorable WACC at 2.19%
- Strong current and quick ratios at 1.75 each
- Favorable price and book multiples (PE and PB)
- Significant revenue from North America and Middle East
Dover Corporation Weaknesses
- Unfavorable price-to-book ratio at 3.62
- Neutral ROE and ROIC near cost of capital
- Moderate asset turnover at 0.6
Parsons Corporation Weaknesses
- Unfavorable net margin at 3.8%
- Zero ROE and ROIC indicating no profitability
- Negative interest coverage
- Zero asset and fixed asset turnover
- No dividend yield
Dover’s strengths lie in diversified product lines and solid financial health, supporting stable operations. Parsons shows financial fragility in profitability and asset efficiency despite strong liquidity and favorable capital costs. These profiles shape each company’s strategic focus on operational efficiency and capital management.
The Moat Duel: Analyzing Competitive Defensibility
A structural moat shields long-term profits from relentless competition erosion. Its nature defines which firm can sustain advantage:
Dover Corporation: Diverse Industrial Engineering Moat
Dover leverages intangible assets and cost advantages across multiple industrial segments, reflected in stable 39.8% gross margin and 13.5% net margin. However, declining ROIC signals margin pressure. Expanding clean energy and digital solutions in 2026 could deepen this moat if operational efficiency improves.
Parsons Corporation: Specialized Defense and Infrastructure Moat
Parsons relies on high barriers in defense contracts and technology integration, unlike Dover’s industrial breadth. Yet, its shrinking ROIC and zero gross margin in 2025 reveal weakening financial defensibility. Growth in cybersecurity and space systems offers market disruption potential, but profitability must recover to sustain its moat.
Industrial Diversification vs. Defense Specialization: Which Moat Holds?
Dover’s broader industrial footprint and stronger margin profile create a wider moat than Parsons’ niche defense focus. Despite challenges, Dover is better positioned to defend market share through diversified innovation and scale. Parsons faces tougher hurdles to regain value creation amid profitability declines.
Which stock offers better returns?
The past year reveals stark contrasts: Dover Corporation surged over 30%, accelerating its gains, while Parsons Corporation retreated sharply, reflecting a decelerating downtrend.
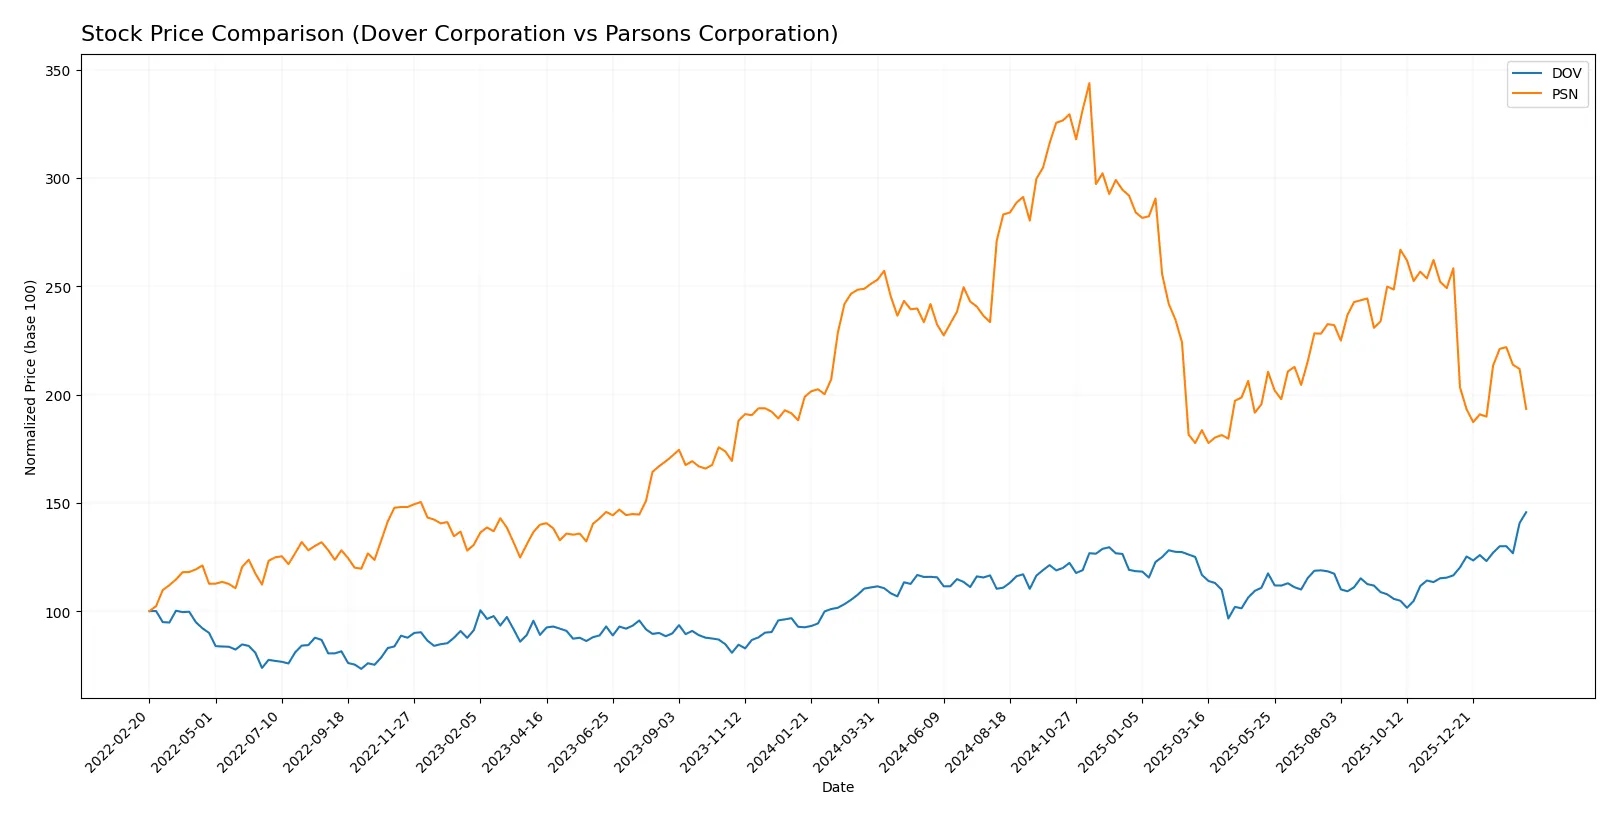
Trend Comparison
Dover Corporation’s stock rose 31.3% over the past 12 months, showing a bullish trend with accelerating momentum and a high near 231.63. Volatility remains elevated with a 12.76 std deviation.
Parsons Corporation’s stock fell 23.0% in the same period, marking a bearish trend with deceleration. It reached a low of 58.22, accompanied by slightly higher volatility at 13.2 std deviation.
Dover clearly outperformed Parsons, delivering the highest market returns with sustained acceleration, while Parsons struggled with persistent losses and decelerating decline.
Target Prices
Analysts present a clear target price range for Dover Corporation and Parsons Corporation, reflecting measured optimism.
| Company | Target Low | Target High | Consensus |
|---|---|---|---|
| Dover Corporation | 195 | 256 | 223.7 |
| Parsons Corporation | 78 | 104 | 86.8 |
The consensus target for Dover at 223.7 is slightly below its current 231.63 price, suggesting limited upside. Parsons shows a wider gap, with a consensus target 37% above its 63.38 price, indicating stronger growth expectations.

Don’t Let Luck Decide Your Entry Point
Optimize your entry points with our advanced ProRealTime indicators. You’ll get efficient buy signals with precise price targets for maximum performance. Start outperforming now!
How do institutions grade them?
Dover Corporation Grades
The following table shows recent institutional grades for Dover Corporation:
| Grading Company | Action | New Grade | Date |
|---|---|---|---|
| JP Morgan | Maintain | Overweight | 2026-01-30 |
| Wells Fargo | Maintain | Equal Weight | 2026-01-30 |
| RBC Capital | Maintain | Sector Perform | 2026-01-30 |
| Oppenheimer | Maintain | Outperform | 2026-01-26 |
| JP Morgan | Maintain | Overweight | 2026-01-16 |
| Barclays | Maintain | Equal Weight | 2026-01-07 |
| Wells Fargo | Maintain | Equal Weight | 2026-01-07 |
| UBS | Upgrade | Buy | 2026-01-05 |
| Wells Fargo | Maintain | Equal Weight | 2025-12-15 |
| Oppenheimer | Maintain | Outperform | 2025-11-14 |
Parsons Corporation Grades
The following table shows recent institutional grades for Parsons Corporation:
| Grading Company | Action | New Grade | Date |
|---|---|---|---|
| UBS | Maintain | Buy | 2026-02-12 |
| Truist Securities | Maintain | Buy | 2026-02-12 |
| Keybanc | Maintain | Overweight | 2026-02-12 |
| Barclays | Maintain | Overweight | 2026-01-23 |
| Keybanc | Maintain | Overweight | 2026-01-20 |
| UBS | Maintain | Buy | 2026-01-15 |
| Citigroup | Maintain | Buy | 2026-01-13 |
| B of A Securities | Maintain | Buy | 2025-12-30 |
| Stifel | Maintain | Buy | 2025-12-23 |
| Jefferies | Maintain | Hold | 2025-12-11 |
Which company has the best grades?
Parsons Corporation consistently receives Buy and Overweight ratings, showing stronger institutional confidence. Dover Corporation’s grades range from Equal Weight to Outperform, with fewer Buy upgrades. Investors may view Parsons as currently favored by analysts.
Risks specific to each company
In the volatile 2026 market, these categories reveal the critical pressure points and systemic threats facing both Dover Corporation and Parsons Corporation:
1. Market & Competition
Dover Corporation
- Faces intense competition in industrial machinery with a diversified product portfolio but must innovate to sustain growth.
Parsons Corporation
- Operates in defense and critical infrastructure sectors, facing government budget dependency and competitive bidding pressures.
2. Capital Structure & Debt
Dover Corporation
- Maintains a conservative debt-to-equity ratio of 0.45, with strong interest coverage indicating low financial risk.
Parsons Corporation
- Slightly higher debt-to-equity at 0.52, but negative interest coverage raises red flags on debt servicing capacity.
3. Stock Volatility
Dover Corporation
- Beta of 1.29 signals above-market volatility, reflecting sensitivity to industrial sector cycles.
Parsons Corporation
- Beta at 0.67 suggests below-market volatility, potentially due to defense sector stability and contract structures.
4. Regulatory & Legal
Dover Corporation
- Subject to industrial and environmental regulations, especially in clean energy and manufacturing segments.
Parsons Corporation
- Faces stringent defense and cybersecurity regulations, with potential risks from contract compliance and government policy shifts.
5. Supply Chain & Operations
Dover Corporation
- Global supply chain complexity in machinery and components demands operational agility to mitigate disruptions.
Parsons Corporation
- Critical infrastructure projects require robust supply chains; geopolitical tensions may threaten timely delivery.
6. ESG & Climate Transition
Dover Corporation
- Invests in clean energy technologies, positioning itself well for climate transition pressures.
Parsons Corporation
- ESG risks stem from defense-related activities and environmental impact of infrastructure projects.
7. Geopolitical Exposure
Dover Corporation
- Primarily US-focused with some international exposure; geopolitical risks moderate in industrial markets.
Parsons Corporation
- High exposure to international defense contracts, increasing vulnerability to geopolitical instability.
Which company shows a better risk-adjusted profile?
Dover’s strongest risk is market competition amidst industrial innovation demands. Parsons faces critical financial risk from weak debt servicing and geopolitical uncertainties. Dover’s safer capital structure and better financial health grant it a more favorable risk-adjusted profile. Parsons’ negative interest coverage and reliance on defense contracts heighten its vulnerability in 2026.
Final Verdict: Which stock to choose?
Dover Corporation’s superpower lies in its resilient operational efficiency and strong free cash flow generation, signaling disciplined capital allocation. Its point of vigilance remains a declining return on invested capital, which may challenge future value creation. Dover suits portfolios aiming for steady income with moderate growth exposure.
Parsons Corporation’s strategic moat is its focus on specialized government and infrastructure contracts, providing recurring revenue potential and defensible market positioning. It exhibits a safer liquidity profile relative to Dover but struggles with profitability and value creation. Parsons might fit investors prioritizing stability in niche sectors over rapid growth.
If you prioritize operational efficiency and steady cash generation, Dover outshines with stronger cash flow dynamics despite some profitability erosion. However, if you seek exposure to specialized contract-driven stability, Parsons offers better downside protection but with a trade-off in value creation and growth. Each choice aligns with distinct risk-reward profiles.
Disclaimer: Investment carries a risk of loss of initial capital. The past performance is not a reliable indicator of future results. Be sure to understand risks before making an investment decision.
Go Further
I encourage you to read the complete analyses of Dover Corporation and Parsons Corporation to enhance your investment decisions: