Home > Comparison > Industrials > PH vs DOV
The strategic rivalry between Parker-Hannifin Corporation and Dover Corporation shapes the industrial machinery sector’s evolution. Parker-Hannifin, a diversified industrial and aerospace systems leader, contrasts with Dover’s multi-segment model spanning engineered products and clean energy solutions. This head-to-head pits broad industrial integration against specialized segment innovation. This analysis aims to identify which company’s trajectory delivers superior risk-adjusted returns for a diversified portfolio navigating cyclical industrial markets.
Table of contents
Companies Overview
Parker-Hannifin and Dover stand as significant players in industrial machinery, shaping their sectors with distinct approaches.
Parker-Hannifin Corporation: Industrial Motion and Control Leader
Parker-Hannifin excels as a global motion and control technology provider. It generates revenue through diversified industrial and aerospace systems, delivering hydraulic, pneumatic, and electromechanical components to OEMs. In 2026, its strategic focus remains on expanding advanced sealing, filtration, and aerospace system capabilities, reinforcing its competitive edge in precision engineering.
Dover Corporation: Diverse Industrial Equipment Innovator
Dover operates as a multifaceted industrial machinery company, providing equipment, consumables, and digital solutions across sectors like clean energy and aerospace. Its revenue streams come from engineered products, pumps, and climate technologies. The 2026 strategy targets growth in clean energy and digital integration, emphasizing sustainable and automated solutions to capture emerging market demand.
Strategic Collision: Similarities & Divergences
Both firms compete in industrial machinery but diverge in philosophy: Parker-Hannifin focuses on specialized motion control, while Dover emphasizes broad-spectrum industrial and clean energy equipment. Their primary battleground is innovation in components and systems for critical industrial applications. Parker-Hannifin offers a focused precision moat; Dover presents a diversified portfolio—each appealing to different risk and growth profiles.
Income Statement Comparison
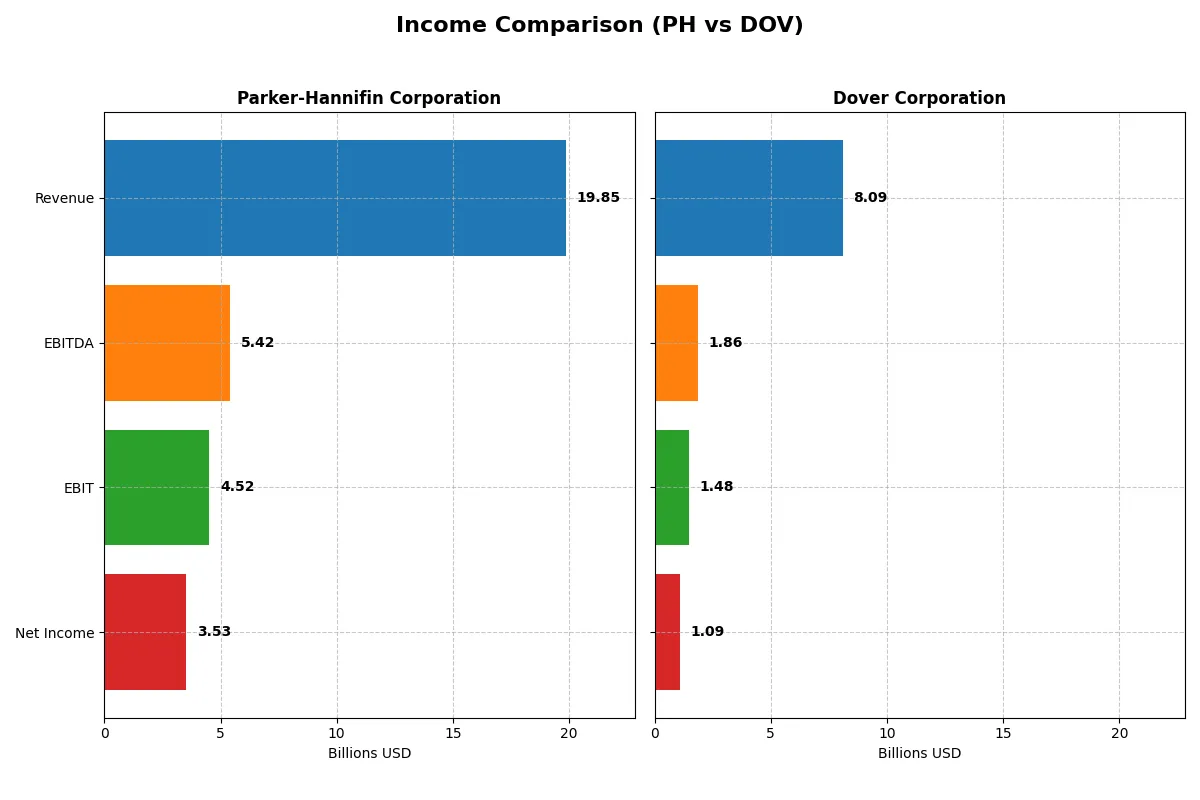
This data dissects the core profitability and scalability of both corporate engines to reveal who dominates the bottom line:
| Metric | Parker-Hannifin (PH) | Dover Corporation (DOV) |
|---|---|---|
| Revenue | 19.85B | 8.09B |
| Cost of Revenue | 12.54B | 4.87B |
| Operating Expenses | 3.26B | 1.84B |
| Gross Profit | 7.32B | 3.22B |
| EBITDA | 5.42B | 1.86B |
| EBIT | 4.52B | 1.48B |
| Interest Expense | 409M | 110M |
| Net Income | 3.53B | 1.09B |
| EPS | 27.52 | 7.97 |
| Fiscal Year | 2025 | 2025 |
Income Statement Analysis: The Bottom-Line Duel
This income statement comparison reveals which company runs the more efficient and profitable corporate engine in recent years.
Parker-Hannifin Corporation Analysis
Parker-Hannifin’s revenue grew steadily from 14.3B in 2021 to 19.85B in 2025, while net income more than doubled to 3.53B. Its gross margin holds firm near 37%, and net margin expanded to 17.8%, signaling strong cost control. The 2025 fiscal year showed solid EBIT growth of 10%, reflecting improving operational efficiency.
Dover Corporation Analysis
Dover’s revenue remained flat around 7.9B in 2021 and 8.1B in 2025, with net income slipping slightly to 1.09B. Despite a higher gross margin near 40%, its EBIT margin declined to 18.3%, and net margin fell to 13.5%. The latest year revealed negative EBIT growth of 21%, indicating pressure on profitability and operational challenges.
Margin Command vs. Revenue Momentum
Parker-Hannifin delivers superior margin expansion and robust net income growth, outpacing Dover’s stagnant revenue and deteriorating profitability. The clear fundamental winner is Parker-Hannifin, whose efficient cost structure and accelerating earnings growth present a more attractive profile for investors seeking durable profitability.
Financial Ratios Comparison
These vital ratios act as a diagnostic tool to expose the underlying fiscal health, valuation premiums, and capital efficiency of the companies analyzed:
| Ratios | Parker-Hannifin (PH) | Dover Corporation (DOV) |
|---|---|---|
| ROE | 25.8% | 38.8% |
| ROIC | 13.7% | 8.9% |
| P/E | 25.4 | 24.5 |
| P/B | 6.5 | N/A |
| Current Ratio | 1.19 | 0 |
| Quick Ratio | 0.71 | 0 |
| D/E | 0.69 | 0 |
| Debt-to-Assets | 32.2% | 0 |
| Interest Coverage | 9.93 | 12.51 |
| Asset Turnover | 0.67 | 0 |
| Fixed Asset Turnover | 6.76 | 0 |
| Payout Ratio | 24.4% | 25.9% |
| Dividend Yield | 0.96% | 1.06% |
| Fiscal Year | 2025 | 2025 |
Efficiency & Valuation Duel: The Vital Signs
Ratios serve as a company’s DNA, uncovering hidden risks and operational excellence essential for investment decisions.
Parker-Hannifin Corporation
Parker-Hannifin delivers strong profitability with a 25.8% ROE and a solid 17.8% net margin, signaling efficient operations. However, its P/E of 25.4 and P/B of 6.55 suggest a somewhat stretched valuation. The modest 0.96% dividend yield contrasts with steady reinvestment in growth and innovation, supporting durable shareholder value.
Dover Corporation
Dover posts a favorable 13.5% net margin but its ROE and ROIC data are unavailable, raising questions about core profitability. The stock trades at a neutral P/E of 24.5 while showing a slightly better dividend yield of 1.06%. Limited financial data and weaker operational metrics hint at higher uncertainty and uneven efficiency compared to peers.
Premium Valuation vs. Operational Safety
Parker-Hannifin balances strong profitability and operational efficiency but at a premium valuation. Dover’s limited profitability insight and uneven metrics increase risk despite a modest dividend. Investors prioritizing proven operational strength may favor Parker-Hannifin, while those accepting uncertainty for potential yield might consider Dover.
Which one offers the Superior Shareholder Reward?
I see Parker-Hannifin (PH) pays a higher dividend yield near 1.0% with a steady payout ratio around 24%, backed by robust free cash flow coverage (around 88%). Its buyback effort is active, enhancing total returns sustainably. Dover (DOV) yields about 1.1% with a lower payout ratio near 26%, but free cash flow coverage is weaker (~78%), and buybacks appear less aggressive. PH’s consistent dividend and stronger free cash flow support create a more sustainable, superior shareholder reward in 2026.
Comparative Score Analysis: The Strategic Profile
The radar chart reveals the fundamental DNA and trade-offs of Parker-Hannifin and Dover, highlighting their operational efficiency and valuation nuances:
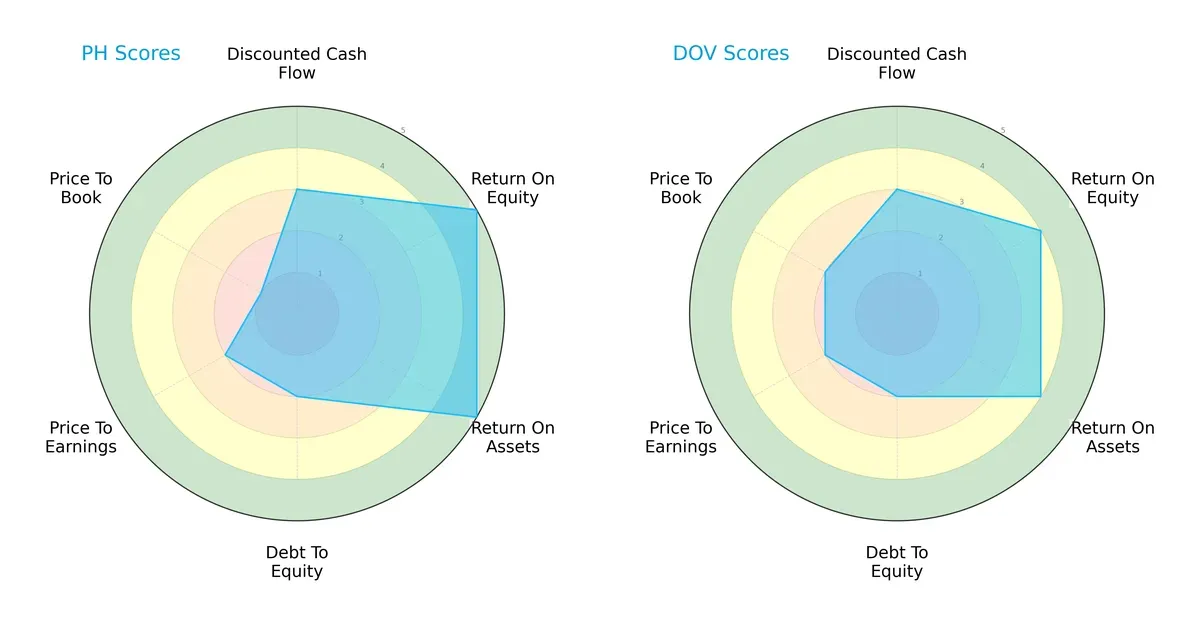
Parker-Hannifin scores higher on ROE (5 vs. 4) and ROA (5 vs. 4), showing superior profitability and asset utilization. Both firms have moderate DCF and Debt/Equity scores (3 and 2 respectively). Dover edges slightly on Price-to-Book valuation (2 vs. 1), suggesting better market pricing discipline. Overall, Parker-Hannifin has a more pronounced profitability edge, while Dover presents a more balanced valuation profile.
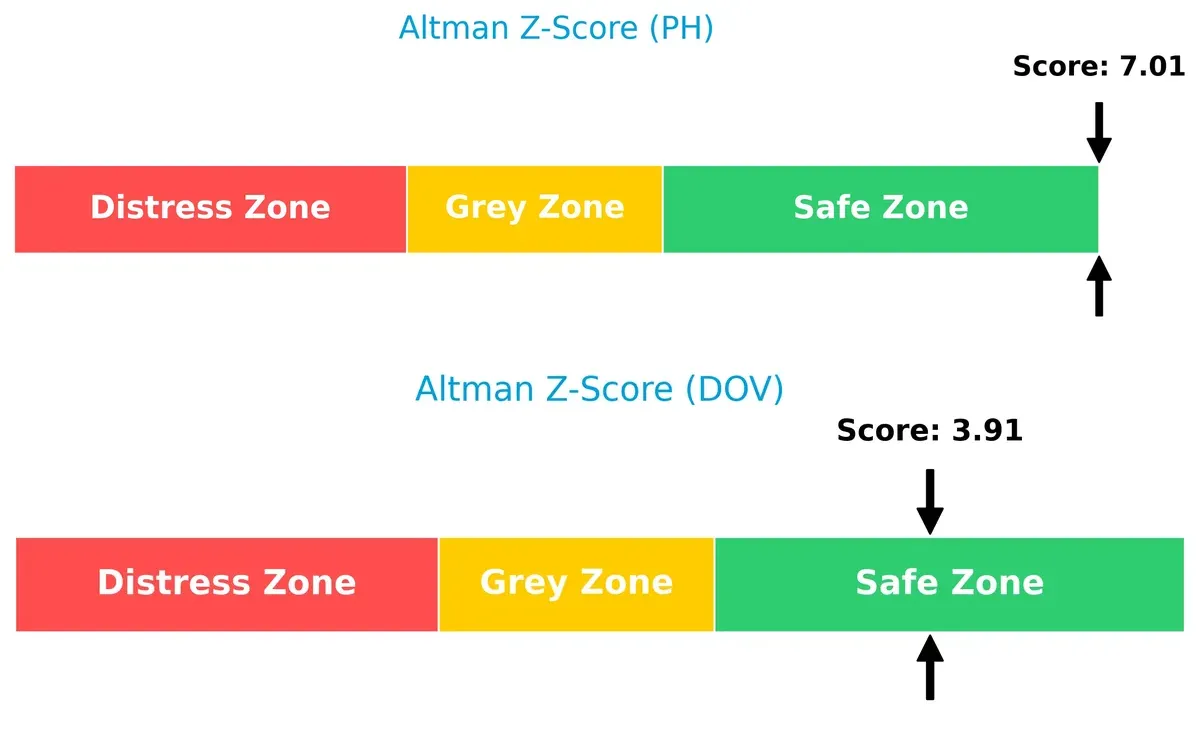
Bankruptcy Risk: Solvency Showdown
Parker-Hannifin’s Altman Z-Score of 7.01 far exceeds Dover’s 3.91, firmly placing both in the safe zone but underscoring Parker-Hannifin’s stronger buffer against financial distress in this market cycle:
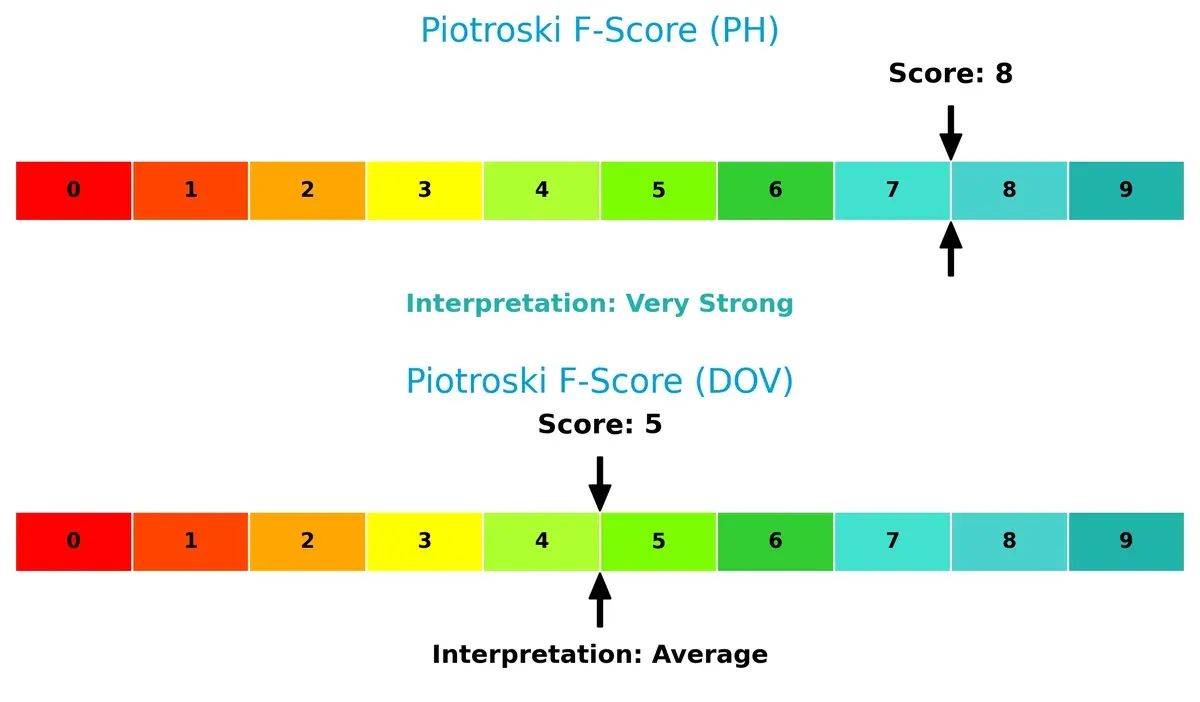
Financial Health: Quality of Operations
With a Piotroski F-Score of 8 versus Dover’s 5, Parker-Hannifin demonstrates superior internal financial health and operational quality. Dover’s average score signals caution, indicating potential red flags in profitability or efficiency metrics:
How are the two companies positioned?
This section dissects the operational DNA of PH and DOV by comparing their revenue distribution by segment and internal dynamics. The goal is to confront their economic moats and identify which model offers the most resilient competitive advantage today.
Revenue Segmentation: The Strategic Mix
The following visual comparison dissects how Parker-Hannifin Corporation and Dover Corporation diversify their income streams and where their primary sector bets lie:
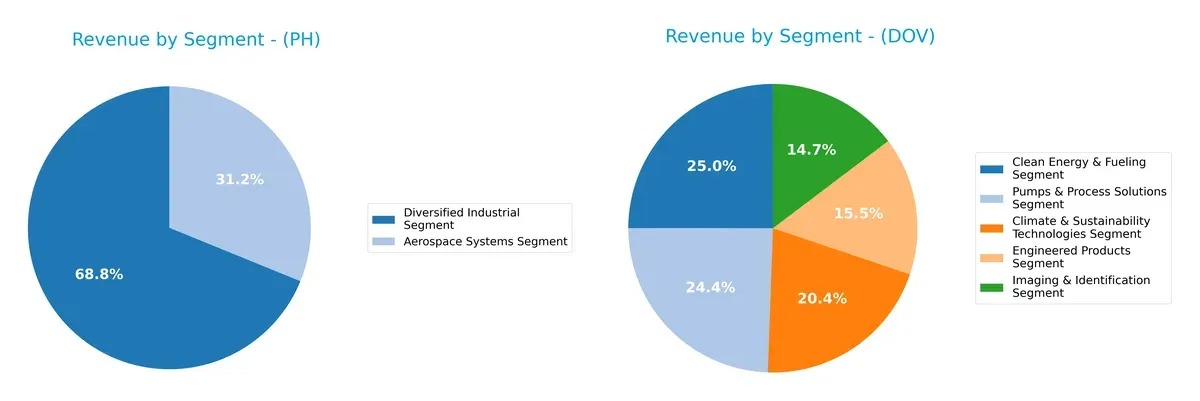
Parker-Hannifin pivots mainly on two segments: $13.7B in Diversified Industrial and $6.2B in Aerospace Systems, showing moderate diversification. Dover exhibits a broader spread across five segments, each around $1.1B to $1.9B, reflecting a well-balanced portfolio. Parker-Hannifin’s concentration risks tie to industrial cycles, while Dover’s diversified mix reduces dependency on any single market, enhancing resilience amid sector volatility.
Strengths and Weaknesses Comparison
This table compares the Strengths and Weaknesses of Parker-Hannifin Corporation (PH) and Dover Corporation (DOV):
PH Strengths
- Strong profitability with 17.79% net margin
- High ROE of 25.81%
- Favorable fixed asset turnover of 6.76
- Diversified revenue from Aerospace and Industrial segments
- Significant global presence in North America, Europe, Asia Pacific
DOV Strengths
- Favorable net margin of 13.52%
- Low debt-to-equity and debt-to-assets ratios
- Favorable interest coverage ratio of 13.52
- Diversified segments including Clean Energy, Climate & Sustainability
- Global footprint including US, Europe, Asia, Americas
PH Weaknesses
- Unfavorable valuation metrics: PE 25.38, PB 6.55
- Quick ratio low at 0.71 signals liquidity risk
- Dividend yield below 1%
- Moderate debt level with neutral leverage ratios
- Asset turnover only neutral at 0.67
DOV Weaknesses
- Zero ROE and ROIC indicate profitability concerns
- Unavailable WACC data complicates cost of capital assessment
- Unfavorable liquidity ratios, current and quick ratios at 0
- Asset turnover and fixed asset turnover unavailable or zero
- Higher proportion of unfavorable financial ratios overall
PH benefits from robust profitability and asset efficiency, supported by diversified industrial and aerospace operations. DOV shows strengths in capital structure and segment diversity but faces profitability and liquidity challenges. These factors suggest differing strategic priorities in financial management and growth focus for each company.
The Moat Duel: Analyzing Competitive Defensibility
A structural moat is the only reliable shield protecting long-term profits from relentless competitive erosion:
Parker-Hannifin Corporation: Precision Engineering with Durable Value Creation
I identify Parker-Hannifin’s moat in specialized motion and control technologies backed by high ROIC exceeding WACC by 4.4%, signaling efficient capital use. Its margin stability and growing profitability underscore a durable advantage. New aerospace and industrial product innovations in 2026 could deepen this moat further.
Dover Corporation: Diversified Industrial Footprint Facing Operational Headwinds
Dover’s moat lies in diversified equipment and aftermarket services but contrasts with Parker-Hannifin’s precision focus. Dover’s declining ROIC trend signals weakening capital efficiency. Despite solid gross margins, recent negative EBIT and net margin growth highlight risks. Expansion into clean energy and digital solutions offers potential upside.
Precision Engineering vs. Diversified Industrial Services: Who Defends Better?
Parker-Hannifin holds the deeper, more durable moat, demonstrated by sustained excess returns and margin resilience. Dover’s weakening ROIC and profitability trends expose vulnerability. Parker-Hannifin is better equipped to defend and grow its market share amid industry challenges.
Which stock offers better returns?
The past year reveals stark contrasts in price dynamics and trading activity between the two stocks, showcasing significant gains and varying buyer dominance.
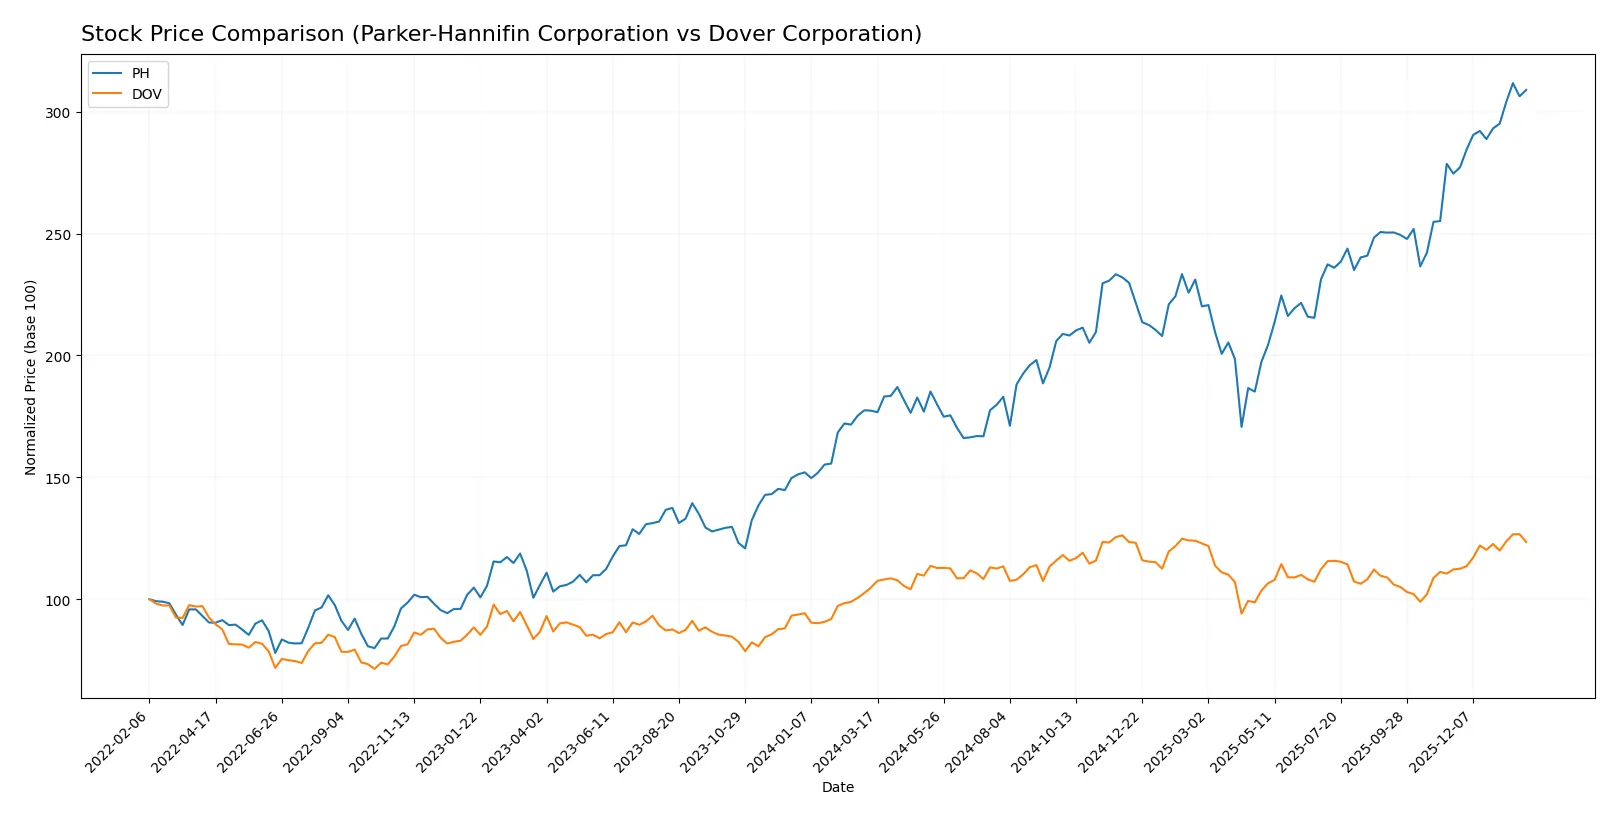
Trend Comparison
Parker-Hannifin Corporation’s stock gained 74.16% over the past year, marking a bullish trend with accelerating momentum and high volatility reflected in a 112.58 standard deviation.
Dover Corporation’s stock increased by 17.81% over the same period, also bullish with accelerating gains but exhibiting substantially lower volatility at 11.33 standard deviation.
Parker-Hannifin’s stock outperformed Dover’s with a much higher total return and stronger price acceleration, although it faces greater price fluctuation risks.
Target Prices
Analysts show a positive outlook for both Parker-Hannifin Corporation and Dover Corporation with solid target price ranges.
| Company | Target Low | Target High | Consensus |
|---|---|---|---|
| Parker-Hannifin Corporation | 825 | 1,139 | 995.46 |
| Dover Corporation | 195 | 256 | 221.38 |
The consensus targets for PH and DOV are 6% and 10% above current prices, reflecting analyst confidence in their industrial machinery market positions.

Don’t Let Luck Decide Your Entry Point
Optimize your entry points with our advanced ProRealTime indicators. You’ll get efficient buy signals with precise price targets for maximum performance. Start outperforming now!
How do institutions grade them?
Parker-Hannifin Corporation Grades
The table below summarizes recent grades from major financial institutions for Parker-Hannifin Corporation.
| Grading Company | Action | New Grade | Date |
|---|---|---|---|
| Wells Fargo | Maintain | Overweight | 2026-01-30 |
| Citigroup | Maintain | Buy | 2026-01-30 |
| JP Morgan | Maintain | Overweight | 2026-01-30 |
| Jefferies | Maintain | Buy | 2026-01-30 |
| Barclays | Maintain | Overweight | 2026-01-30 |
| Stifel | Maintain | Hold | 2026-01-30 |
| Morgan Stanley | Maintain | Equal Weight | 2026-01-14 |
Dover Corporation Grades
The table below summarizes recent grades from major financial institutions for Dover Corporation.
| Grading Company | Action | New Grade | Date |
|---|---|---|---|
| JP Morgan | Maintain | Overweight | 2026-01-30 |
| Wells Fargo | Maintain | Equal Weight | 2026-01-30 |
| RBC Capital | Maintain | Sector Perform | 2026-01-30 |
| Oppenheimer | Maintain | Outperform | 2026-01-26 |
| UBS | Upgrade | Buy | 2026-01-05 |
| Barclays | Maintain | Equal Weight | 2026-01-07 |
Which company has the best grades?
Parker-Hannifin consistently earns “Buy” and “Overweight” grades from top firms. Dover’s grades are more mixed, with several “Equal Weight” and “Sector Perform” ratings. Investors might see Parker-Hannifin as having stronger institutional confidence.
Risks specific to each company
The following categories identify the critical pressure points and systemic threats facing both firms in the 2026 market environment:
1. Market & Competition
Parker-Hannifin Corporation
- Operates in diverse industrial and aerospace sectors with strong market cap of $118B, facing intense OEM competition.
Dover Corporation
- Focused on engineered products and clean energy, smaller $27.6B market cap, contends with specialized niche rivals and evolving clean tech demands.
2. Capital Structure & Debt
Parker-Hannifin Corporation
- Moderate leverage with debt-to-assets at 32%, interest coverage strong at 11x; balanced risk profile.
Dover Corporation
- Minimal reported debt, favorable debt-equity metrics but incomplete liquidity ratios raise red flags on financial transparency.
3. Stock Volatility
Parker-Hannifin Corporation
- Beta of 1.25 indicates moderate sensitivity to market swings; wide price range $488-$965 signals substantial volatility.
Dover Corporation
- Slightly higher beta at 1.31 denotes greater volatility; price range $143-$222 reflects narrower but still notable fluctuations.
4. Regulatory & Legal
Parker-Hannifin Corporation
- Aerospace and industrial exposure subjects it to complex global compliance and safety regulations; potential for costly litigation.
Dover Corporation
- Diverse industrial operations and clean energy focus bring regulatory scrutiny, especially in environmental and safety standards.
5. Supply Chain & Operations
Parker-Hannifin Corporation
- Global supply chains vulnerable to geopolitical disruptions; reliance on OEMs amplifies operational risks.
Dover Corporation
- Broad product range and distributor network enhance resilience but also complicate logistics amid market shifts.
6. ESG & Climate Transition
Parker-Hannifin Corporation
- Industrial legacy may delay ESG adaptation; aerospace segment faces pressure to reduce carbon footprint.
Dover Corporation
- Clean Energy & Fueling segment positions Dover advantageously for climate transition but requires capital for innovation.
7. Geopolitical Exposure
Parker-Hannifin Corporation
- Global footprint in defense and aerospace makes it sensitive to geopolitical tensions and trade restrictions.
Dover Corporation
- International operations and clean energy focus expose it to evolving trade policies and geopolitical risks.
Which company shows a better risk-adjusted profile?
Parker-Hannifin’s most impactful risk lies in its complex global supply chains and regulatory environment, which could disrupt production. Dover’s biggest challenge is incomplete liquidity data, raising concerns about short-term financial health. Despite higher volatility, Parker-Hannifin’s strong Altman Z-Score (7.0) and Piotroski Score (8) reflect superior financial stability. Dover’s weaker Piotroski (5) and data gaps suggest a riskier profile. The 2025 financials highlight Parker-Hannifin’s robust profitability and leverage management as decisive advantages.
Final Verdict: Which stock to choose?
Parker-Hannifin’s superpower lies in its durable competitive advantage, evidenced by a rising ROIC well above its cost of capital. It efficiently converts capital into profits, making it a strong value creator. Its point of vigilance is the relatively high valuation multiples, which could pressure returns if growth slows. This stock suits portfolios targeting aggressive growth with a tolerance for premium pricing.
Dover’s strategic moat is its solid balance sheet and steady cash generation, offering a safer harbor amid market volatility. While its growth metrics and return on capital appear less robust than Parker-Hannifin’s, Dover provides relative stability and a moderate valuation profile. It fits well within GARP (Growth at a Reasonable Price) portfolios seeking balance between growth and risk.
If you prioritize durable competitive advantage and capital efficiency, Parker-Hannifin outshines with superior profitability and growth momentum, despite a higher valuation. However, if you seek better stability and a more conservative risk profile, Dover offers a compelling scenario for cautious investors aiming for steady income and capital preservation.
Disclaimer: Investment carries a risk of loss of initial capital. The past performance is not a reliable indicator of future results. Be sure to understand risks before making an investment decision.
Go Further
I encourage you to read the complete analyses of Parker-Hannifin Corporation and Dover Corporation to enhance your investment decisions: