Home > Comparison > Industrials > OTIS vs DOV
The strategic rivalry between Otis Worldwide Corporation and Dover Corporation shapes the Industrials sector’s momentum. Otis focuses on passenger and freight elevator manufacturing and extensive service operations, while Dover offers diversified engineered products spanning automation, clean energy, and precision equipment. This analysis pits Otis’s service-driven model against Dover’s multi-industry engineering approach to reveal which offers superior risk-adjusted returns for a diversified portfolio in today’s industrial landscape.
Table of contents
Companies Overview
Two industrial machinery giants, Otis Worldwide and Dover Corporation, anchor critical sectors in global infrastructure and manufacturing.
Otis Worldwide Corporation: Elevating Urban Mobility
Otis Worldwide dominates the elevator and escalator market, generating revenue through new equipment sales and extensive service contracts. Its strategic focus in 2026 emphasizes expanding its global service network, leveraging a vast workforce of 34,000 mechanics to maintain and modernize installations, ensuring recurring income and customer retention.
Dover Corporation: Diversified Industrial Solutions Leader
Dover Corporation excels in providing specialized equipment and components across diverse markets, including clean energy, industrial automation, and climate technologies. In 2026, Dover prioritizes innovation in digital solutions and sustainable technologies, broadening its footprint in aftermarket and industrial segments to capture emerging growth opportunities.
Strategic Collision: Similarities & Divergences
While both operate in industrial machinery, Otis commits to a service-heavy model centered on urban infrastructure, contrasting with Dover’s diversified portfolio targeting multiple industrial end-markets. Their competition focuses on innovation and operational efficiency, but their investment profiles diverge: Otis offers stable, service-based revenue streams; Dover presents growth through technological diversification and market expansion.
Income Statement Comparison
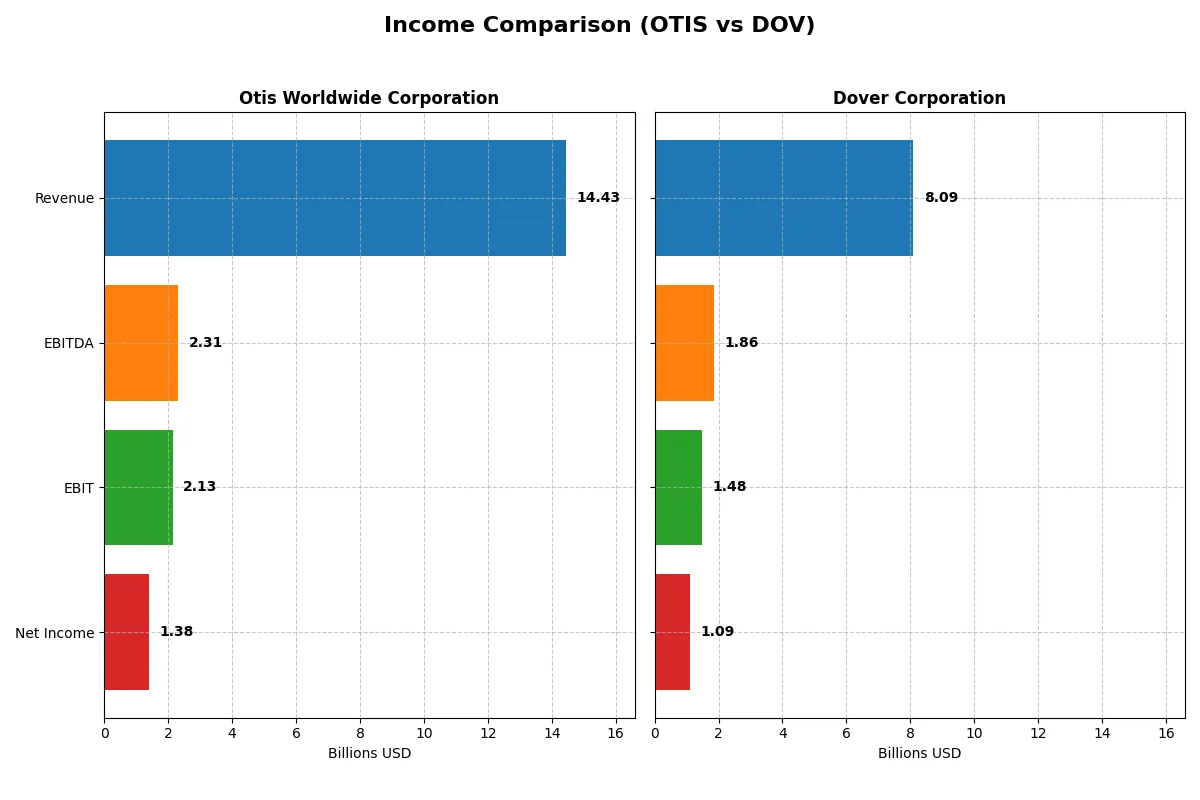
This data dissects the core profitability and scalability of both corporate engines to reveal who dominates the bottom line:
| Metric | Otis Worldwide Corporation (OTIS) | Dover Corporation (DOV) |
|---|---|---|
| Revenue | 14.43B | 8.09B |
| Cost of Revenue | 10.06B | 4.87B |
| Operating Expenses | 2.24B | 1.84B |
| Gross Profit | 4.37B | 3.22B |
| EBITDA | 2.31B | 1.86B |
| EBIT | 2.13B | 1.48B |
| Interest Expense | 196M | 110M |
| Net Income | 1.38B | 1.09B |
| EPS | 3.53 | 7.97 |
| Fiscal Year | 2025 | 2025 |
Income Statement Analysis: The Bottom-Line Duel
This income statement comparison reveals the true efficiency and profitability of Otis Worldwide Corporation and Dover Corporation’s business models.
Otis Worldwide Corporation Analysis
Otis shows steady revenue growth around 14.4B in 2025 with net income at 1.38B, reflecting a 9.6% net margin. Gross and EBIT margins remain favorable at 30.3% and 14.8%, respectively. Despite slight revenue growth deceleration, Otis maintains strong operational efficiency and a positive net income trajectory over the past five years.
Dover Corporation Analysis
Dover reports 8.1B in revenue for 2025, growing modestly year over year. Net income stands at 1.09B, yielding a stronger 13.5% net margin. Dover’s gross margin at 39.8% and EBIT margin at 18.3% outperform Otis, but recent declines in EBIT and net margin growth suggest emerging profitability pressures.
Margin Strength vs. Growth Stability
Otis delivers consistent revenue and net income growth with solid margin expansion, underpinning reliable profitability. Dover boasts superior margins but faces margin contraction and net income declines recently. Otis’s steady earnings profile appears more robust, while Dover’s higher margin but volatile growth presents greater risk for investors focused on stability.
Financial Ratios Comparison
These vital ratios act as a diagnostic tool to expose the underlying fiscal health, valuation premiums, and capital efficiency of the companies analyzed:
| Ratios | Otis Worldwide Corporation (OTIS) | Dover Corporation (DOV) |
|---|---|---|
| ROE | -25.7% | 14.8% |
| ROIC | 40.7% | 9.4% |
| P/E | 24.8 | 24.5 |
| P/B | -6.38 | 3.62 |
| Current Ratio | 0.85 | 1.79 |
| Quick Ratio | 0.77 | 1.28 |
| D/E | -1.62 | 0.45 |
| Debt-to-Assets | 82.1% | 24.8% |
| Interest Coverage | 11.2 | 12.5 |
| Asset Turnover | 1.35 | 0.60 |
| Fixed Asset Turnover | 11.13 | 7.23 |
| Payout Ratio | 46.7% | 25.9% |
| Dividend Yield | 1.88% | 1.06% |
| Fiscal Year | 2025 | 2025 |
Efficiency & Valuation Duel: The Vital Signs
Financial ratios serve as a company’s DNA, unveiling operational strengths and hidden risks critical to investment decisions.
Otis Worldwide Corporation
Otis posts a mixed profitability picture with a negative ROE at -25.7% but a strong ROIC of 40.7%, indicating efficient capital use despite shareholder losses. The valuation remains neutral with a P/E of 24.85 and a modest dividend yield of 1.88%. The company balances reinvestment in R&D with cautious capital allocation.
Dover Corporation
Dover displays solid profitability, boasting a positive ROE of 14.8% and a favorable net margin at 13.5%. Its P/E of 24.49 suggests fair valuation, supported by a stable dividend yield of 1.06%. The firm maintains a strong liquidity position and prudent debt levels, reflecting operational stability and shareholder value focus.
Balanced Efficiency vs. Profitability Stability
Both companies exhibit a slightly favorable ratio profile, but Otis’s superior capital efficiency contrasts with Dover’s consistent profitability and stronger liquidity. Investors prioritizing operational efficiency may lean toward Otis, while those seeking stable returns and financial safety may prefer Dover.
Which one offers the Superior Shareholder Reward?
I compare Otis Worldwide Corporation (OTIS) and Dover Corporation (DOV) on dividend yield, payout ratio, and buyback intensity. Otis yields 1.88% with a 47% payout ratio, well-covered by free cash flow, and maintains steady buybacks. Dover offers a slightly lower yield near 1.06%, a conservative 26% payout, and robust buybacks fueling total return. Dover’s higher margin and solid free cash flow coverage suggest greater distribution sustainability. I find Dover’s balanced dividend and aggressive buybacks provide superior long-term shareholder reward in 2026.
Comparative Score Analysis: The Strategic Profile
The radar chart reveals the fundamental DNA and trade-offs of Otis Worldwide Corporation and Dover Corporation, highlighting their financial strengths and vulnerabilities:
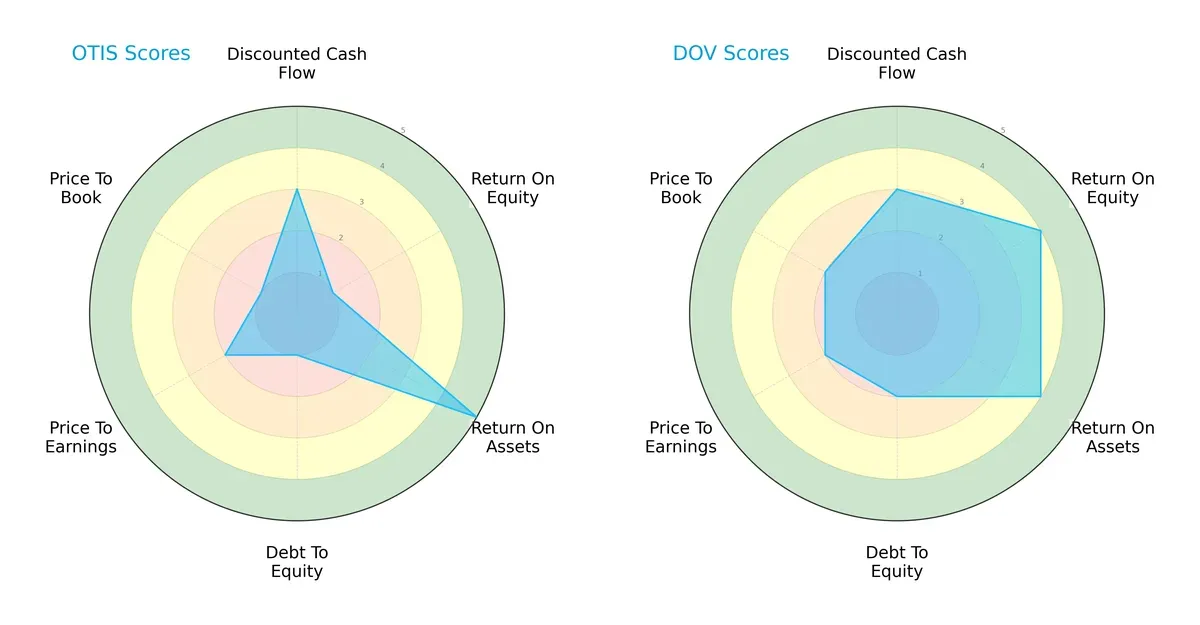
Dover shows a more balanced profile with solid ROE (4) and ROA (4) scores, alongside moderate DCF (3) and manageable debt-to-equity (2). Otis relies heavily on asset efficiency (ROA 5) but suffers from weak equity returns (ROE 1) and a risky debt position (debt-to-equity 1). Dover’s valuation metrics (PE/PB scores both 2) slightly outperform Otis, which endures unfavorable valuations (PE 2, PB 1). Overall, Dover demonstrates steadier fundamentals; Otis depends on its asset utilization edge but faces financial leverage and valuation challenges.
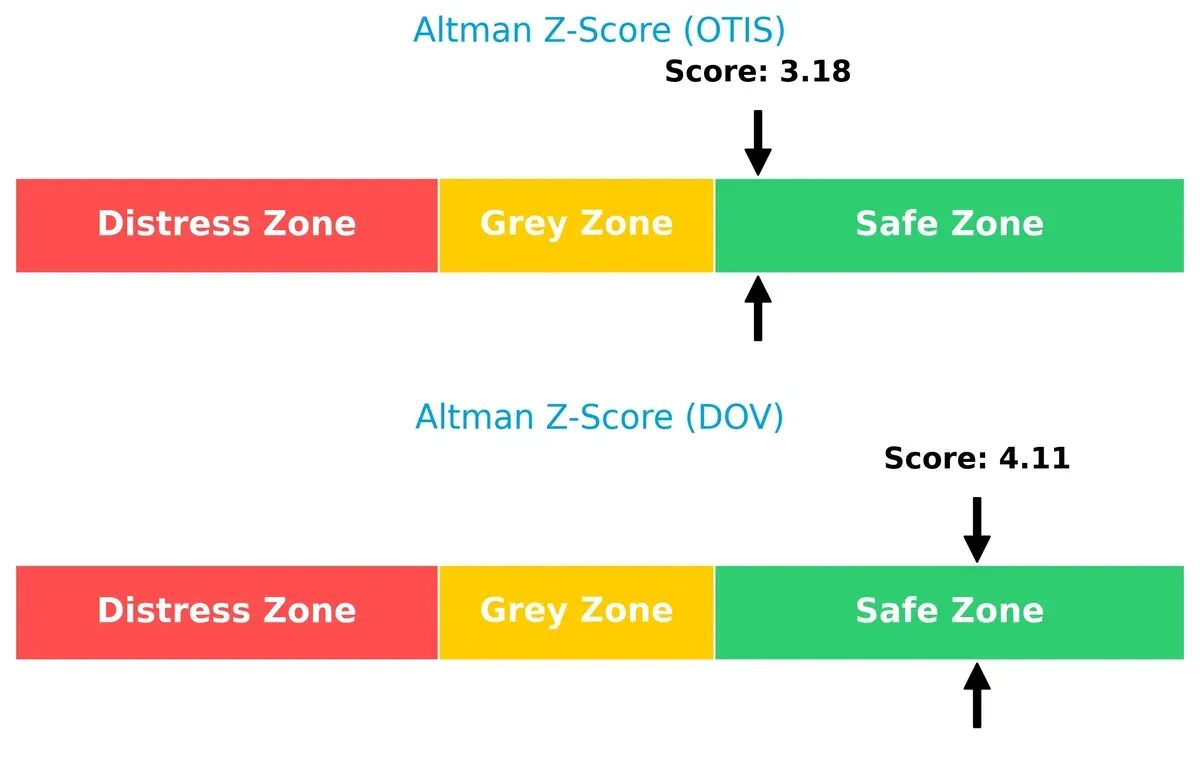
Bankruptcy Risk: Solvency Showdown
Otis and Dover both reside in the safe zone for bankruptcy risk, but Dover’s higher Altman Z-Score (4.11 vs. 3.18) implies a stronger margin of safety and resilience in economic downturns:
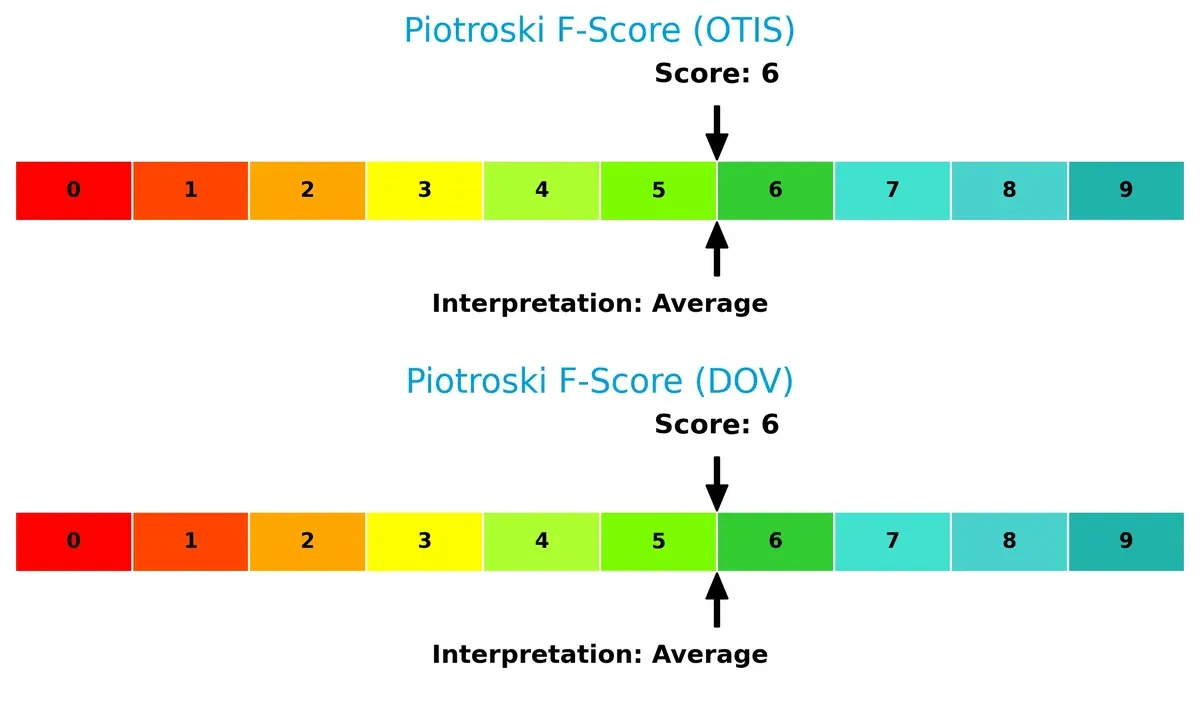
Financial Health: Quality of Operations
Both companies share an average Piotroski F-Score of 6, indicating moderate financial health without glaring red flags in operational or liquidity metrics:
How are the two companies positioned?
This section dissects the operational DNA of Otis and Dover by comparing their revenue distribution and internal dynamics. The goal is to confront their economic moats to reveal which model offers the most resilient competitive advantage today.
Revenue Segmentation: The Strategic Mix
This visual comparison dissects how Otis Worldwide and Dover Corporation diversify their income streams and reveals where their primary sector bets lie:
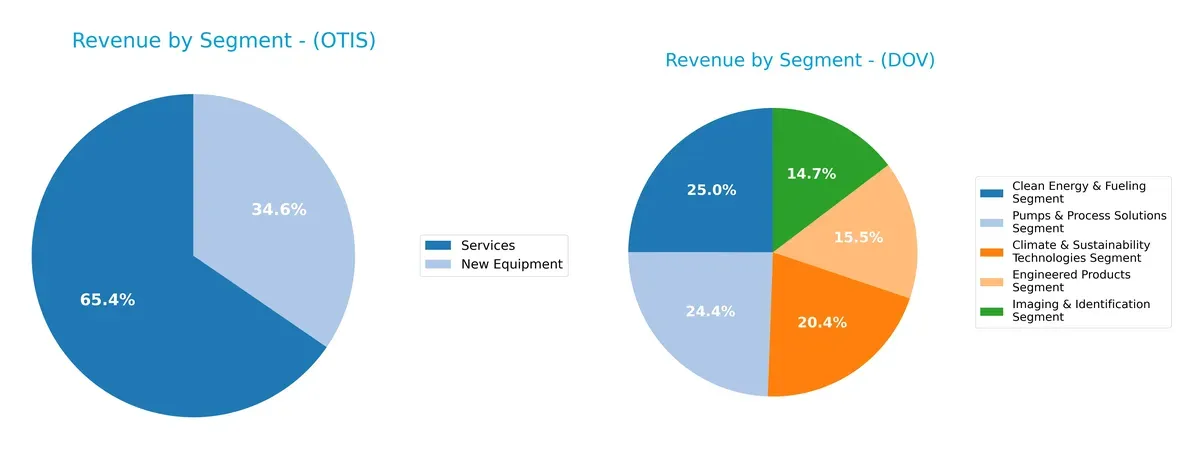
Otis anchors its revenue heavily in two segments: Services at $9.44B and New Equipment at $5.0B in 2025, showing a focused but balanced model. Dover spreads $7.6B across five roughly equal segments, with no single area dominating. Otis’s reliance on services suggests strong ecosystem lock-in, while Dover’s broad portfolio reduces concentration risk but may dilute operational focus.
Strengths and Weaknesses Comparison
This table compares the Strengths and Weaknesses of Otis and Dover based on diversification, profitability, financials, innovation, global presence, and market share:
Otis Strengths
- Strong service revenue at 9.4B USD
- Favorable ROIC at 40.7% well above WACC
- High fixed asset turnover at 11.1x
- Favorable interest coverage at 10.9x
- Global presence with 4.2B USD US revenue and 1.65B USD China sales
Dover Strengths
- Diversified segments across five industries
- Favorable net margin at 13.5%
- Strong current and quick ratios above 1.2
- Favorable debt-to-assets at 24.8%
- Robust interest coverage at 13.5x
- Significant US revenue of 4.2B USD
Otis Weaknesses
- Low current and quick ratios below 1
- High debt-to-assets at 82.1%
- Negative return on equity at -25.7%
- Negative price-to-book ratio
- Declining new equipment revenue trend
Dover Weaknesses
- Neutral ROIC below WACC
- Unfavorable price-to-book ratio
- Net margin and ROE not superior to sector benchmarks
- Lower asset turnover at 0.6x
Otis excels in operational efficiency and capital returns but faces liquidity and leverage challenges. Dover shows solid liquidity and diversification but must improve capital efficiency and market valuation metrics. Both companies exhibit slightly favorable financial profiles with distinct strategic priorities.
The Moat Duel: Analyzing Competitive Defensibility
A structural moat is the only true shield protecting long-term profits from relentless competitive erosion. Here’s how Otis and Dover compare:
Otis Worldwide Corporation: Network Effects through Service Scale
Otis leverages an extensive service network with 34,000 mechanics, creating high switching costs and stable margins. Its ROIC outpaces WACC by over 33%, signaling strong value creation. Expansion in modernization and emerging markets in 2026 should deepen this moat.
Dover Corporation: Diversified Product Portfolio with Cost Advantage
Dover’s moat stems from its broad industrial segments and cost efficiencies, but its ROIC barely exceeds WACC and is trending downward. Despite favorable gross margins, recent EBIT and net margin declines threaten sustained profitability. New clean energy solutions offer growth but face stiff competition.
Verdict: Network Effects vs. Product Diversification
Otis boasts a wider, more durable moat, driven by scalable service operations and rising ROIC. Dover’s diverse portfolio offers opportunity but suffers from declining capital efficiency. Otis is better positioned to defend and grow its market share in 2026.
Which stock offers better returns?
Over the past 12 months, Otis Worldwide Corporation’s stock declined steadily while Dover Corporation’s shares surged with notable acceleration, reflecting contrasting market momentum and investor sentiment.
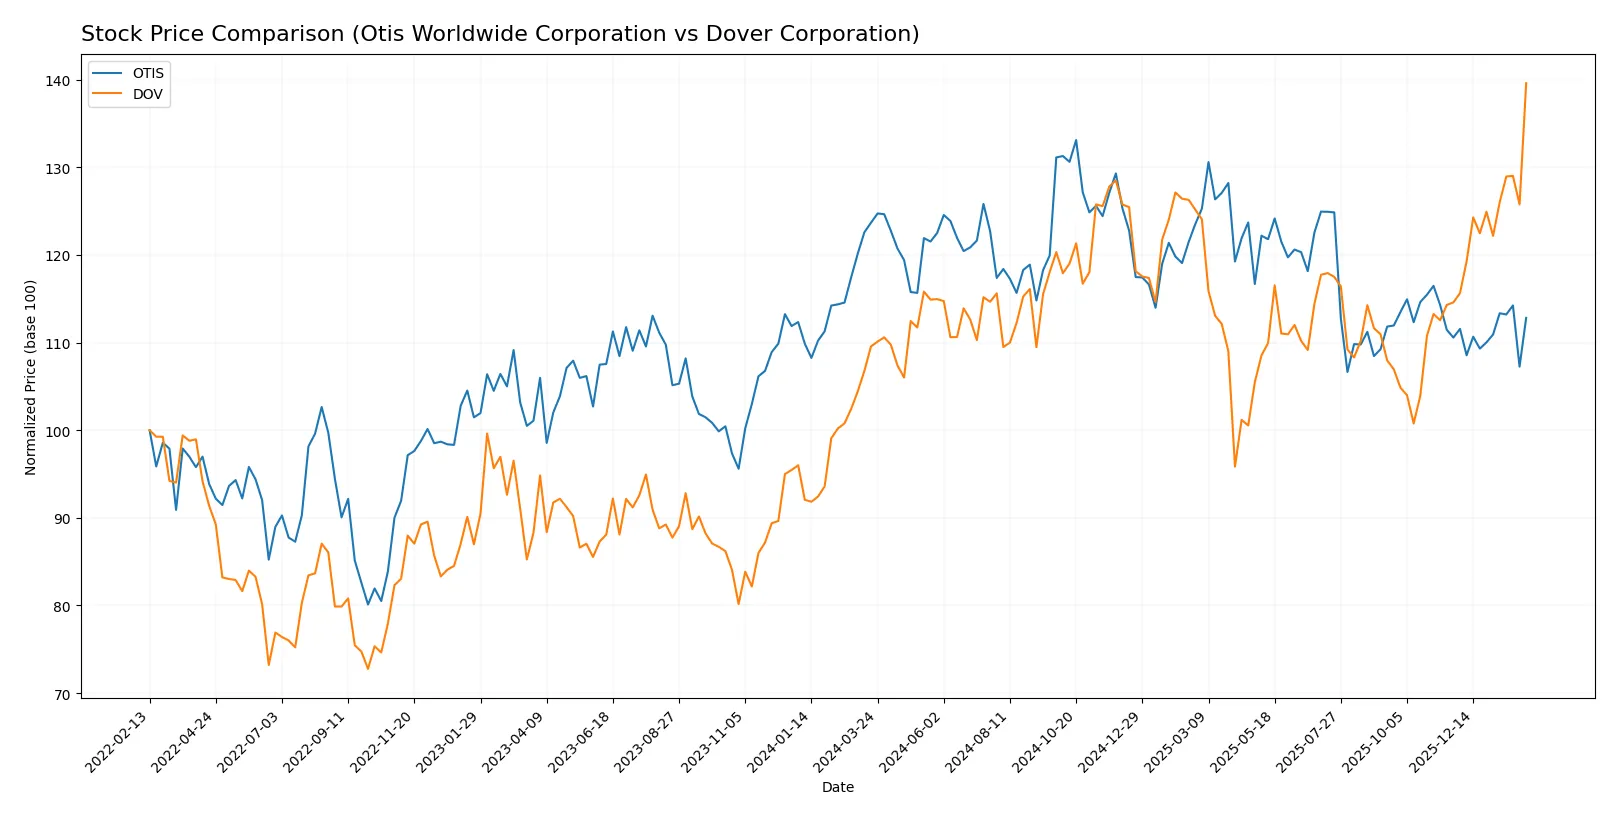
Trend Comparison
Otis’s stock fell 8.78% over the past year, marking a bearish trend with accelerating decline. The price ranged between 84.93 and 106.01, showing moderate volatility with a 4.88 standard deviation.
Dover’s stock rose 27.42% over the same period, indicating a strong bullish trend with accelerating gains. It experienced higher volatility, reflected by an 11.92 standard deviation, and prices ranged from 153.55 to 223.66.
Dover outperformed Otis with a clear upward trajectory and stronger price appreciation, delivering the highest market performance among the two stocks.
Target Prices
Analysts present a clear target price consensus for Otis Worldwide Corporation and Dover Corporation.
| Company | Target Low | Target High | Consensus |
|---|---|---|---|
| Otis Worldwide Corporation | 92 | 109 | 97.75 |
| Dover Corporation | 195 | 256 | 223.7 |
The consensus target prices for both companies exceed their current stock prices, suggesting moderate upside potential. This reflects analyst confidence despite recent market volatility.

Don’t Let Luck Decide Your Entry Point
Optimize your entry points with our advanced ProRealTime indicators. You’ll get efficient buy signals with precise price targets for maximum performance. Start outperforming now!
How do institutions grade them?
Otis Worldwide Corporation Grades
The following table summarizes recent grades assigned to Otis by reputable institutions:
| Grading Company | Action | New Grade | Date |
|---|---|---|---|
| JP Morgan | Maintain | Overweight | 2026-01-16 |
| Wells Fargo | Maintain | Equal Weight | 2025-12-15 |
| Barclays | Maintain | Underweight | 2025-10-30 |
| JP Morgan | Maintain | Overweight | 2025-10-15 |
| Wolfe Research | Upgrade | Outperform | 2025-10-08 |
| Wells Fargo | Maintain | Equal Weight | 2025-10-06 |
| JP Morgan | Maintain | Overweight | 2025-09-18 |
| RBC Capital | Maintain | Outperform | 2025-07-28 |
| Wolfe Research | Upgrade | Peer Perform | 2025-07-25 |
| JP Morgan | Maintain | Overweight | 2025-07-24 |
Dover Corporation Grades
The recent grades for Dover from established grading firms are listed below:
| Grading Company | Action | New Grade | Date |
|---|---|---|---|
| JP Morgan | Maintain | Overweight | 2026-01-30 |
| Wells Fargo | Maintain | Equal Weight | 2026-01-30 |
| RBC Capital | Maintain | Sector Perform | 2026-01-30 |
| Oppenheimer | Maintain | Outperform | 2026-01-26 |
| JP Morgan | Maintain | Overweight | 2026-01-16 |
| Wells Fargo | Maintain | Equal Weight | 2026-01-07 |
| Barclays | Maintain | Equal Weight | 2026-01-07 |
| UBS | Upgrade | Buy | 2026-01-05 |
| Wells Fargo | Maintain | Equal Weight | 2025-12-15 |
| Oppenheimer | Maintain | Outperform | 2025-11-14 |
Which company has the best grades?
Dover has received more consistent positive upgrades, including a recent upgrade to Buy by UBS. Otis shows mixed grades with some underweight ratings. Dover’s stronger grades may signal more favorable institutional sentiment, potentially influencing investor confidence.
Risks specific to each company
The following categories identify the critical pressure points and systemic threats facing both firms in the 2026 market environment:
1. Market & Competition
Otis Worldwide Corporation
- Operates in elevator/escalator market with strong service network; faces competition from global industrial players and tech disruption risks.
Dover Corporation
- Diversified industrial machinery segments face varied competitive pressures across clean energy, automation, and process solutions markets.
2. Capital Structure & Debt
Otis Worldwide Corporation
- High debt-to-assets ratio at 82.14% signals leverage risk despite strong interest coverage; negative D/E ratio needs scrutiny.
Dover Corporation
- Lower debt-to-assets at 24.79% and moderate D/E of 0.45 indicate more prudent leverage and balance sheet strength.
3. Stock Volatility
Otis Worldwide Corporation
- Beta near 1.01 suggests market-level volatility; stock price range moderately tight between 84.0-106.8 USD.
Dover Corporation
- Higher beta of 1.29 implies greater price sensitivity to market swings; wider price range from 143.0-224.0 USD shows elevated volatility.
4. Regulatory & Legal
Otis Worldwide Corporation
- Subject to safety and building regulations globally; potential liabilities from modernization and service contracts.
Dover Corporation
- Faces regulatory scrutiny across multiple industrial sectors including environmental, clean energy, and aerospace compliance risks.
5. Supply Chain & Operations
Otis Worldwide Corporation
- Relies on a large technician network and global supply chains for components; exposed to logistics disruptions and raw material cost inflation.
Dover Corporation
- Complex supply chains across diverse segments introduce operational risks; reliance on distributors adds potential bottlenecks.
6. ESG & Climate Transition
Otis Worldwide Corporation
- Pressure to innovate eco-friendly elevator solutions amid rising ESG standards; potential costs to retrofit existing products.
Dover Corporation
- Clean Energy & Sustainability Technologies segment positions Dover well but also exposes it to transition risks and regulatory changes.
7. Geopolitical Exposure
Otis Worldwide Corporation
- International operations bring exposure to trade tensions, tariffs, and regional instability, notably in Asia.
Dover Corporation
- Global footprint across sensitive sectors like defense and energy increases risk from geopolitical shifts and export controls.
Which company shows a better risk-adjusted profile?
Otis’s most impactful risk lies in its high leverage and liquidity constraints, raising solvency concerns despite operational strength. Dover faces elevated stock volatility and geopolitical risks but maintains a healthier balance sheet. Dover’s safer capital structure and diversified segments provide a superior risk-adjusted profile. Notably, Otis’s debt-to-assets ratio at over 80% starkly contrasts Dover’s 25%, underscoring Otis’s vulnerability in a rising interest rate environment.
Final Verdict: Which stock to choose?
Otis Worldwide Corporation’s superpower lies in its exceptional capital efficiency. It consistently generates returns well above its cost of capital, signaling a strong economic moat. However, its stretched liquidity profile is a point of vigilance that could pressure short-term flexibility. Otis fits well in portfolios seeking disciplined value creators with growth potential.
Dover Corporation benefits from a strategic moat anchored in robust gross margins and solid liquidity. Its conservative balance sheet and stable cash flow offer a safer profile compared to Otis. Dover appeals to investors targeting growth at a reasonable price, blending steady income with moderate risk exposure.
If you prioritize superior capital efficiency and long-term value creation, Otis outshines due to its strong ROIC and sustainable competitive advantage. However, if you seek better liquidity and a more defensive financial structure, Dover offers better stability with a strategic margin cushion. Each company suits a distinct investor profile balancing growth ambition and risk tolerance.
Disclaimer: Investment carries a risk of loss of initial capital. The past performance is not a reliable indicator of future results. Be sure to understand risks before making an investment decision.
Go Further
I encourage you to read the complete analyses of Otis Worldwide Corporation and Dover Corporation to enhance your investment decisions: