Home > Comparison > Industrials > DOV vs NDSN
The strategic rivalry between Dover Corporation and Nordson Corporation defines the current trajectory of the industrial machinery sector. Dover operates as a diversified industrial equipment provider with multiple end-markets, while Nordson specializes in precision dispensing systems and advanced technology solutions. This head-to-head contrasts broad industrial scale against focused technological innovation. This analysis will determine which corporate path offers the superior risk-adjusted return for a diversified portfolio in 2026.
Table of contents
Companies Overview
Dover Corporation and Nordson Corporation stand as key players in the industrial machinery sector, shaping market dynamics with their specialized solutions.
Dover Corporation: Diverse Industrial Equipment Leader
Dover Corporation commands a broad industrial portfolio, generating revenue from engineered products, clean energy fueling, imaging, pumps, and climate technologies. Its core strength lies in diverse equipment and software sales across multiple end-markets, including aerospace and retail fueling. In 2026, Dover emphasizes digital solutions and sustainability, aiming to enhance operational efficiency and expand clean energy capabilities.
Nordson Corporation: Precision Dispensing Innovator
Nordson Corporation specializes in precision dispensing and coating systems, driving revenue through advanced application technologies for adhesives, coatings, and biomaterials. Its two segments focus on industrial precision solutions and advanced technology systems serving packaging, electronics, and medical industries. The company’s strategic priority in 2026 centers on automation and advanced material handling, reinforcing its leadership in high-precision fluid control.
Strategic Collision: Similarities & Divergences
Both companies excel in highly engineered industrial machinery, yet Dover pursues a diversified product mix, while Nordson targets niche precision dispensing markets. Their primary battleground lies in industrial automation and application technology. Dover’s broad industrial scope contrasts with Nordson’s focused innovation, offering investors distinct profiles: one balances scale and sustainability, the other drives specialization and technological depth.
Income Statement Comparison
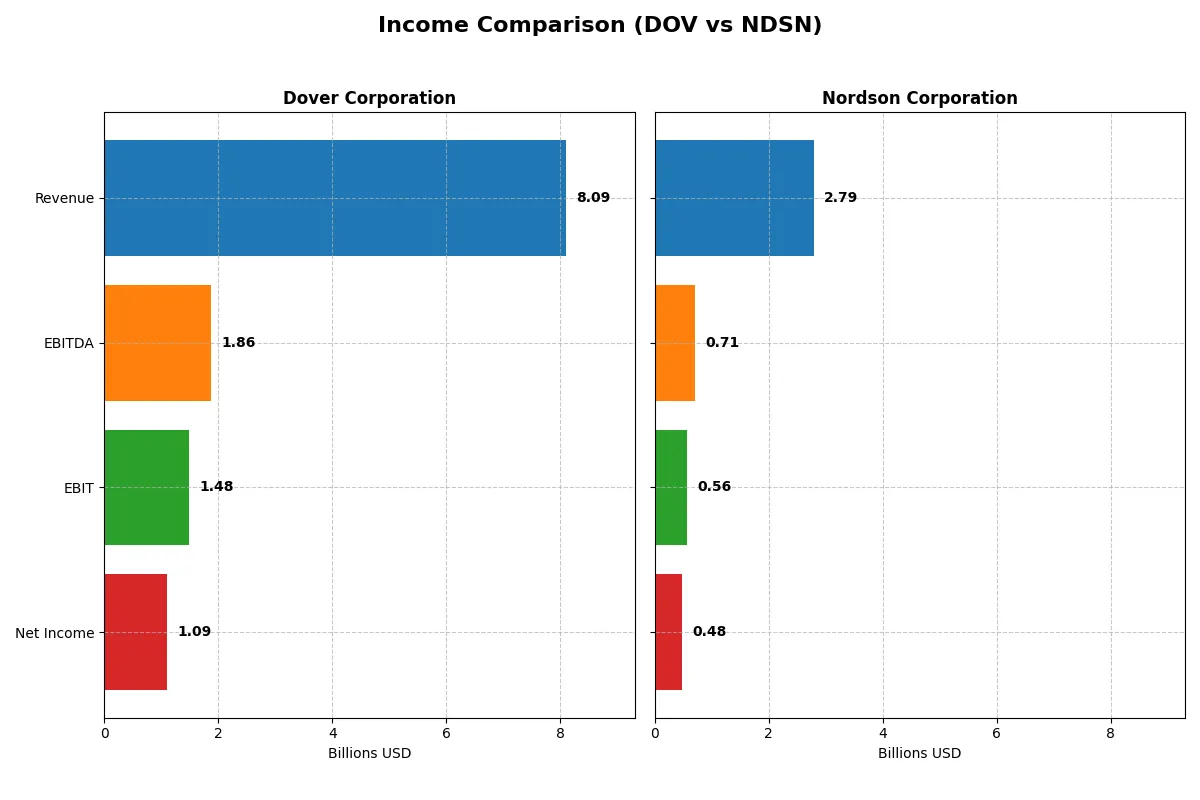
This data dissects the core profitability and scalability of both corporate engines to reveal who dominates the bottom line:
| Metric | Dover Corporation (DOV) | Nordson Corporation (NDSN) |
|---|---|---|
| Revenue | 8.1B | 2.8B |
| Cost of Revenue | 4.9B | 1.3B |
| Operating Expenses | 1.8B | 828M |
| Gross Profit | 3.2B | 1.5B |
| EBITDA | 1.9B | 712M |
| EBIT | 1.5B | 561M |
| Interest Expense | 110M | 101M |
| Net Income | 1.1B | 484M |
| EPS | 7.97 | 8.56 |
| Fiscal Year | 2025 | 2025 |
Income Statement Analysis: The Bottom-Line Duel
This income statement comparison reveals how Dover Corporation and Nordson Corporation each convert sales into profit and operational efficiency.
Dover Corporation Analysis
Dover’s revenue shows modest growth from 7.9B in 2021 to 8.1B in 2025, yet net income dips slightly overall. Its gross margin remains healthy near 40%, but net margin contraction in 2025 signals pressure. Operating expenses grew faster than revenue, eroding EBIT by over 20% last year, reflecting margin and momentum challenges.
Nordson Corporation Analysis
Nordson’s revenue climbed steadily from 2.4B in 2021 to 2.8B in 2025, boosting net income by 6.6% over five years. It boasts superior gross and net margins above 55% and 17%, respectively. Despite a slight EBIT decline recently, Nordson sustains solid operational efficiency and EPS growth, underscoring robust profitability and margin discipline.
Margin Discipline vs. Revenue Scale
Nordson wins on margin strength and consistent net income growth, with higher profitability ratios and operational efficiency. Dover offers larger scale but faces margin compression and declining net income momentum. Investors seeking stable profit growth may favor Nordson’s disciplined margin profile over Dover’s volume-driven but pressured earnings.
Financial Ratios Comparison
These vital ratios act as a diagnostic tool to expose underlying fiscal health, valuation premiums, and capital efficiency of the companies analyzed:
| Ratios | Dover Corporation (DOV) | Nordson Corporation (NDSN) |
|---|---|---|
| ROE | 20.7% (2023) | 18.8% (2023) |
| ROIC | 10.8% (2023) | 11.1% (2023) |
| P/E | 20.4x (2023) | 24.9x (2023) |
| P/B | 4.2x (2023) | 4.7x (2023) |
| Current Ratio | 1.40 (2023) | 2.11 (2023) |
| Quick Ratio | 0.90 (2023) | 1.33 (2023) |
| D/E (Debt-to-Equity) | 0.72 (2023) | 0.72 (2023) |
| Debt-to-Assets | 32.4% (2023) | 35.5% (2023) |
| Interest Coverage | 9.3x (2023) | 11.3x (2023) |
| Asset Turnover | 0.68 (2023) | 0.50 (2023) |
| Fixed Asset Turnover | 7.45 (2023) | 5.27 (2023) |
| Payout ratio | 27.0% (2023) | 31.0% (2023) |
| Dividend yield | 1.32% (2023) | 1.24% (2023) |
| Fiscal Year | 2023 | 2023 |
Efficiency & Valuation Duel: The Vital Signs
Ratios act as the company’s DNA, revealing hidden risks and operational excellence that shape investment outcomes fundamentally.
Dover Corporation
Dover shows a favorable net margin of 13.52% but reports zero return on equity and invested capital, signaling operational inefficiencies. Its P/E ratio of 24.49 is neutral, neither cheap nor expensive. The 1.06% dividend yield offers modest shareholder returns amidst limited reinvestment signals.
Nordson Corporation
Nordson delivers stronger profitability with a 17.35% net margin, a solid 15.92% ROE, and a 10.49% ROIC, reflecting efficient capital use. However, its valuation is stretched with a P/E of 27.1 and a high P/B of 4.31. The 1.36% dividend yield complements a balanced shareholder return approach.
Operational Strength vs. Valuation Stretch
Nordson’s superior profitability and capital efficiency contrast with a premium valuation, while Dover’s weaker returns pair with a more moderate price. Investors seeking operational strength face a higher price with Nordson; those preferring valuation restraint find Dover’s profile more fitting.
Which one offers the Superior Shareholder Reward?
I find Dover Corporation (DOV) and Nordson Corporation (NDSN) both pay dividends with yields near 1.1–1.3%, but Dover’s lower payout ratio (~26%) signals safer coverage versus Nordson’s higher 31–37%. Dover’s FCF per share (~$8.1) supports its steady dividend, while Nordson’s larger buybacks, with free cash flow around $11.7/share, amplify total returns. Historically, Dover’s balance of dividends and buybacks offers more sustainable shareholder rewards, given its robust cash flow coverage and moderate payout. I conclude Dover provides a superior total return profile for 2026 investors, blending income reliability with prudent capital allocation.
Comparative Score Analysis: The Strategic Profile
The radar chart reveals the fundamental DNA and trade-offs of Dover Corporation and Nordson Corporation, highlighting their core financial strengths and vulnerabilities:
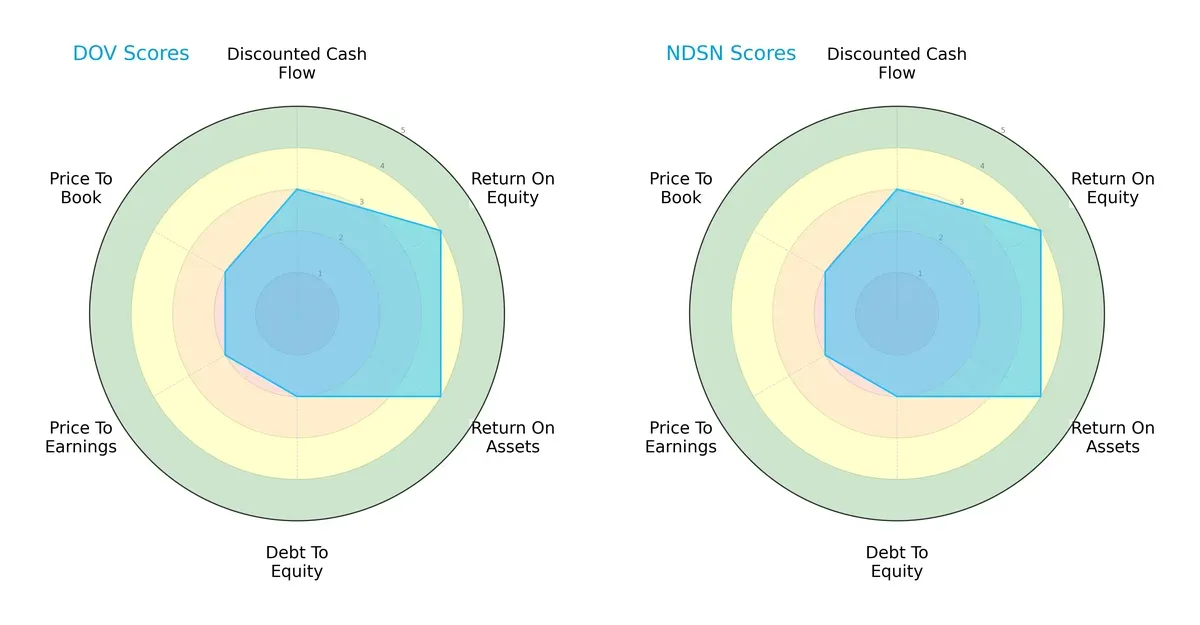
Both firms share an identical score profile, with favorable ROE and ROA at 4, indicating efficient profit generation and asset utilization. Each holds moderate scores in DCF, Debt/Equity, P/E, and P/B at 2 or 3, reflecting balanced valuation and leverage. Neither company dominates on a specific metric, resulting in equally balanced strategic profiles.
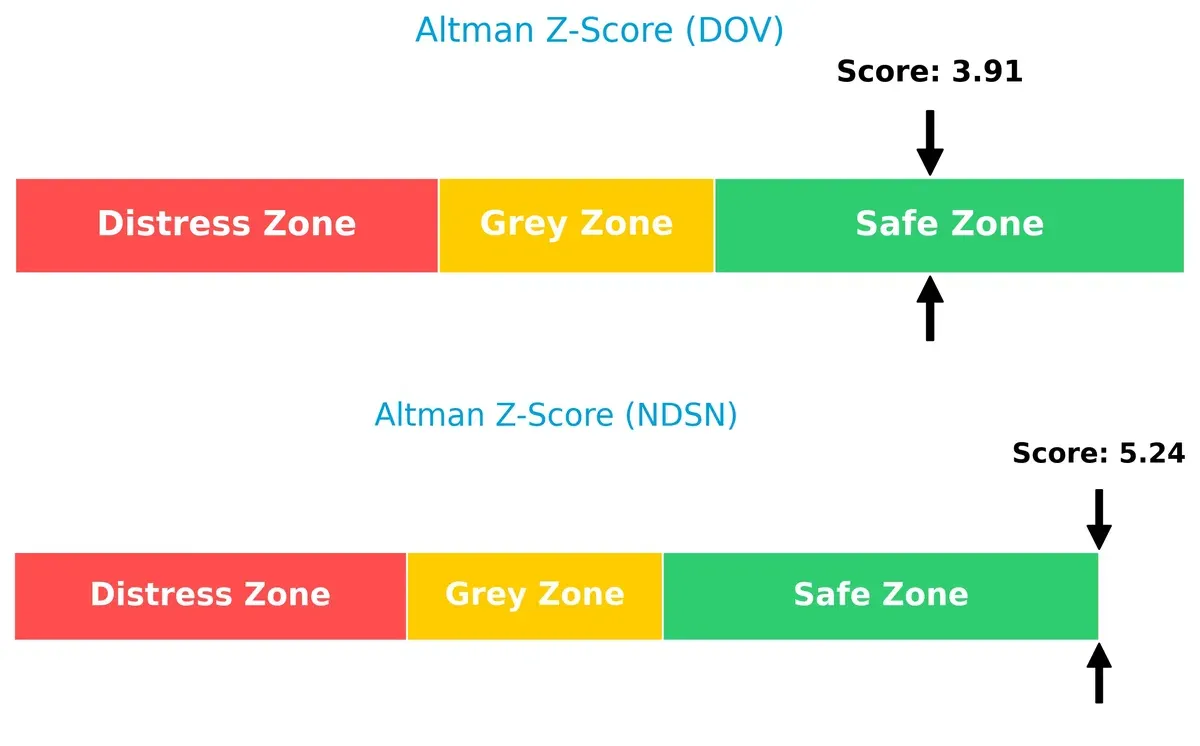
Bankruptcy Risk: Solvency Showdown
Nordson’s Altman Z-Score of 5.24 surpasses Dover’s 3.91, signaling stronger long-term solvency and lower bankruptcy risk in this cycle:
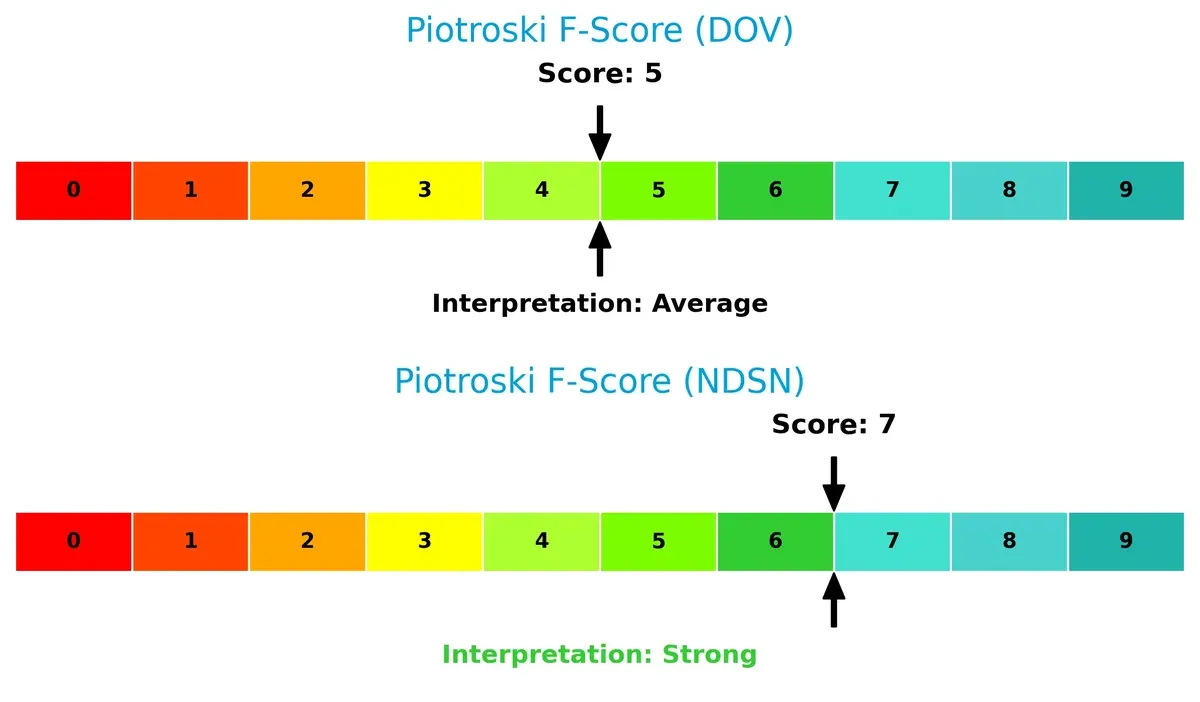
Financial Health: Quality of Operations
Nordson’s Piotroski score of 7 outperforms Dover’s 5, indicating superior financial health and operational quality; Dover shows mild red flags in internal metrics:
How are the two companies positioned?
This section dissects DOV and NDSN’s operational DNA by comparing revenue distribution and internal dynamics. The goal is to confront their economic moats and reveal which model offers the most resilient, sustainable advantage today.
Revenue Segmentation: The Strategic Mix
This visual comparison dissects how Dover Corporation and Nordson Corporation diversify their income streams and where their primary sector bets lie:
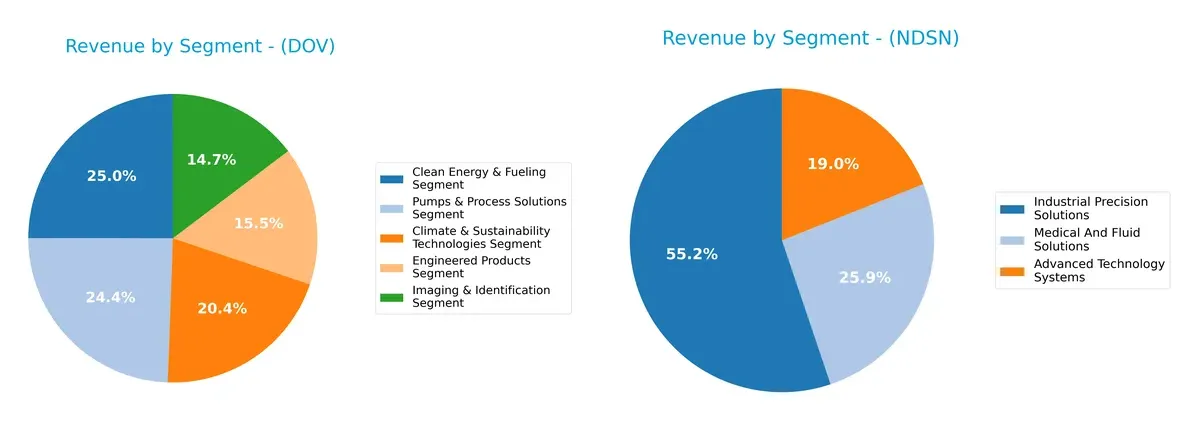
Dover’s 2024 revenue spreads evenly across five segments, with Clean Energy & Fueling leading at $1.94B, reflecting a balanced portfolio with lower concentration risk. Nordson leans heavily on Industrial Precision Solutions at $1.48B, anchoring its revenue, while Advanced Technology and Medical Solutions trail. Dover’s diversification supports resilience and cross-sector innovation. Nordson’s reliance on a dominant segment signals potential vulnerability but also deep industry expertise and focused market leadership.
Strengths and Weaknesses Comparison
This table compares the strengths and weaknesses of Dover Corporation and Nordson Corporation based on diversification, profitability, financials, innovation, global presence, and market share:
Dover Corporation Strengths
- Broad diversification across five segments
- Favorable net margin of 13.52%
- Strong interest coverage ratio of 13.52
- Low debt-to-assets ratio signals financial prudence
- Extensive global presence with high US and Europe sales
- Consistent revenue across multiple product lines
Nordson Corporation Strengths
- Higher net margin at 17.35% and strong ROE of 15.92%
- Favorable ROIC of 10.49% exceeding WACC
- Healthy current and quick ratios reflect liquidity
- High fixed asset turnover at 4.7 indicates operational efficiency
- Diversified product segments focused on advanced tech
- Balanced global revenue with strong Americas and Asia presence
Dover Corporation Weaknesses
- Zero ROE and ROIC indicate poor capital returns
- Unavailable WACC limits full capital cost assessment
- Unfavorable liquidity ratios (current and quick) raise red flags
- Neutral P/E and zero PB ratio may imply valuation concerns
- Unfavorable asset turnover metrics suggest inefficiency
- Slightly unfavorable global ratio profile
Nordson Corporation Weaknesses
- Unfavorable valuation multiples: high P/E of 27.1 and PB of 4.31
- Moderate debt levels with neutral debt-to-assets ratio
- Asset turnover below 1 signals room for improvement
- Debt-to-equity ratio is neutral, indicating moderate leverage
- Dividend yield neutral, limiting income appeal
Overall, Dover shows strength in diversification and conservative debt management but struggles with profitability and liquidity. Nordson delivers superior profitability and operational efficiency but faces valuation and leverage concerns. Each company’s profile reflects distinct strategic focuses and financial health challenges.
The Moat Duel: Analyzing Competitive Defensibility
A structural moat alone shields long-term profits from relentless competitive erosion. Let’s dissect the moats of Dover Corporation and Nordson Corporation:
Dover Corporation: Diverse Industrial Engineering Moat
Dover’s advantage stems from its broad portfolio of engineered products and aftermarket services, creating moderate switching costs. Financially, its margins hover stable but ROIC data is unavailable, signaling caution. Expansion in clean energy components could either deepen or pressure its moat in 2026.
Nordson Corporation: Precision Dispensing Specialist Moat
Nordson leverages specialized dispensing technology and strong intangible assets, differentiating it from Dover’s broader industrial base. It delivers higher gross (55%) and net margins (17%) and creates value with ROIC exceeding WACC by 2.4%. Despite a declining ROIC trend, growth in advanced technology solutions supports future moat resilience.
Precision Engineering vs. Industrial Diversification: The Moat Verdict
Nordson holds the deeper moat with superior margin profiles and confirmed value creation, despite shrinking ROIC. Dover’s undefined ROIC and mixed income growth cast doubt on moat durability. I see Nordson better positioned to defend market share amid evolving industrial demands.
Which stock offers better returns?
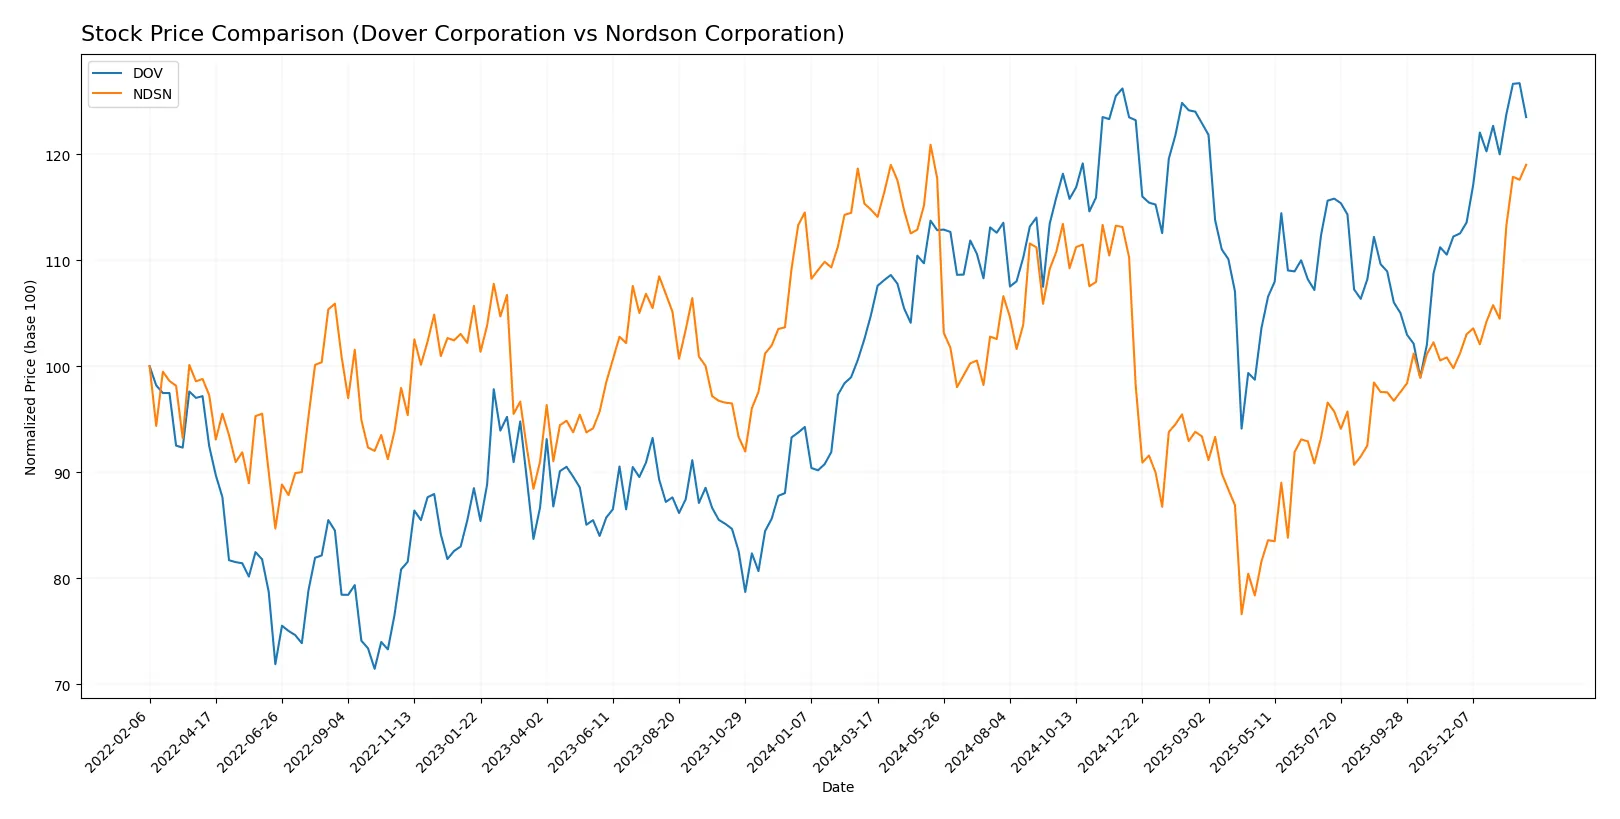
Over the past 12 months, both Dover Corporation and Nordson Corporation show positive price trends with accelerating momentum, though Dover’s gains are more pronounced.
Trend Comparison
Dover Corporation’s stock rose 17.81% over the past year, marking a bullish trend with accelerating price gains and moderate volatility (11.33 std deviation). It peaked at 206.71 and held a low of 153.55.
Nordson Corporation gained 3.69% over the same period, also bullish with acceleration but greater volatility (23.66 std deviation). Its highest price was 278.89, and the lowest 176.73.
Dover’s 17.81% increase clearly outperforms Nordson’s 3.69%, delivering the strongest market performance among the two over the past 12 months.
Target Prices
Analysts show a bullish consensus for Dover Corporation and Nordson Corporation, indicating potential upside from current prices.
| Company | Target Low | Target High | Consensus |
|---|---|---|---|
| Dover Corporation | 195 | 256 | 221.38 |
| Nordson Corporation | 240 | 295 | 274.17 |
The consensus target prices for both stocks exceed their current prices, signaling analyst optimism and room for capital appreciation compared to the present market valuations.

Don’t Let Luck Decide Your Entry Point
Optimize your entry points with our advanced ProRealTime indicators. You’ll get efficient buy signals with precise price targets for maximum performance. Start outperforming now!
How do institutions grade them?
Here is a summary of the latest institutional grades for Dover Corporation and Nordson Corporation:
Dover Corporation Grades
The following table shows recent grades assigned to Dover Corporation by major financial institutions.
| Grading Company | Action | New Grade | Date |
|---|---|---|---|
| JP Morgan | maintain | Overweight | 2026-01-30 |
| Wells Fargo | maintain | Equal Weight | 2026-01-30 |
| RBC Capital | maintain | Sector Perform | 2026-01-30 |
| Oppenheimer | maintain | Outperform | 2026-01-26 |
| JP Morgan | maintain | Overweight | 2026-01-16 |
| Barclays | maintain | Equal Weight | 2026-01-07 |
| Wells Fargo | maintain | Equal Weight | 2026-01-07 |
| UBS | upgrade | Buy | 2026-01-05 |
| Wells Fargo | maintain | Equal Weight | 2025-12-15 |
| Oppenheimer | maintain | Outperform | 2025-11-14 |
Nordson Corporation Grades
Below are recent institutional grades for Nordson Corporation from recognized financial firms.
| Grading Company | Action | New Grade | Date |
|---|---|---|---|
| DA Davidson | maintain | Buy | 2025-12-12 |
| Baird | maintain | Neutral | 2025-12-12 |
| Keybanc | maintain | Overweight | 2025-12-11 |
| DA Davidson | maintain | Buy | 2025-12-11 |
| Oppenheimer | maintain | Outperform | 2025-08-25 |
| Baird | maintain | Neutral | 2025-08-22 |
| Keybanc | maintain | Overweight | 2025-07-15 |
| Oppenheimer | upgrade | Outperform | 2025-05-30 |
| Baird | maintain | Neutral | 2025-05-30 |
| Keybanc | maintain | Overweight | 2025-04-08 |
Which company has the best grades?
Dover Corporation shows a strong consensus with multiple “Overweight,” “Outperform,” and a recent upgrade to “Buy” by UBS. Nordson Corporation’s grades also favor “Buy” and “Outperform,” but their most recent grades date back several months. Dover’s more current upgrades suggest stronger recent institutional confidence, potentially impacting investor sentiment positively.
Risks specific to each company
The following categories identify the critical pressure points and systemic threats facing both firms in the 2026 market environment:
1. Market & Competition
Dover Corporation
- Faces intense competition in industrial machinery segments, with pressure on innovation and pricing.
Nordson Corporation
- Operates in specialized dispensing systems, competing on advanced technology and precision, with moderate market pressure.
2. Capital Structure & Debt
Dover Corporation
- Shows a favorable debt-to-equity profile with strong interest coverage, indicating prudent leverage management.
Nordson Corporation
- Maintains moderate leverage (D/E 0.69) with adequate interest coverage, reflecting balanced financial risk.
3. Stock Volatility
Dover Corporation
- Beta at 1.305 suggests higher volatility than the market, exposing investors to larger price swings.
Nordson Corporation
- Beta of 1.025 indicates stock moves close to market volatility, offering more stability for risk-averse investors.
4. Regulatory & Legal
Dover Corporation
- Exposure to environmental and safety regulations across diverse industrial operations poses compliance risks.
Nordson Corporation
- Faces regulatory scrutiny mainly in precision manufacturing and medical device segments, requiring strict adherence.
5. Supply Chain & Operations
Dover Corporation
- Complex global supply chains may face disruptions impacting equipment delivery and aftermarket services.
Nordson Corporation
- Relies on specialized components; supply chain efficiency is vital but less exposed to broad industrial shocks.
6. ESG & Climate Transition
Dover Corporation
- Climate & Sustainability Technologies segment drives transition but also risks from evolving standards and costs.
Nordson Corporation
- ESG efforts focus on clean technologies in coatings and adhesives, but transition costs could pressure margins.
7. Geopolitical Exposure
Dover Corporation
- Global footprint exposes firm to trade tensions and geopolitical uncertainties affecting industrial demand.
Nordson Corporation
- International sales subject to geopolitical risks, though smaller scale and niche markets may mitigate impact.
Which company shows a better risk-adjusted profile?
Dover’s most impactful risk is elevated stock volatility and operational complexity amid global supply challenges. Nordson faces valuation pressures and regulatory risks but benefits from superior liquidity and financial health. Nordson’s stronger Piotroski score (7 vs. 5) and safer Altman Z-Score (5.24 vs. 3.91) indicate a better risk-adjusted profile. Recent data shows Dover’s unfavorable liquidity ratios remain a red flag, underscoring operational risk in an unstable market.
Final Verdict: Which stock to choose?
Dover Corporation’s superpower lies in its robust operational margin and consistent cash generation, reflecting solid industrial efficiency. However, its declining profitability and challenges in capital returns warrant vigilance. It fits best in portfolios seeking stable industrial exposure with moderate growth ambitions.
Nordson Corporation commands a strategic moat through its high gross margins and disciplined capital use, underscoring strong value creation. Its superior income quality and financial stability offer better safety compared to Dover. It suits portfolios focused on quality growth with a cushion against volatility.
If you prioritize operational efficiency and a steady industrial base, Dover presents a compelling scenario despite some erosion in returns. However, if you seek durable value creation with stronger profitability and a safer balance sheet, Nordson outshines as the more resilient choice. Both demand careful monitoring of their profitability trends.
Disclaimer: Investment carries a risk of loss of initial capital. The past performance is not a reliable indicator of future results. Be sure to understand risks before making an investment decision.
Go Further
I encourage you to read the complete analyses of Dover Corporation and Nordson Corporation to enhance your investment decisions: