Home > Comparison > Industrials > DOV vs NNE
The strategic rivalry between Dover Corporation and Nano Nuclear Energy Inc shapes the Industrials sector’s innovation frontier. Dover, an established industrial machinery giant, excels in diversified equipment and component manufacturing. In contrast, Nano Nuclear Energy is a nascent microreactor technology pioneer with high growth potential but elevated risk. This analysis contrasts their operational models to identify which trajectory offers superior risk-adjusted returns for a diversified portfolio seeking industrial exposure.
Table of contents
Companies Overview
Dover Corporation and Nano Nuclear Energy Inc represent distinct forces within the industrial machinery sector, shaping future energy and equipment markets.
Dover Corporation: Diverse Industrial Solutions Leader
Dover Corporation stands as a major industrial equipment provider with a $27.6B market cap. It generates revenue through diverse segments like Engineered Products, Clean Energy & Fueling, and Climate & Sustainability Technologies. In 2026, it prioritizes expanding digital solutions and sustainable technologies across its broad industrial base, reinforcing its competitive advantage in aftermarket services and clean fuel infrastructure.
Nano Nuclear Energy Inc: Microreactor Innovator
Nano Nuclear Energy Inc is a nascent microreactor technology company focused on nuclear innovation with a $1.2B market cap. It drives revenue by developing solid-core battery reactors and low-pressure coolant reactors, alongside fuel fabrication and nuclear consultation. Its 2026 strategy centers on advancing ZEUS and ODIN reactors to disrupt traditional nuclear power, targeting a high-growth niche in clean energy technology.
Strategic Collision: Similarities & Divergences
Both companies operate in industrial machinery but diverge sharply: Dover champions a diversified, mature industrial ecosystem, while Nano Nuclear pursues a focused, high-risk nuclear innovation path. They compete indirectly in clean energy solutions but target different customer bases and technological frontiers. Dover offers steady industrial cash flow, whereas Nano presents a volatile but potentially transformative growth profile.
Income Statement Comparison
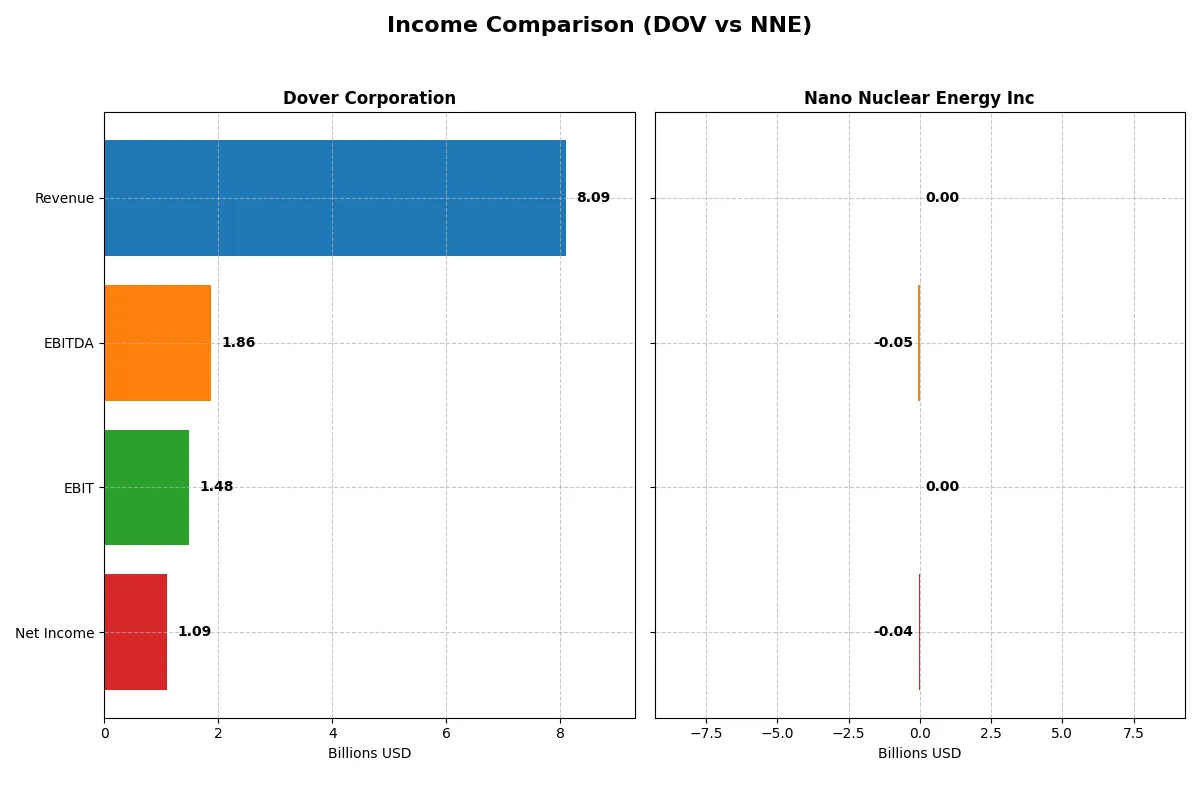
This data dissects the core profitability and scalability of both corporate engines to reveal who dominates the bottom line:
| Metric | Dover Corporation (DOV) | Nano Nuclear Energy Inc (NNE) |
|---|---|---|
| Revenue | 8.1B | 0 |
| Cost of Revenue | 4.9B | 0 |
| Operating Expenses | 1.8B | 45M |
| Gross Profit | 3.2B | 0 |
| EBITDA | 1.9B | -46M |
| EBIT | 1.5B | 0 |
| Interest Expense | 110M | 0 |
| Net Income | 1.1B | -40M |
| EPS | 7.97 | -1.06 |
| Fiscal Year | 2025 | 2025 |
Income Statement Analysis: The Bottom-Line Duel
This income statement comparison reveals which company operates with superior efficiency and sustainable profitability.
Dover Corporation Analysis
Dover’s revenue edged up 4.5% to 8.1B in 2025, while net income declined sharply to 1.1B from 2.7B in 2024. The firm maintains a strong gross margin near 40%, signaling solid cost control, but net margin contraction to 13.5% reflects profitability pressure. Recent momentum shows weakening EBIT and net margin, challenging its operating efficiency.
Nano Nuclear Energy Inc Analysis
Nano Nuclear reports zero revenue through 2025, reflecting its early-stage status. Operating losses persist, with net income dropping to -40M in 2025 despite favorable growth in some expense metrics. The absence of sales and negative margins highlight the company’s developmental phase and lack of operational leverage.
Verdict: Established Profitability vs. Early-Stage Losses
Dover clearly dominates in scale and profitability with a sizeable revenue base and positive margins, despite recent margin setbacks. Nano Nuclear remains a pre-revenue, loss-making entity typical for its sector’s nascent stage. Investors seeking cash flow and margin stability will find Dover’s profile more attractive, while Nano Nuclear’s profile suits risk-tolerant stakeholders focused on future potential.
Financial Ratios Comparison
These vital ratios act as a diagnostic tool to expose the underlying fiscal health, valuation premiums, and capital efficiency of each company:
| Ratios | Dover Corporation (DOV) | Nano Nuclear Energy Inc (NNE) |
|---|---|---|
| ROE | 0% (2025) | -0.02% (2025) |
| ROIC | 8.9% (2024) | -0.02% (2025) |
| P/E | 24.5 (2025) | -36.5 (2025) |
| P/B | — (0 in 2025) | 0.007 (2025) |
| Current Ratio | 0 (2025) | 53.5 (2025) |
| Quick Ratio | 0 (2025) | 53.5 (2025) |
| D/E | 0 (2025) | 0.013 (2025) |
| Debt-to-Assets | 0 (2025) | 1.2% (2025) |
| Interest Coverage | 12.5 (2025) | 0 (2025) |
| Asset Turnover | 0 (2025) | 0 (2025) |
| Fixed Asset Turnover | 0 (2025) | 0 (2025) |
| Payout ratio | 26% (2025) | 0% (2025) |
| Dividend yield | 1.06% (2025) | 0% (2025) |
| Fiscal Year | 2025 | 2025 |
Efficiency & Valuation Duel: The Vital Signs
Financial ratios serve as a company’s DNA, uncovering hidden risks and operational strengths critical for informed investment decisions.
Dover Corporation
Dover shows a solid net margin at 13.5%, indicating efficient profitability, though ROE and ROIC data are unavailable, marking uncertainty in capital returns. The P/E of 24.5 suggests a fairly valued stock, neither cheap nor stretched. A modest 1.06% dividend yield signals shareholder returns through dividends, reflecting stable income distribution.
Nano Nuclear Energy Inc
Nano Nuclear posts negative profitability metrics, with ROE and ROIC around -2%, signaling operational struggles. Despite a favorable P/E of -36.5 due to negative earnings, valuation appears distorted. The firm pays no dividend, implying reinvestment in growth or R&D, yet its financial health remains fragile with mixed favorable and unfavorable ratios.
Balanced Profitability vs. Risky Growth Profile
Dover balances moderate valuation with profitability and steady dividends, presenting a more reliable risk-reward ratio. Nano Nuclear offers a high-risk profile, driven by reinvestment despite weak current profitability. Investors prioritizing stability may prefer Dover; those seeking speculative growth might lean toward Nano Nuclear.
Which one offers the Superior Shareholder Reward?
Dover Corporation (DOV) offers a balanced shareholder reward with a 1.1% dividend yield and a conservative 26% payout ratio, supported by strong free cash flow coverage (2.7x). It pairs dividends with steady buybacks, enhancing total returns sustainably. Nano Nuclear Energy Inc (NNE) pays no dividends and shows negative free cash flow, reflecting its early-stage reinvestment in R&D and growth. NNE’s massive cash reserves (5.3K per share) fuel future expansion but lack immediate shareholder payouts. I find Dover’s disciplined distribution and buyback model superior for consistent total returns in 2026, while NNE remains a high-risk growth play without current shareholder rewards.
Comparative Score Analysis: The Strategic Profile
The radar chart reveals the fundamental DNA and strategic trade-offs of Dover Corporation and Nano Nuclear Energy Inc:
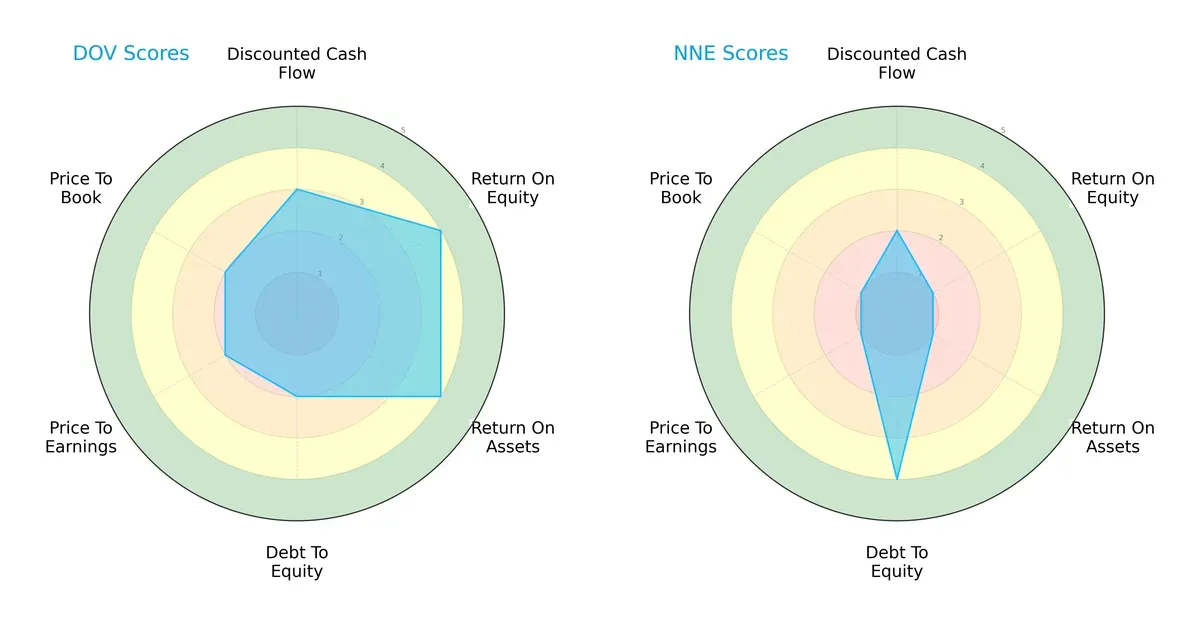
Dover exhibits a balanced profile with solid ROE (4) and ROA (4) scores, indicating efficient asset use and profitability. However, its moderate debt-to-equity (2) and valuation scores (PE/PB at 2) suggest caution on leverage and price. Nano Nuclear leans heavily on a strong debt-to-equity score (4), signaling a conservative balance sheet. Yet, it suffers from very weak profitability (ROE 1, ROA 1) and valuation metrics (PE/PB 1), showing reliance on financial stability rather than earnings. Dover’s diversified strengths outweigh Nano Nuclear’s niche edge.
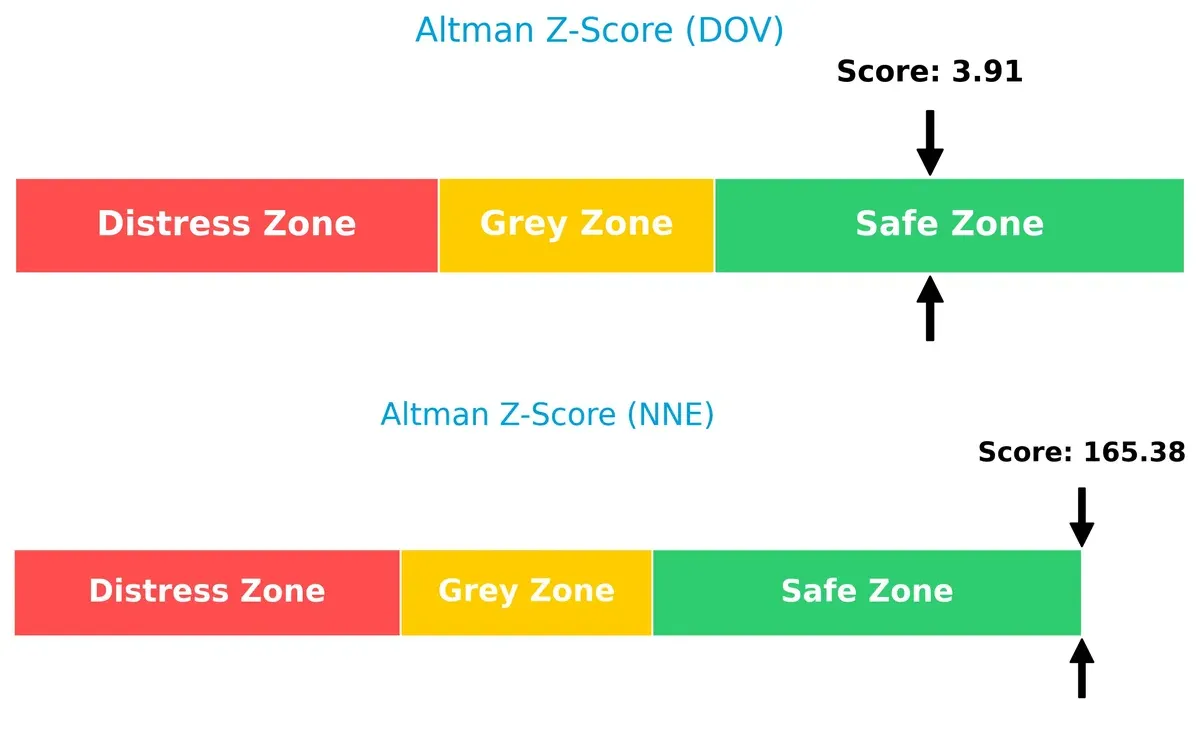
Bankruptcy Risk: Solvency Showdown
Dover’s Altman Z-Score stands at 3.91 versus Nano Nuclear’s 165.38, both firmly in the safe zone. This massive delta underlines Nano Nuclear’s exceptionally robust solvency and long-term survival prospects, while Dover remains solid but comparatively more vulnerable:
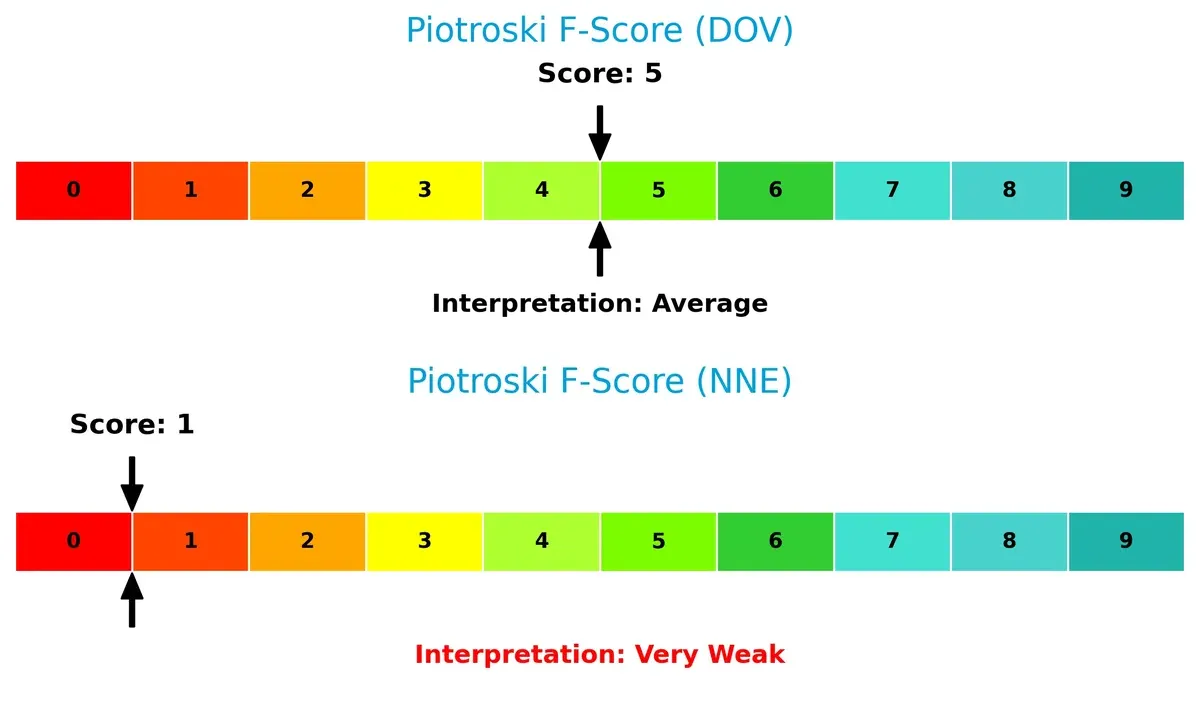
Financial Health: Quality of Operations
Dover posts a Piotroski F-Score of 5, reflecting average financial health with some operational strengths. Nano Nuclear’s 1 signals red flags in profitability and efficiency, exposing internal weaknesses that investors must monitor closely:
How are the two companies positioned?
This section dissects the operational DNA of Dover and Nano Nuclear Energy by comparing their revenue distribution and internal dynamics. The goal is to confront their economic moats and identify which model offers the most resilient competitive advantage today.
Revenue Segmentation: The Strategic Mix
This comparison dissects how Dover Corporation and Nano Nuclear Energy Inc diversify their income streams and highlights their primary sector bets:
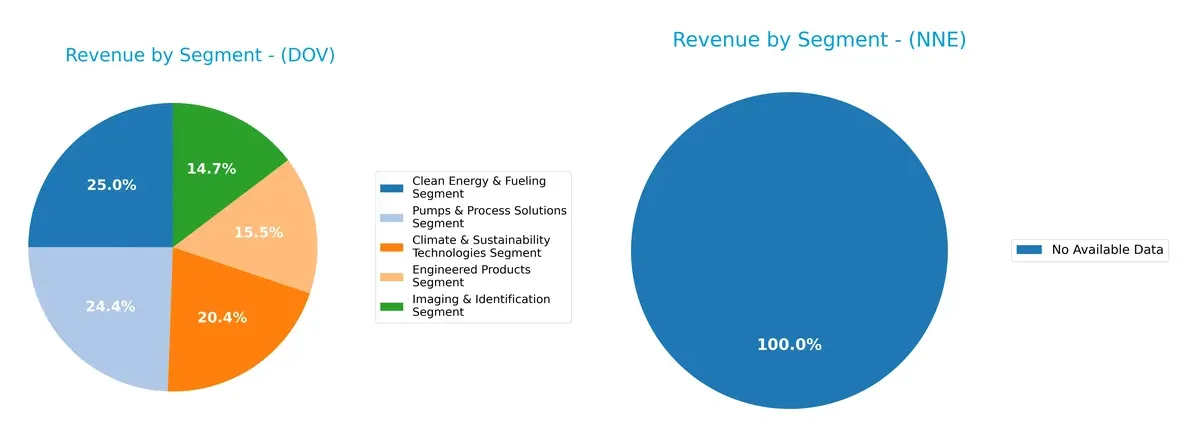
Dover Corporation reveals a well-balanced revenue mix across five key segments, each generating between $1.1B and $1.9B. This diversification reduces concentration risk and supports resilience amid market cycles. In contrast, Nano Nuclear Energy Inc lacks available segmentation data, preventing insight into its strategic revenue distribution. Dover’s broad portfolio anchors its market position through ecosystem lock-in across industrial and sustainability technologies.
Strengths and Weaknesses Comparison
This table compares the strengths and weaknesses of Dover Corporation and Nano Nuclear Energy Inc based on diversification, profitability, financials, innovation, global presence, and market share:
Dover Corporation Strengths
- Diversified revenue streams across five segments
- Favorable net margin at 13.52%
- Strong interest coverage ratio of 13.52
- Low debt-to-assets ratio at 0%
- Significant global presence with revenues from Americas, Asia, Europe, and US
- Favorable price-to-book ratio near zero
Nano Nuclear Energy Inc Strengths
- Favorable price-to-earnings ratio due to negative value
- Favorable price-to-book ratio at 0.01
- Very low debt-to-assets ratio at 1.22%
- Favorable quick ratio at 53.48
- Favorable debt-to-equity ratio near zero
- Emerging innovation potential as a nuclear energy company
Dover Corporation Weaknesses
- Unfavorable return on equity and return on invested capital at 0%
- Unavailable weighted average cost of capital data
- Unfavorable current and quick ratios at zero
- Unfavorable asset and fixed asset turnover ratios at zero
- Slightly unfavorable global ratio opinion with 42.86% unfavorable ratios
- Neutral dividend yield at 1.06%
Nano Nuclear Energy Inc Weaknesses
- Unfavorable net margin at 0% and negative ROE/ROIC at -0.02%
- Unfavorable weighted average cost of capital at 13.87%
- Unfavorable current ratio at 53.48 despite quick ratio strength
- Zero interest coverage ratio
- Unfavorable asset and fixed asset turnover ratios at zero
- Zero dividend yield and overall unfavorable global ratios opinion
Dover Corporation shows strength in diversified revenue and solid profitability metrics despite some liquidity and efficiency weaknesses. Nano Nuclear Energy has favorable valuation and low leverage but struggles with profitability and operational efficiency, indicating early-stage challenges. Both companies face significant risks that shape their strategic priorities.
The Moat Duel: Analyzing Competitive Defensibility
A structural moat is the only safeguard for long-term profits against relentless competitive pressure. Let’s dissect how these two firms defend their turf:
Dover Corporation: Diversified Industrial Engineering Moat
Dover relies on intangible assets and a diversified product portfolio, yielding stable margins and a 13.5% net margin in 2025. However, declining ROIC signals emerging pressure on its competitive edge heading into 2026.
Nano Nuclear Energy Inc: Emerging Technology Moat
Nano Nuclear hinges on proprietary microreactor technology, contrasting Dover’s broad industrial base. Despite a negative ROIC versus WACC, its rapidly improving profitability and innovation pipeline hint at a deepening moat potential in 2026.
Industrial Legacy vs. Disruptive Innovation
Dover’s moat is broader due to diversified cash flows and established markets. Nano Nuclear’s moat is narrower but deepening, driven by technological advancements. Dover remains better positioned to defend market share today, while Nano Nuclear’s moat is a high-risk, high-reward story.
Which stock offers better returns?
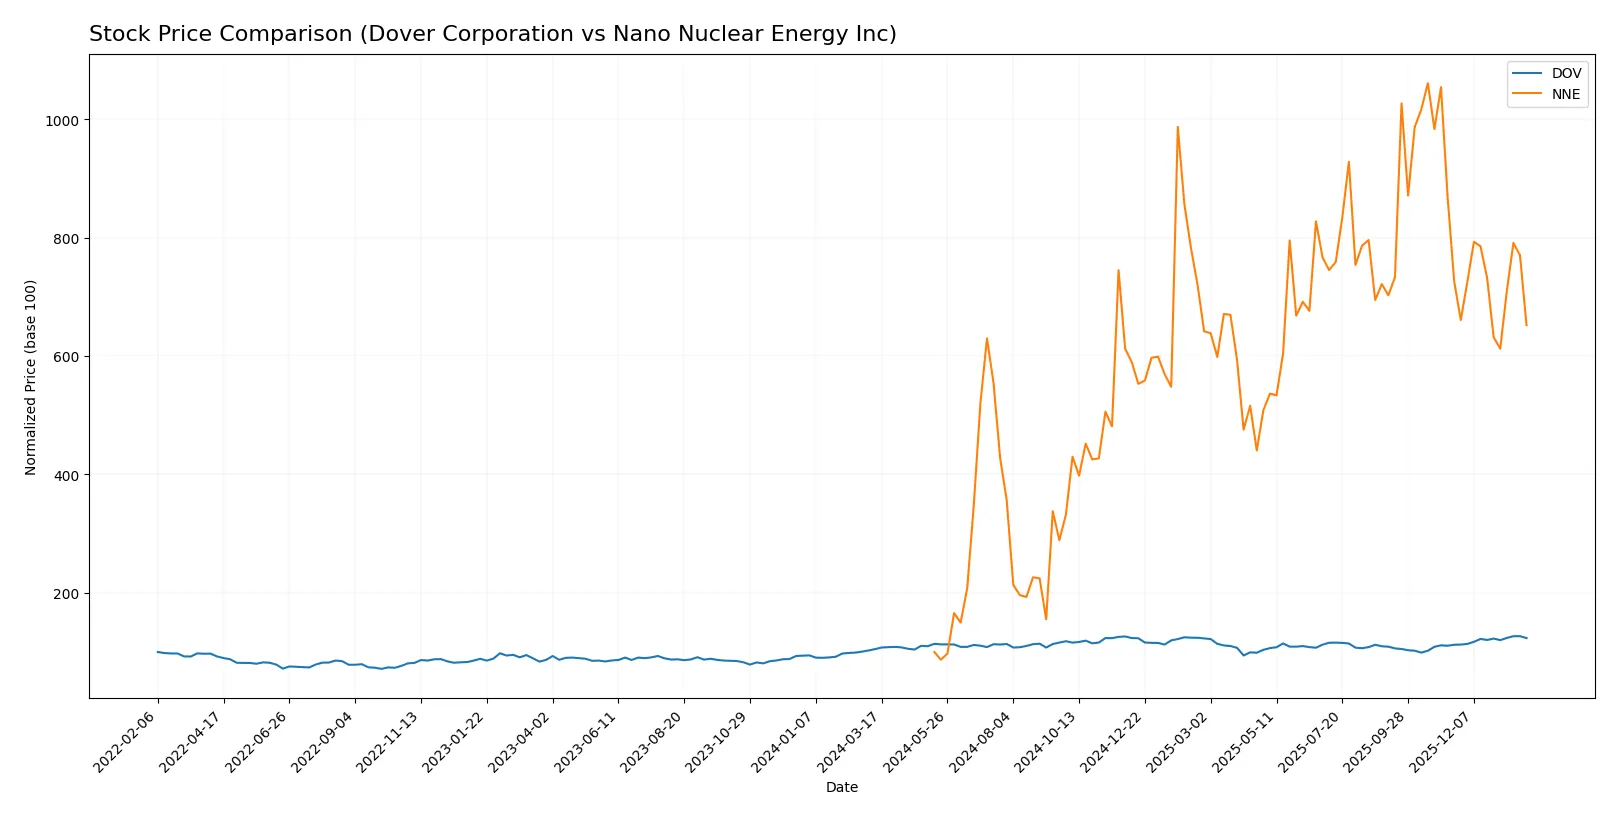
Dover Corporation and Nano Nuclear Energy Inc have shown starkly contrasting price moves over the past year, with Dover accelerating upward while Nano Nuclear’s growth decelerates despite massive overall gains.
Trend Comparison
Dover Corporation’s stock rose 17.81% over the past year, showing a bullish trend with accelerating momentum and a high volatility of 11.33%. It peaked at 206.71 and bottomed at 153.55.
Nano Nuclear Energy’s stock surged 551.88% over the year, maintaining a bullish trend but with decelerating gains. Recent months show a bearish reversal of -10.26%, with volatility at 10.7% and a low of 3.92.
Nano Nuclear Energy delivered significantly higher annual returns but recently weakened. Dover’s steady acceleration contrasts with Nano Nuclear’s sharp slowdown and recent selling pressure.
Target Prices
Analysts present a cautiously optimistic target consensus for Dover Corporation and Nano Nuclear Energy Inc.
| Company | Target Low | Target High | Consensus |
|---|---|---|---|
| Dover Corporation | 195 | 256 | 221.38 |
| Nano Nuclear Energy Inc | 50 | 50 | 50 |
For Dover, the consensus target of 221.38 exceeds the current price of 201.49, indicating moderate upside potential. Nano Nuclear’s target is flat at 50, suggesting strong expected growth from the current 29.40 price.

Don’t Let Luck Decide Your Entry Point
Optimize your entry points with our advanced ProRealTime indicators. You’ll get efficient buy signals with precise price targets for maximum performance. Start outperforming now!
How do institutions grade them?
Dover Corporation Grades
The following table summarizes recent grades assigned to Dover Corporation by major institutions.
| Grading Company | Action | New Grade | Date |
|---|---|---|---|
| JP Morgan | maintain | Overweight | 2026-01-30 |
| Wells Fargo | maintain | Equal Weight | 2026-01-30 |
| RBC Capital | maintain | Sector Perform | 2026-01-30 |
| Oppenheimer | maintain | Outperform | 2026-01-26 |
| JP Morgan | maintain | Overweight | 2026-01-16 |
| Barclays | maintain | Equal Weight | 2026-01-07 |
| Wells Fargo | maintain | Equal Weight | 2026-01-07 |
| UBS | upgrade | Buy | 2026-01-05 |
| Wells Fargo | maintain | Equal Weight | 2025-12-15 |
| Oppenheimer | maintain | Outperform | 2025-11-14 |
Nano Nuclear Energy Inc Grades
The following table shows recent grades assigned to Nano Nuclear Energy Inc by recognized grading firms.
| Grading Company | Action | New Grade | Date |
|---|---|---|---|
| HC Wainwright & Co. | maintain | Buy | 2025-08-19 |
| Ladenburg Thalmann | downgrade | Sell | 2025-08-18 |
| HC Wainwright & Co. | maintain | Buy | 2025-08-15 |
| HC Wainwright & Co. | maintain | Buy | 2025-03-31 |
| HC Wainwright & Co. | maintain | Buy | 2025-01-29 |
| HC Wainwright & Co. | maintain | Buy | 2024-11-27 |
| Benchmark | maintain | Buy | 2024-11-07 |
| Benchmark | maintain | Buy | 2024-07-15 |
| Benchmark | maintain | Buy | 2024-06-25 |
Which company has the best grades?
Dover Corporation’s grades range mainly between Overweight, Equal Weight, and Outperform, reflecting moderate confidence. Nano Nuclear Energy Inc shows mostly Buy ratings but includes a significant Sell downgrade. Investors should weigh consistent moderate support against mixed signals.
Risks specific to each company
The following categories identify the critical pressure points and systemic threats facing both firms in the 2026 market environment:
1. Market & Competition
Dover Corporation
- Established industrial machinery player with diversified product lines facing mature market pressures.
Nano Nuclear Energy Inc
- Emerging microreactor tech firm in a nascent, highly volatile nuclear energy segment with disruptive potential.
2. Capital Structure & Debt
Dover Corporation
- Maintains favorable debt-to-equity ratios and strong interest coverage, indicating solid financial stability.
Nano Nuclear Energy Inc
- Exceptionally low debt but zero interest coverage raises concerns about earnings and ability to service obligations.
3. Stock Volatility
Dover Corporation
- Beta of 1.3 suggests moderate market sensitivity typical for industrials; relatively stable trading range.
Nano Nuclear Energy Inc
- Very high beta of 7.5 signals extreme volatility and risk, reflecting speculative investor sentiment.
4. Regulatory & Legal
Dover Corporation
- Operates in regulated industrial sectors but benefits from established compliance frameworks.
Nano Nuclear Energy Inc
- Faces elevated regulatory scrutiny linked to nuclear technology development and licensing risks.
5. Supply Chain & Operations
Dover Corporation
- Diverse global supply chain supports multiple industrial end-markets; potential exposure to raw material cost fluctuations.
Nano Nuclear Energy Inc
- Early-stage operational setup with limited scale; supply chain vulnerabilities could impede product development timelines.
6. ESG & Climate Transition
Dover Corporation
- Invests in clean energy technologies, aligning with sustainability trends and regulatory demands.
Nano Nuclear Energy Inc
- Nuclear energy focus aligns with low-carbon goals but faces public perception and waste disposal challenges.
7. Geopolitical Exposure
Dover Corporation
- Global footprint exposes it to trade tensions and currency risks but benefits from diversified markets.
Nano Nuclear Energy Inc
- Concentrated US operations limit geopolitical risk but may restrict international growth opportunities.
Which company shows a better risk-adjusted profile?
Dover Corporation’s most impactful risk lies in balancing mature market competition against innovation demands. Nano Nuclear Energy’s prime risk is extreme stock volatility fueled by unproven technology and regulatory uncertainty. I find Dover’s diversified business and solid financial health offer a more balanced risk-adjusted profile. Nano Nuclear’s high beta and weak profitability metrics highlight significant speculative risk, despite its clean energy promise. The recent sharp 8.5% share price drop in Nano Nuclear underscores investor nervousness around its execution and regulatory hurdles.
Final Verdict: Which stock to choose?
Dover Corporation’s superpower lies in its robust cash generation and operational resilience, evidenced by stable gross margins and a solid interest coverage ratio. However, its declining ROIC trend signals caution on capital efficiency. Dover suits investors seeking steady income with moderate growth in an income-oriented portfolio.
Nano Nuclear Energy Inc commands a strategic moat in emerging nuclear technology, offering a high-growth runway driven by innovation and a strong balance sheet liquidity. Its financial volatility and negative profitability are clear points of vigilance. NNE fits well in high-risk, high-reward growth portfolios willing to embrace uncertainty.
If you prioritize capital preservation and consistent cash flow, Dover outshines with safer fundamentals and a more predictable business model. However, if you seek aggressive growth and can tolerate elevated risk, Nano Nuclear Energy offers superior upside potential fueled by breakthrough technology, despite its current financial challenges.
Disclaimer: Investment carries a risk of loss of initial capital. The past performance is not a reliable indicator of future results. Be sure to understand risks before making an investment decision.
Go Further
I encourage you to read the complete analyses of Dover Corporation and Nano Nuclear Energy Inc to enhance your investment decisions: