Home > Comparison > Industrials > DOV vs KAI
The strategic rivalry between Dover Corporation and Kadant Inc. shapes the industrial machinery landscape in 2026. Dover operates as a diversified industrial giant, delivering equipment, software, and services across multiple end-markets. Kadant, a focused engineered systems specialist, targets niche segments like flow control and material handling. This analysis evaluates which operational model offers a superior risk-adjusted return for diversified portfolios amidst evolving industrial demands.
Table of contents
Companies Overview
Dover Corporation and Kadant Inc. stand as key players in the industrial machinery sector with distinct market footprints.
Dover Corporation: Industrial Powerhouse in Engineered Solutions
Dover Corporation dominates the industrial machinery market by providing equipment, components, and software solutions across diverse segments. Its revenue stems from engineered products, clean energy fueling, imaging, pumps, and climate technologies. In 2026, Dover focuses strategically on integrating digital solutions with traditional hardware to enhance aftermarket services and sustainable energy transport.
Kadant Inc.: Specialist in Flow and Material Handling Systems
Kadant Inc. carves its niche by developing engineered systems in flow control, industrial processing, and material handling. Its core revenue comes from fluid-handling systems, pulping equipment, and biodegradable absorbents. In 2026, Kadant prioritizes advancing automation and environmental sustainability within packaging and alternative fuel industries.
Strategic Collision: Similarities & Divergences
Both companies emphasize engineered industrial machinery but diverge in scope; Dover pursues a broad multi-segment portfolio while Kadant targets specialized process systems. Their primary battleground lies in industrial automation and sustainability markets. Dover’s scale contrasts with Kadant’s focused innovation, creating distinct investment profiles shaped by diversification versus specialization.
Income Statement Comparison
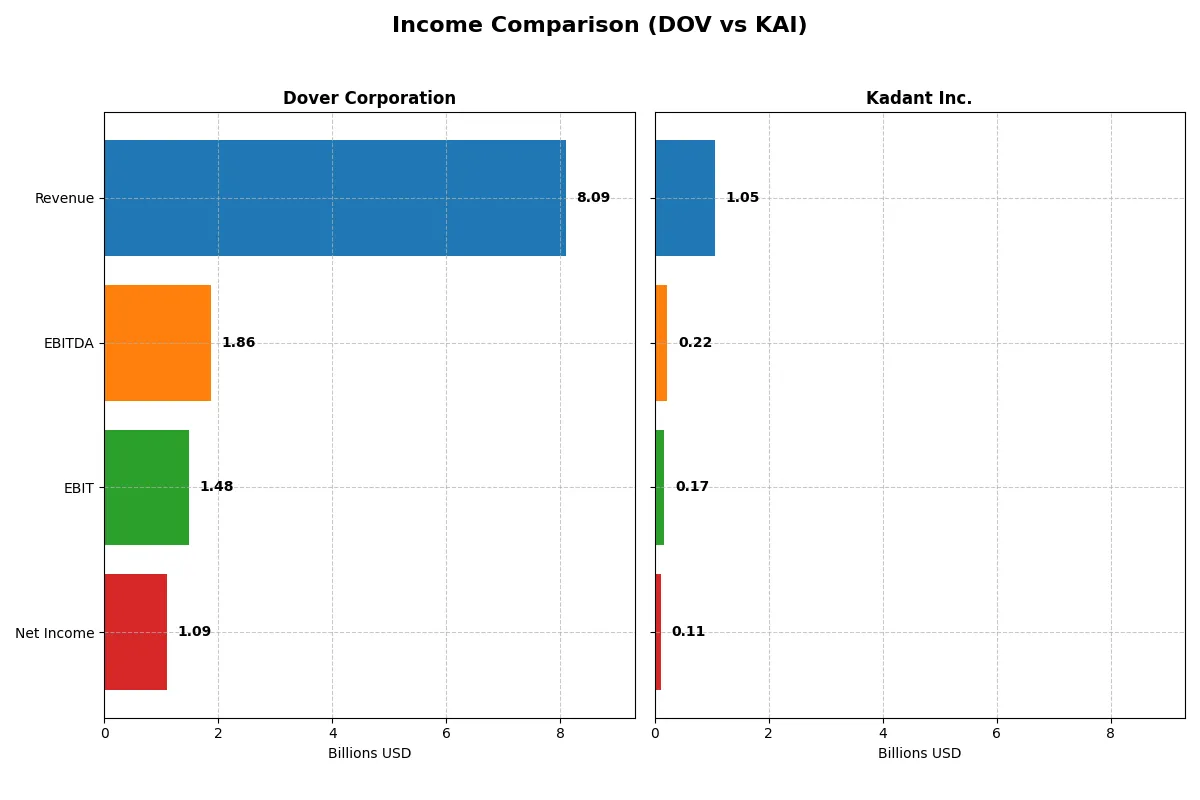
This data dissects the core profitability and scalability of both corporate engines to reveal who dominates the bottom line:
| Metric | Dover Corporation (DOV) | Kadant Inc. (KAI) |
|---|---|---|
| Revenue | 8.1B | 1.1B |
| Cost of Revenue | 4.9B | 587M |
| Operating Expenses | 1.8B | 294M |
| Gross Profit | 3.2B | 466M |
| EBITDA | 1.9B | 223M |
| EBIT | 1.5B | 173M |
| Interest Expense | 110M | 20M |
| Net Income | 1.1B | 112M |
| EPS | 7.97 | 9.51 |
| Fiscal Year | 2025 | 2024 |
Income Statement Analysis: The Bottom-Line Duel
This income statement comparison reveals which company drives superior operational efficiency and profit generation in their respective markets.
Dover Corporation Analysis
Dover’s revenue shows modest growth, reaching 8.1B in 2025, while net income declined sharply to 1.09B from 2.7B in 2024. Gross and net margins remain strong at 39.8% and 13.5%, respectively, but the 2025 net margin contraction signals waning profitability momentum. Operating expenses grew in line with revenue, pressuring EBIT which fell 21%.
Kadant Inc. Analysis
Kadant posts healthy revenue growth, hitting 1.05B in 2024, with net income at 112M slightly down from 116M in 2023. Margins remain solid, with a gross margin of 44.3% and a net margin of 10.6%. Despite a small dip in net margin and EPS growth last year, overall the company exhibits strong multi-year expansion in revenue (66%) and net income (102%), reflecting robust operational leverage.
Margin Strength vs. Growth Resilience
Kadant outperforms Dover in consistent revenue and income growth, underpinned by higher gross margins and a favorable long-term trajectory. Dover’s superior current margins are overshadowed by a significant one-year profit decline and stagnant revenue. For investors, Kadant’s growth profile combined with margin resilience offers a more attractive foundation in 2026’s market environment.
Financial Ratios Comparison
These vital ratios act as a diagnostic tool to expose the underlying fiscal health, valuation premiums, and capital efficiency of the companies compared below:
| Ratios | Dover Corporation (DOV) | Kadant Inc. (KAI) |
|---|---|---|
| ROE | 20.7% (2023) | 15.0% (2023) |
| ROIC | 10.8% (2023) | 12.6% (2023) |
| P/E | 20.4x (2023) | 28.3x (2023) |
| P/B | 4.21x (2023) | 4.24x (2023) |
| Current Ratio | 1.40 (2023) | 2.05 (2023) |
| Quick Ratio | 0.90 (2023) | 1.34 (2023) |
| D/E | 0.72 (2023) | 0.18 (2023) |
| Debt-to-Assets | 32.4% (2023) | 11.5% (2023) |
| Interest Coverage | 9.3x (2023) | 19.7x (2023) |
| Asset Turnover | 0.68 (2023) | 0.81 (2023) |
| Fixed Asset Turnover | 7.45x (2023) | 5.78x (2023) |
| Payout Ratio | 27.0% (2023) | 11.4% (2023) |
| Dividend Yield | 1.32% (2023) | 0.40% (2023) |
| Fiscal Year | 2023 | 2023 |
Efficiency & Valuation Duel: The Vital Signs
Financial ratios serve as a company’s DNA, unveiling hidden risks and operational excellence beneath the surface.
Dover Corporation
Dover shows a strong net margin of 13.52%, signaling solid profitability, but its ROE and ROIC stand at zero, a notable weakness. The P/E ratio at 24.49 appears fair, not stretched. Dover offers a modest 1.06% dividend yield, balancing shareholder returns with reinvestment in growth areas like R&D, though some liquidity ratios raise caution.
Kadant Inc.
Kadant posts a favorable net margin of 10.59% and a neutral ROE at 13.17%, indicating decent profitability. However, its valuation feels stretched with a high P/E of 36.9 and a steep P/B of 4.86. The company maintains conservative debt levels and strong liquidity but delivers a low 0.36% dividend yield, favoring reinvestment over payouts.
Premium Valuation vs. Operational Safety
Kadant impresses with operational efficiency and balance sheet strength but trades at a premium valuation. Dover offers better profitability metrics yet faces concerns in return ratios and liquidity. Investors seeking stability may lean toward Dover’s profile, while those accepting valuation risk might prefer Kadant’s growth orientation.
Which one offers the Superior Shareholder Reward?
I compare Dover Corporation (DOV) and Kadant Inc. (KAI) on their shareholder reward strategies. Dover yields about 1.1% with a moderate payout ratio near 26%, backed by strong free cash flow coverage (2.66x dividend+capex). Dover also executes measured buybacks, balancing distributions and reinvestment sustainably. Kadant yields a lower 0.36% with a 13% payout ratio, signaling a growth-focused reinvestment approach supported by robust free cash flow (4.35x dividend+capex) and aggressive buybacks. Historically, Dover’s steady dividends and buybacks offer a balanced total return. Kadant’s lower yield but stronger buyback intensity and reinvestment suggest higher growth potential but less immediate income. For 2026, I find Dover’s distribution model more sustainable and attractive for total return investors seeking income plus capital appreciation.
Comparative Score Analysis: The Strategic Profile
The radar chart reveals the core DNA and trade-offs between Dover Corporation and Kadant Inc., highlighting their distinct financial strengths and weaknesses:
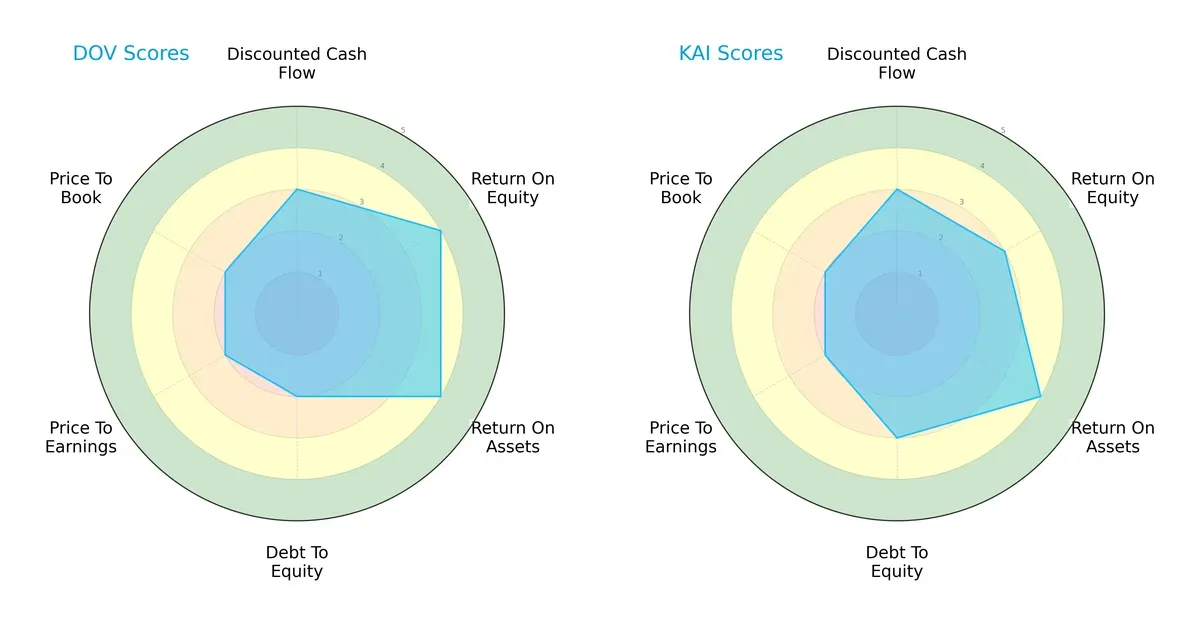
Dover excels in return on equity (4 vs. 3) and return on assets (4 vs. 4, tied), indicating efficient profit generation and asset use. Kadant shows a stronger debt-to-equity score (3 vs. 2), suggesting a healthier balance sheet. Both share moderate discounted cash flow and valuation scores, but Dover’s profile leans on profitability, while Kadant balances leverage and operational efficiency.
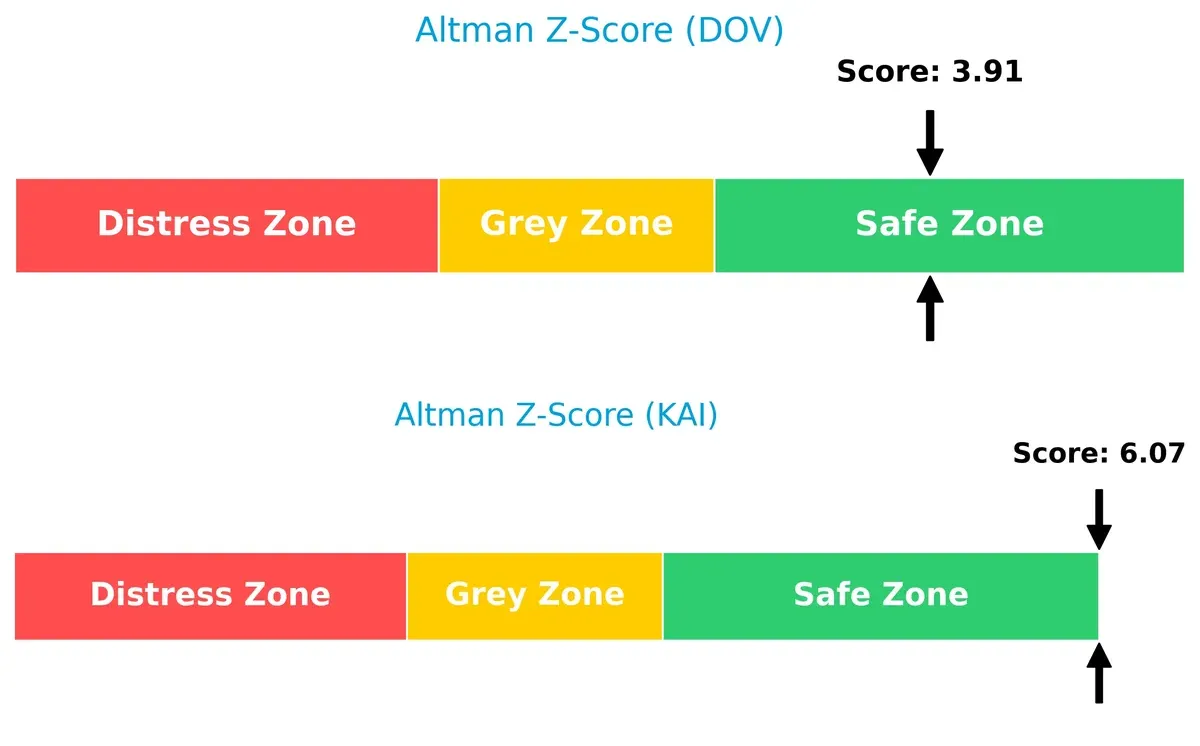
Bankruptcy Risk: Solvency Showdown
Kadant’s Altman Z-Score of 6.07 significantly outpaces Dover’s 3.91, implying a stronger solvency position and lower bankruptcy risk during this economic cycle:
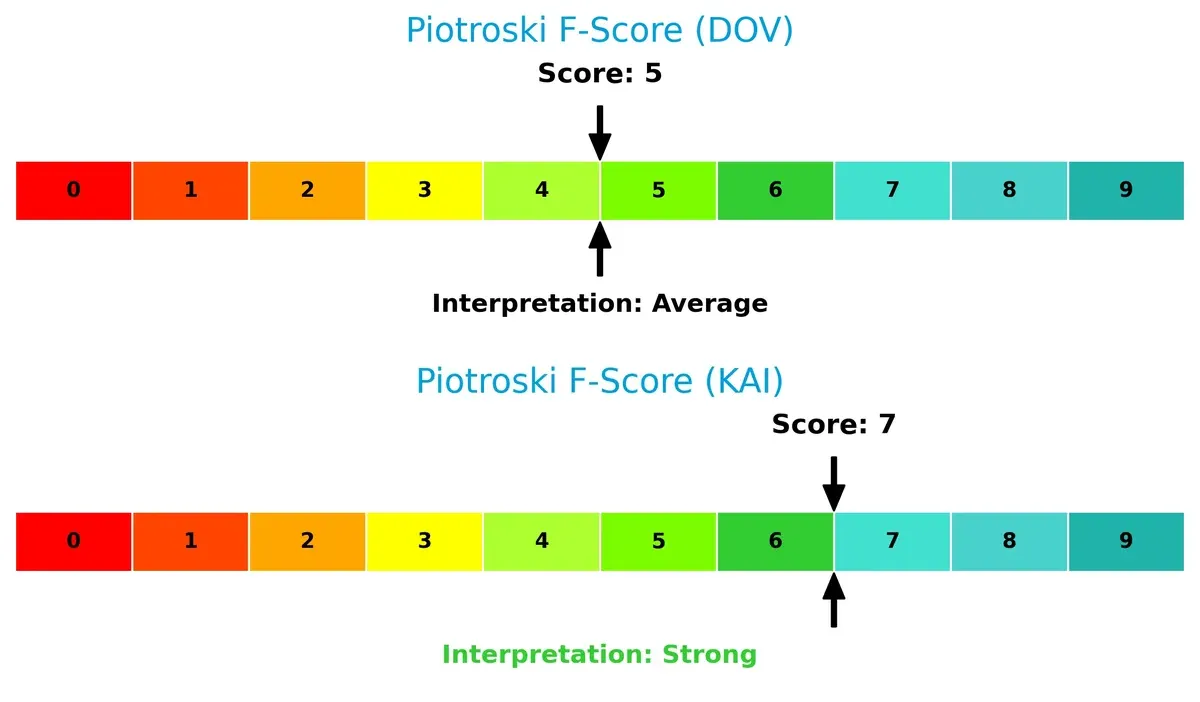
Financial Health: Quality of Operations
Kadant scores a robust 7 on the Piotroski F-Score, outperforming Dover’s average 5, signaling superior internal financial health and fewer operational red flags:
How are the two companies positioned?
This section dissects DOV and KAI’s operational DNA by comparing their revenue distribution and internal strengths and weaknesses. The goal is to confront their economic moats and identify which model offers the most resilient competitive advantage today.
Revenue Segmentation: The Strategic Mix
This comparison dissects how Dover Corporation and Kadant Inc. diversify their income streams and where their primary sector bets lie:
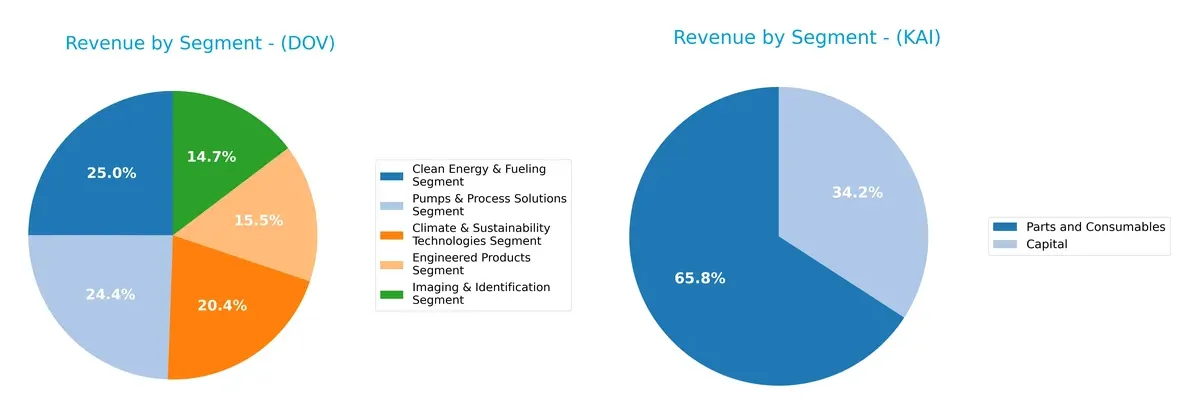
Dover posts a broad revenue base with five segments each contributing roughly $1.1B to $1.9B, reflecting a diversified industrial portfolio. Kadant relies heavily on two segments, Parts and Consumables at $694M and Capital at $360M, showing concentration in niche markets. Dover’s spread reduces concentration risk and fosters ecosystem lock-in, while Kadant’s focus suggests operational depth but exposes it to sector-specific downturns.
Strengths and Weaknesses Comparison
This table compares the strengths and weaknesses of Dover Corporation and Kadant Inc. based on diversification, profitability, financials, innovation, global presence, and market share:
Dover Corporation Strengths
- Broad product diversification across five segments
- Favorable net margin at 13.52%
- Strong interest coverage ratio at 13.52
- Low debt and debt-to-assets ratios indicate financial stability
- Extensive global presence with significant U.S. and Europe sales
Kadant Inc. Strengths
- Favorable profitability metrics including 10.08% ROIC and 10.59% net margin
- Healthy liquidity with current ratio of 2.31 and quick ratio of 1.55
- Moderate leverage with favorable debt-to-assets at 22.57%
- Innovation shown by high fixed asset turnover of 6.18
- Concentrated but stable geographic presence primarily in North America, Europe, and Asia
Dover Corporation Weaknesses
- Unfavorable ROE and ROIC at 0% reflect poor capital efficiency
- Poor liquidity ratios (current and quick ratios at 0) raise red flags
- Asset turnover metrics unfavorable, indicating inefficient asset use
- Neutral PE ratio suggests valuation is not compelling
- Slightly unfavorable overall financial ratio profile
Kadant Inc. Weaknesses
- Unfavorable valuation metrics: high PE at 36.9 and PB at 4.86
- Lower dividend yield at 0.36% suggests limited income return
- Neutral and unfavorable ratios reduce financial attractiveness
- More concentrated product portfolio risks exposure to end market cyclicality
Overall, Dover shows strength in diversification and financial conservatism but suffers from weak capital efficiency and liquidity. Kadant exhibits solid profitability and asset efficiency but faces valuation and dividend yield challenges. These contrasts highlight strategic trade-offs between diversification and focused specialization.
The Moat Duel: Analyzing Competitive Defensibility
A structural moat is the only true shield against long-term profit erosion from competition. Let’s analyze how Dover and Kadant defend their turf:
Dover Corporation: Diversified Industrial Synergies
Dover’s moat hinges on intangible assets and broad market reach across industrial segments. Stable margins near 18% EBIT reflect operational strength. However, declining ROIC signals emerging pressure on capital efficiency in 2026.
Kadant Inc.: Niche Innovation with Operational Leverage
Kadant’s moat centers on specialized engineered systems and cost advantages in fluid handling and material processing. Its growing ROIC and 31% improvement over five years show improving capital use and margin expansion opportunities ahead.
Verdict: Broad Diversification vs. Focused Capital Efficiency
Dover’s diversified portfolio offers scale but suffers from declining capital returns. Kadant’s rising ROIC and focused innovation suggest a deeper moat forming. I see Kadant better positioned to defend and grow market share through operational improvements.
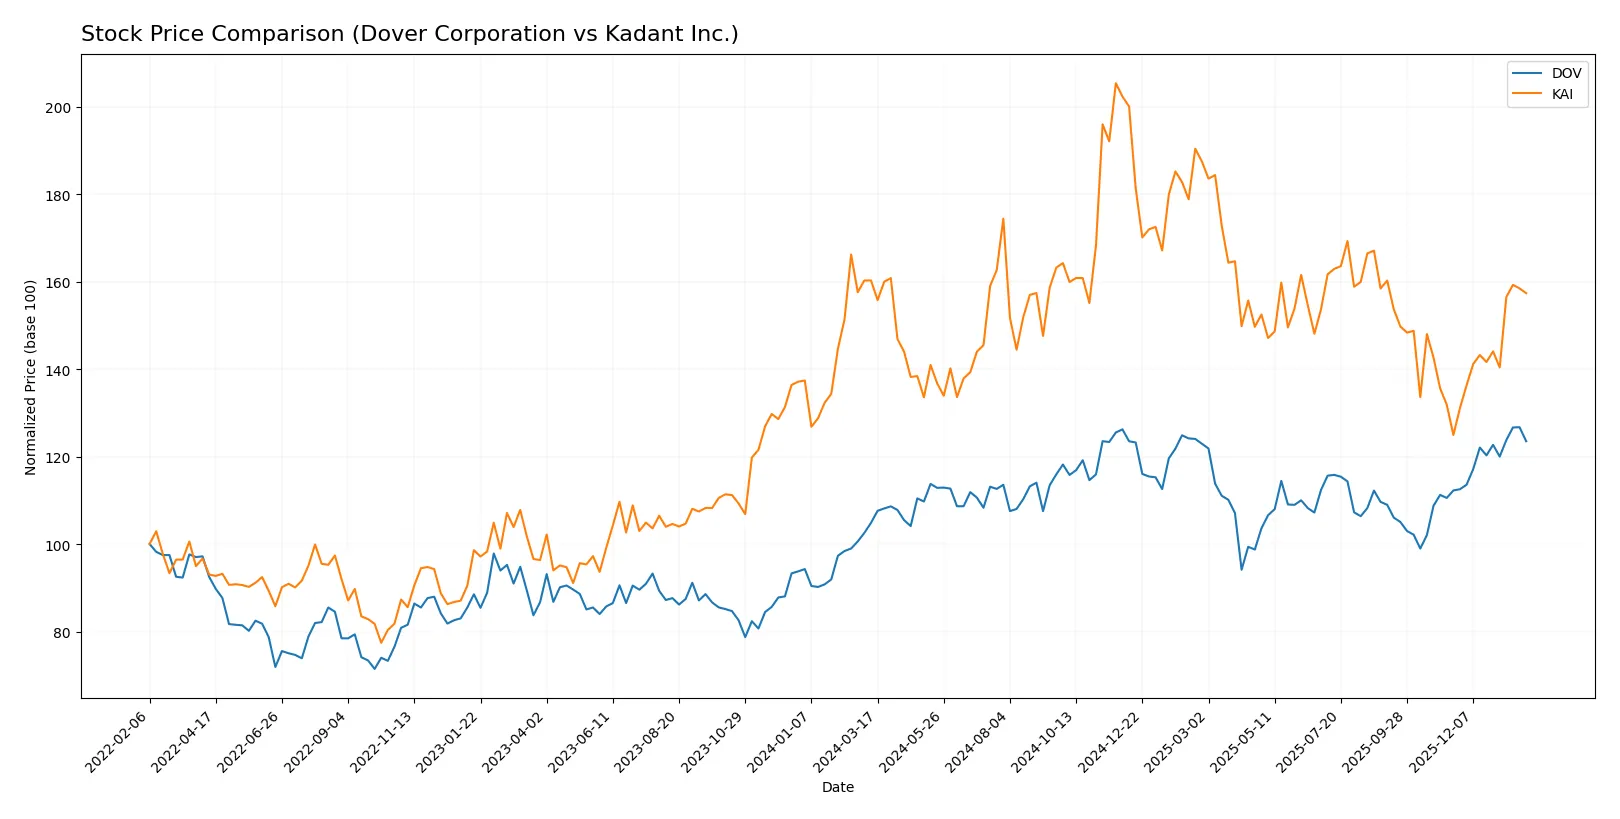
Which stock offers better returns?
The past year shows Dover Corporation’s price rising steadily with acceleration, while Kadant Inc. experiences a mild overall decline but strong recent gains.
Trend Comparison
Dover Corporation’s stock increased 17.81% over the past 12 months, marking a bullish trend with accelerating momentum and a high near 207. Volatility remains moderate with an 11.33 std deviation.
Kadant Inc.’s stock fell 1.82% over the same period, indicating a bearish trend despite recent acceleration and a 25.94% gain since November. Volatility is high with a 34.39 std deviation.
Dover outperformed Kadant overall in the last year, delivering stronger market returns despite Kadant’s recent spike in price.
Target Prices
Analysts show a confident upside for both Dover Corporation and Kadant Inc., reflecting strong sector fundamentals.
| Company | Target Low | Target High | Consensus |
|---|---|---|---|
| Dover Corporation | 195 | 256 | 221.38 |
| Kadant Inc. | 275 | 410 | 342.5 |
The consensus targets exceed current prices by 10%+ for Dover and about 7% for Kadant, indicating moderate analyst optimism.

Don’t Let Luck Decide Your Entry Point
Optimize your entry points with our advanced ProRealTime indicators. You’ll get efficient buy signals with precise price targets for maximum performance. Start outperforming now!
How do institutions grade them?
Dover Corporation Grades
The following table summarizes recent institutional grades for Dover Corporation.
| Grading Company | Action | New Grade | Date |
|---|---|---|---|
| JP Morgan | Maintain | Overweight | 2026-01-30 |
| Wells Fargo | Maintain | Equal Weight | 2026-01-30 |
| RBC Capital | Maintain | Sector Perform | 2026-01-30 |
| Oppenheimer | Maintain | Outperform | 2026-01-26 |
| JP Morgan | Maintain | Overweight | 2026-01-16 |
| Barclays | Maintain | Equal Weight | 2026-01-07 |
| Wells Fargo | Maintain | Equal Weight | 2026-01-07 |
| UBS | Upgrade | Buy | 2026-01-05 |
| Wells Fargo | Maintain | Equal Weight | 2025-12-15 |
| Oppenheimer | Maintain | Outperform | 2025-11-14 |
Kadant Inc. Grades
The following table summarizes recent institutional grades for Kadant Inc.
| Grading Company | Action | New Grade | Date |
|---|---|---|---|
| Barrington Research | Maintain | Outperform | 2025-10-30 |
| Barrington Research | Maintain | Outperform | 2025-10-29 |
| Barrington Research | Maintain | Outperform | 2025-10-27 |
| Barrington Research | Maintain | Outperform | 2025-10-10 |
| Barrington Research | Maintain | Outperform | 2025-09-23 |
| DA Davidson | Maintain | Neutral | 2025-08-04 |
| Barrington Research | Maintain | Outperform | 2025-07-30 |
| Barrington Research | Maintain | Outperform | 2025-07-29 |
| Barrington Research | Maintain | Outperform | 2025-05-01 |
| DA Davidson | Maintain | Neutral | 2025-05-01 |
Which company has the best grades?
Kadant Inc. consistently receives “Outperform” ratings from Barrington Research, signaling stronger enthusiasm. Dover Corporation’s grades are more mixed, with several “Equal Weight” and “Sector Perform” ratings. This divergence may affect investor sentiment and portfolio positioning.
Risks specific to each company
The following categories identify critical pressure points and systemic threats facing Dover Corporation and Kadant Inc. in the 2026 market environment:
1. Market & Competition
Dover Corporation
- Faces intense competition in diversified industrial machinery sectors, requiring continuous innovation and market adaptation.
Kadant Inc.
- Competes in niche industrial processing and fluid handling markets, with less scale but specialized product lines.
2. Capital Structure & Debt
Dover Corporation
- Shows favorable debt-to-equity metrics, indicating prudent leverage management, though some liquidity ratios are weak.
Kadant Inc.
- Maintains moderate leverage with strong current and quick ratios, supporting financial flexibility and debt service capacity.
3. Stock Volatility
Dover Corporation
- Exhibits beta of 1.305, slightly above market average, reflecting moderate sensitivity to market swings.
Kadant Inc.
- Beta at 1.245, slightly lower volatility than Dover but still above market baseline, signaling steady risk exposure.
4. Regulatory & Legal
Dover Corporation
- Exposure to environmental and safety regulations across multiple segments, increasing compliance costs and legal risk.
Kadant Inc.
- Faces regulatory scrutiny in industrial processing and environmental compliance, with potential impact on operations.
5. Supply Chain & Operations
Dover Corporation
- Complex global supply chains pose risks of disruption, especially in advanced manufacturing components.
Kadant Inc.
- Smaller scale supply chains may be more nimble but vulnerable to single-source dependencies and raw material price swings.
6. ESG & Climate Transition
Dover Corporation
- Invests in clean energy tech but must balance legacy industrial emissions; ESG compliance critical for reputation.
Kadant Inc.
- Focus on sustainable materials and industrial recycling aligns with climate goals, though transition costs remain.
7. Geopolitical Exposure
Dover Corporation
- Global footprint exposes company to trade tensions and tariffs, impacting supply and sales in key markets.
Kadant Inc.
- Limited international presence reduces geopolitical risks but may constrain growth opportunities outside the US.
Which company shows a better risk-adjusted profile?
Kadant’s strongest risk factor lies in its high valuation multiples, which elevate market risk despite solid financial stability. Dover’s primary concern is its weak liquidity ratios, exposing it to operational strain under adverse conditions. Overall, Kadant presents a better risk-adjusted profile supported by a higher Altman Z-score (6.07 vs. 3.91) and stronger Piotroski score (7 vs. 5). This suggests Kadant is financially healthier and better positioned to weather market fluctuations. Dover’s liquidity weaknesses, despite favorable debt metrics, signal caution for investors seeking resilience in 2026’s volatile industrial sector.
Final Verdict: Which stock to choose?
Dover Corporation’s superpower lies in its robust operational margin and strong cash generation, reflecting a well-oiled industrial engine. However, its declining return on invested capital and uneven earnings growth warrant vigilance. Dover fits portfolios targeting steady industrial exposure with a tolerance for cyclicality and operational risks.
Kadant Inc. boasts a strategic moat through improving capital efficiency and a growing return on invested capital, signaling rising profitability. Its healthier balance sheet and stronger income growth offer a safer profile relative to Dover. Kadant suits investors seeking growth at a reasonable price with a moderate risk appetite.
If you prioritize stable cash flow and industrial resilience, Dover commands attention despite some profitability headwinds. However, if you seek improving profitability and financial stability in a smaller, more focused player, Kadant offers better growth momentum and balance sheet strength. Both present compelling but distinct investment scenarios.
Disclaimer: Investment carries a risk of loss of initial capital. The past performance is not a reliable indicator of future results. Be sure to understand risks before making an investment decision.
Go Further
I encourage you to read the complete analyses of Dover Corporation and Kadant Inc. to enhance your investment decisions: